


Series Introduction
In this series, we have explored how Goal Trees and Systems Thinking can improve alignment and decision-making in semiconductor New Product Introduction (NPI), how TameFlow Kanban enhances the management of knowledge work, and the critical role of Supply Chain and Logistics in ensuring NPI success. In this article, we focus on how Critical Chain Project Management (CCPM), with its emphasis on risk management, can help teams meet schedule commitments while fostering a spirit of teamwork and collaboration.
This article is part of a series applying the Theory of Constraints (TOC) to various facets of NPI, including:
Project Management using Critical Chain Project Management (CCPM) (this article)

Disclaimer
The views, opinions, and insights expressed in this series are my own and do not reflect the official policies or strategies of my employer, Marvell Technology Italia, srl. This content is provided for educational purposes, based on personal experience and research. Any references to companies, products, or individuals are included for illustrative purposes only and do not constitute endorsements.

1. Introduction
Managing semiconductor NPI projects is a complex challenge, often plagued by delays, uncertainty, and resource constraints. Critical Chain Project Management (CCPM) offers a robust alternative to traditional project management methods like critical paths by focusing on constraints, risks, and strategic buffers. CCPM ensures on-time delivery by managing uncertainty with a practical, collaborative approach. In this article, we’ll explore CCPM's core principles, including buffer placement, duration estimation, and risk management, with a focus on practical tools like Monte Carlo simulations in SeaTable.
2. How CCPM Differs from critical Path
Traditional critical path project management focuses on identifying the critical path and managing tasks sequentially, often relying on padded task durations and fragmented risk management (Fig 1).

Fig 1 - Padded tasks in traditional PM. Protection is not pooled
In this approach, there is very little chance task B will begin earlier than its scheduled time, even if task A finishes ahead of schedule. Because padding is "masked out," three major issues arise:
Unhealthy Dynamic:
PMs or Marketing teams often suspect padding is embedded in the schedule and apply pressure to cut durations. This creates a toxic cycle: teams increase padding in response to tighter deadlines, and PMs demand even further cuts, escalating the problem over time.Lack of Shared Focus:
With padding hidden and unmanaged, team members focus only on completing their own tasks within their padded durations rather than working collaboratively toward the common goal of finishing the project on time. This fosters siloed behavior instead of teamwork.Multitasking Appetite:
Each owner of tasks know he has some "extra" padded time and can be tempted, or forced, into multitasking further reducing the probability to complete his own critical chain task in time and creating the condition for escalation needs as his focus may be shared between multiple projects all perceived equally critical.
CCPM, by contrast, builds the schedule around the critical chain, accounting for both task and resource dependencies. Instead of inflating task durations, CCPM consolidates variability into shared buffers:
Critical Chain Buffer to protect the project’s overall timeline,
Feeding Buffers to protect the critical chain from delays in non-critical paths, and
Resource Buffers (marked as "prealert" in the figure) to ensure resources are ready when needed. Please note resource buffers are normally needed only on the Critical Chain Path, feeding path have the additional degree of freedom of the Feeding Buffer, thus can use it to absorb "prealert" in most cases.
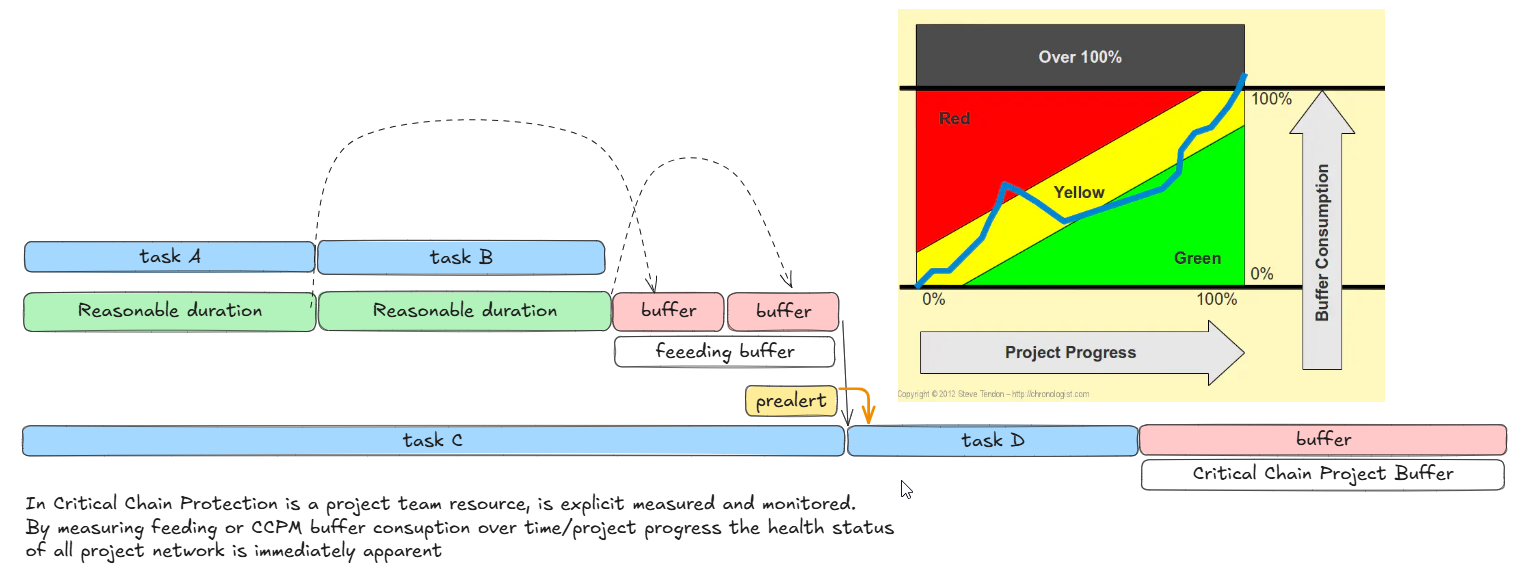
Fig 2 - CCPM pool risk protection in buffers that are part of the Project Management monitoring
By centralizing risk into these buffers (Fig 2), CCPM reduces inefficiencies, aligns resources effectively, and prioritizes the constraint: the Critical Chain. This approach fosters collaboration, ensures focus on key tasks, and minimizes delays, resulting in more predictable and streamlined project execution.
3. Estimating Durations and Buffers in CCPM
CCPM emphasizes realistic task duration estimates, aiming for a 50-70% confidence level and avoiding the excessive padding typical of traditional methods. This approach fosters accountability while relying on the buffer system to absorb the unavoidable uncertainties. Buffers are calculated as a percentage of task durations, with two common approaches:
Direct Estimation: Request task duration estimates, then schedule 50% of the estimated time, pooling the remaining 50% into a shared buffer.
PERT with Monte Carlo Simulations: Use three-point estimates (Optimistic, Most Likely, and Pessimistic). The 50% probability duration is used for scheduling, while the difference to the 90% probability duration is allocated to the buffer.
Both methods ensure accurate scheduling while centralizing variability into shared buffers, enabling robust risk management.
4. Practical Monte Carlo Tools
Personally I use SeaTable to refine CCPM by leveraging a structured approach that integrates tasks, subtasks, and task-lines. Each task is broken into subtasks, with each subtask assigned PERT estimates for its duration: optimistic, most likely, and pessimistic. Using these inputs, Monte Carlo simulations are executed to calculate task durations at two key confidence levels: the 50% estimate (median) and the 90% estimate (accounting for variability).
For each task:
Subtask Processing:
Subtasks are treated as sequential units within a task. Their durations are aggregated using PERT-based Monte Carlo simulations to compute the overall task duration (Fig 3).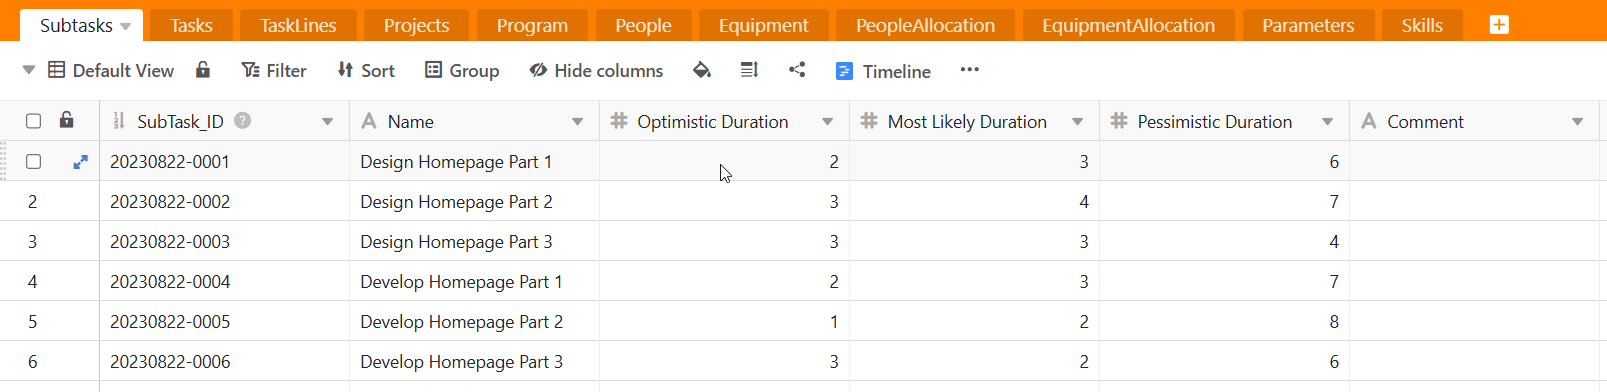
Fig 3 - PERT optimisitc most likely pessimistic estimation at subtask level
Buffer Contribution:
The difference between the 50% duration (used for scheduling) and the 90% duration (used for risk protection) is computed at task level (Fig 4) and pooled into the task-line buffer (Fig 5).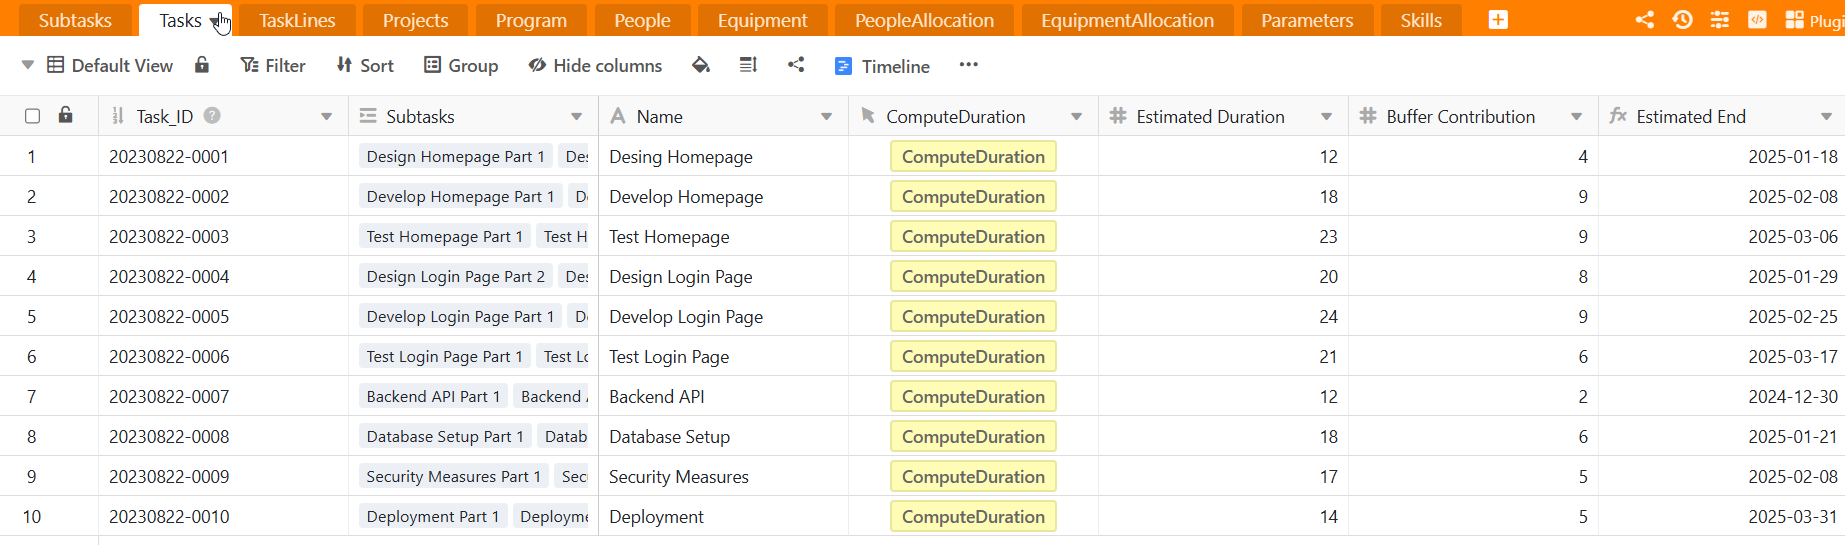
Fig 4 - Tasks have a buffer contribution computed as difference between 50% and 90% estimate
Tasks are then grouped into task-lines, which represent logical sequences of tasks within the project. Task-lines are organized in a dependency network, with the longest path defining the critical chain. The sum of all task-line buffers forms the critical chain buffer, consolidating variability across the project into a central risk pool.
Fig 5 - Tasklines are seqeuntial tasks each taskline embed the sums of its tasks buffers
This approach ensures that variability at the subtask level is fully captured and accounted for, while simplifying the scheduling process:
The 50% durations create realistic schedules without hidden padding.
Shared buffers at the task-line and critical chain levels foster a sense of shared responsibility and encourage teamwork to protect the project timeline.
By using this tool, teams can visually track the consumption of buffers, monitor residual risks, and focus resources where variability threatens project delivery. The result is a data-driven, collaborative framework that improves predictability, balances precision, and enhances project outcomes in NPI or any high variability project environment.
It must be noted that more professional sotutions exist that brings this whole appreach to a much higher level of integration and insights. For example Harmony a TOC based process and project simulation (Fig 6) product provided by Goldratt Research Labs has a Montecarlo simulation engine, buffer computation and fever chart visualization module all integrated.
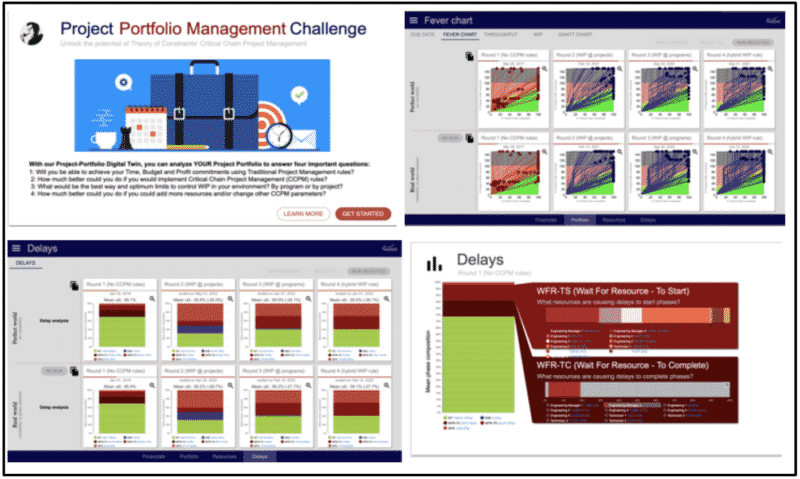
Fig 6 - Harmony change simulator montecarlo and fevercharts
5. Reporting and Monitoring: Buffer Consumption vs. EVM
Traditional project management often relies on Earned Value Management (EVM) (Fig 7), which tracks project progress by measuring the amount of completed tasks (value) against the planned schedule and budget. While EVM provides insights into what has been accomplished, it fails to account for residual risks or variability affecting future tasks.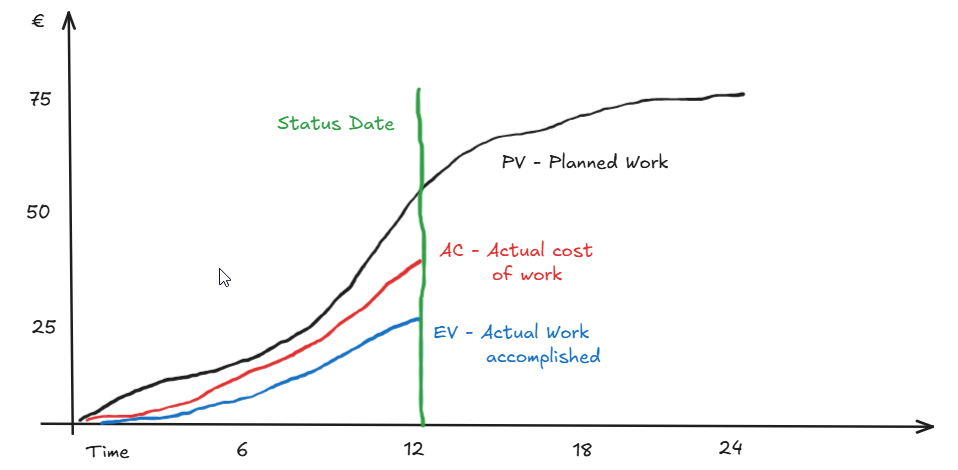
Fig 7 - Typical EVM plot
CCPM introduces buffer consumption as a more effective metric. By monitoring how much of the shared buffer has been used, teams can assess project health and risks in real-time. For example:
High buffer consumption early indicates potential variability or delays that need immediate attention.
Low buffer consumption signals well-controlled progress and stability.
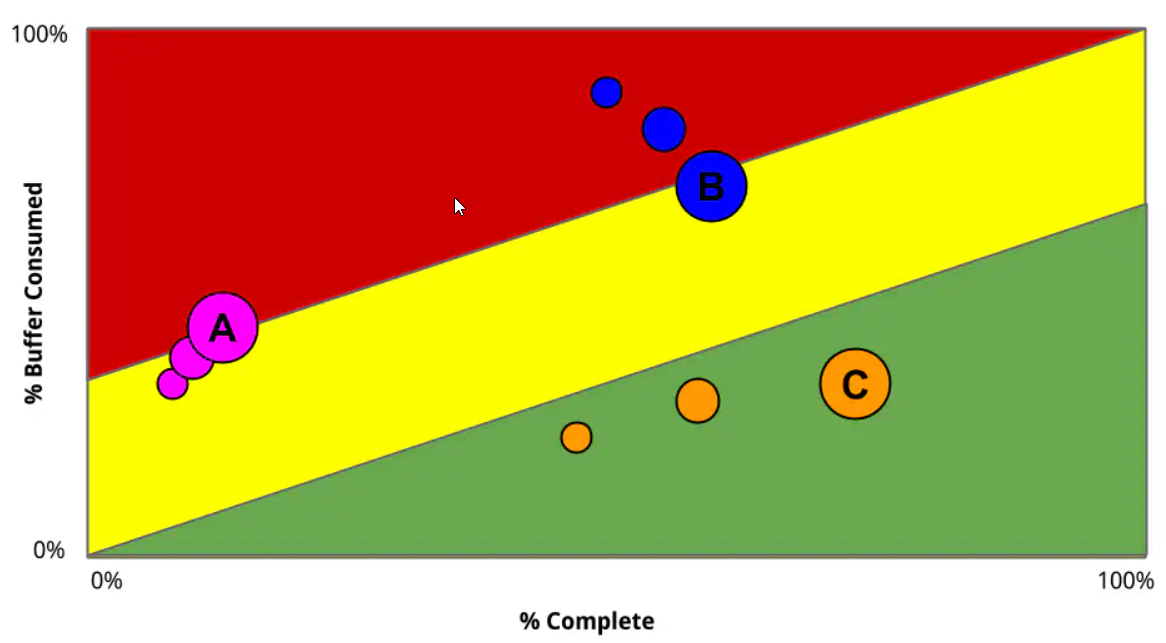
Fig 8 - Dynamic comparison of projects or subprojects proposed in Tameflow
A really clever representation as suggeted by Steve Tendon in Tameflow is using bubblechart (Fig 8). The bigest bubble is the most recent and getting smaller in the past. This gives a dynamic view of the trajectory or the project/task immediately suggesting where focus is needed.
This focus on residual risks helps teams act proactively to prevent timeline disruptions. Instead of chasing task completion metrics, buffer consumption reporting aligns everyone around protecting the critical chain and delivering the project on time. Visual tools, like buffer fever charts, make it easier to track progress and communicate risks across teams, fostering a sense of shared responsibility.
6. Practical Applications and Lessons for Semiconductor NPI
One practical example of CCPM’s success comes from Harris Semiconductor, which applied the Theory of Constraints (TOC) in a major expansion project at its Mountaintop, PA, semiconductor plant. Dubbed “Project Raptor,” the initiative transformed the plant into a profit center, contributing 20% of the corporation's profits within four years.
The project involved designing and constructing a new facility, installing equipment, hiring and training employees, and ramping up to a 90% production rate. While such a project typically takes 54 months, Project Raptor achieved completion in just 13 months, despite losing 40 days to severe weather delays. The team finished three days ahead of schedule and only 4% over budget—an overrun vastly outweighed by generating revenue 40 months earlier than the industry standard.
This case highlights the power of CCPM in managing complexity, mitigating delays, and achieving extraordinary results, providing valuable lessons for semiconductor NPI projects.
7. Conclusion
Critical Chain Project Management (CCPM) offers a powerful framework to tackle the complexities of semiconductor NPI projects. By focusing on constraints, managing variability through shared buffers, and fostering a collaborative mindset, CCPM ensures on-time delivery and risk mitigation. Practical tools like the Monte Carlo-based solutions bring these principles to life, enabling data-driven project planning and execution.
Ready to transform your NPI process? Visit my Buy Me a Coffee page to access the SeaTable templates and start embedding variability in your project reporting or search for more professional and structured tools that implement CCPM. Let’s make NPI faster, smarter, and more reliable together!
Enjoyed the content?
If you found this article useful, consider supporting my work with a coffee or exploring the downloadable examples available on my Buy Me a Coffee page. Your support helps keep the motivation high and fuels more hands-on content!

8. Bibliography
This article draws on key resources in project management and the Theory of Constraints (TOC) to provide a practical framework for applying Critical Chain Project Management (CCPM) to semiconductor NPI. Below are the main references used:
Critical Chain by Eliyahu M. Goldratt
A foundational book that introduces the principles of CCPM and its application in managing complex projects.The Rules of Flow by Efrat Goldratt-Ashlag
Explores TOC principles applied to project management, focusing on improving flow and delivering projects faster.Marris Consulting: CCPM Presentation at PMI Luxembourg
CCPM Conference Presentation (PDF)
A detailed exploration of CCPM applications in industrial projects, including real-world results.TameFlow by Steve Tendon
https://tameflow.com/
A complementary approach that combines TOC with Agile and Kanban, emphasizing flow and collaboration in managing knowledge work.Harmony Change Simulators by Goldratt Research Labs
Harmony Change Simulators
Tools for simulating and implementing CCPM and other TOC applications, providing hands-on insights into project flow and risk management.PMI: The Debate Over CCPM
The Debate Over CCPM
A comprehensive discussion of CCPM’s principles, its application, and insights from TOC expert Eliyahu Goldratt.