

Some time ago, I looked at the methods used to estimate how flow varies during a tidal cycle. But what about figuring out the maximum flow on a particular day - maybe one somewhere between neaps and springs?
Many readers of this blog will be familiar with the calculations required - if not, maybe take a look at my navigation book. As a reminder, there's two approaches often used:
If we only know the spring flow speed, we can multiply this by the tidal range today divided by the mean spring range to estimate today's maximum flow (see notes)
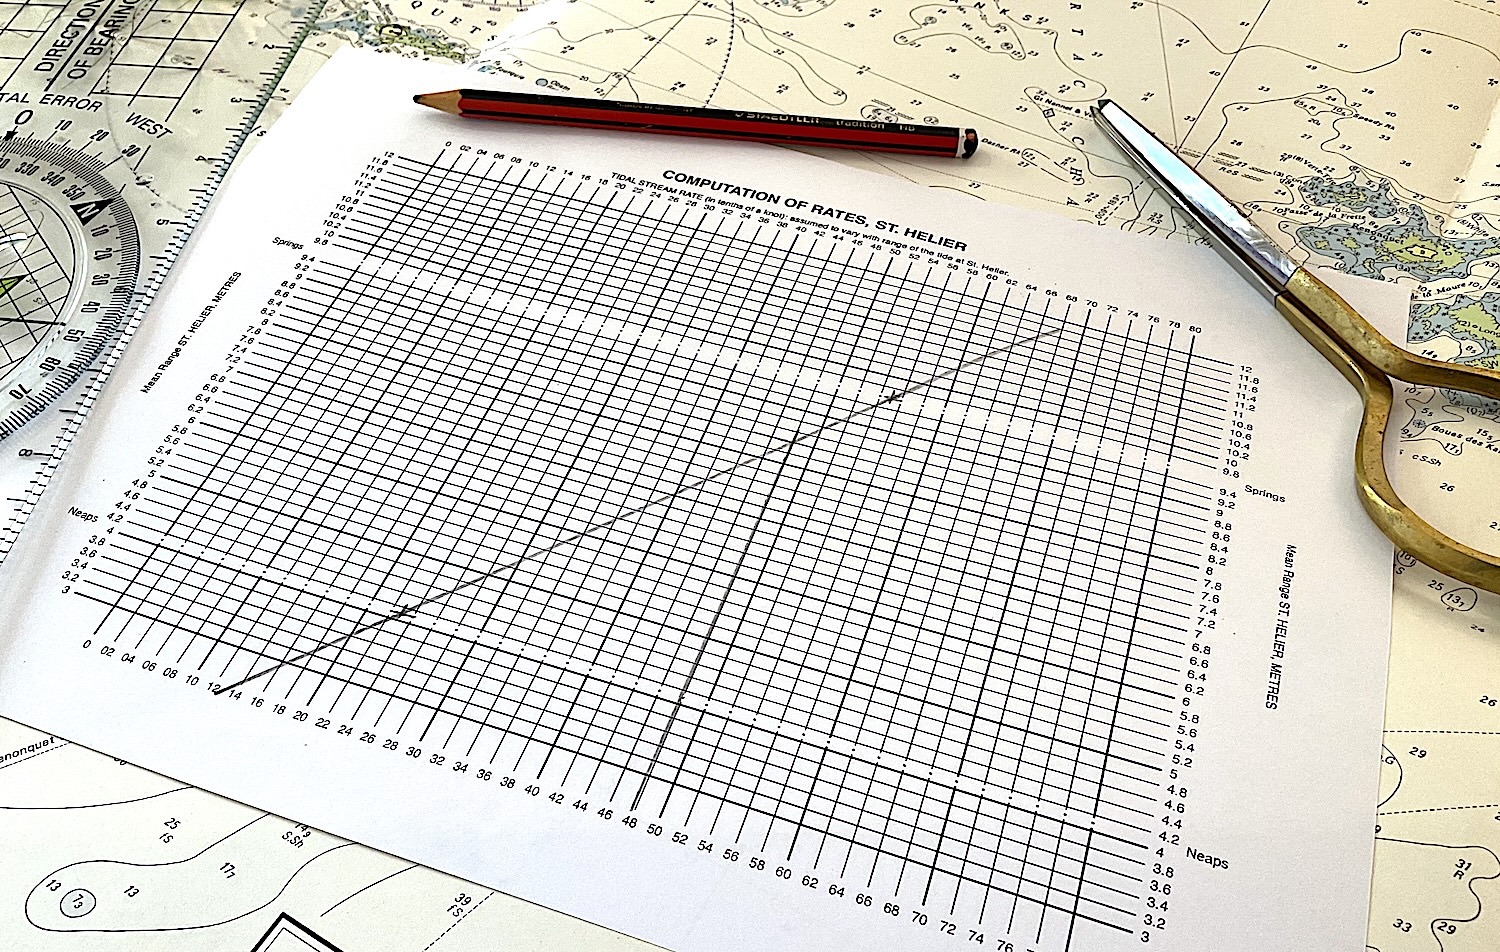
If we know both springs and neap flow speeds (e.g. from a tidal diamond or flow atlas), we can use graphical (or numerical) interpolation (see notes)
 Some data
So, are these methods any good?
To check that, we'd need flow data for some locations across multiple days - ideally through a few spring-neap cycles. Fortunately, modern current meters (ADCP) can provide that sort of information. In what follows, we'll use data from a few locations around Anglesey:
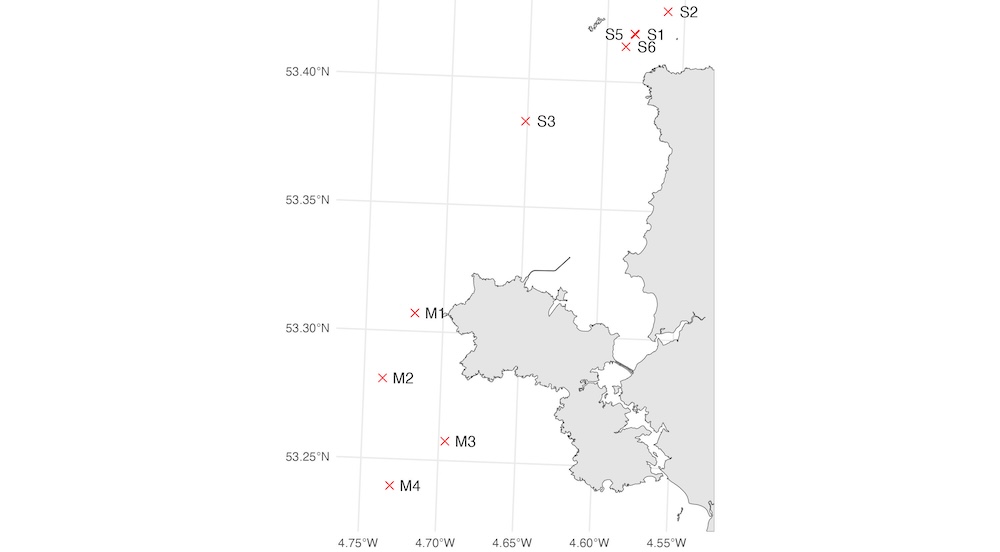 Obviously, it'd be better to use information from more diverse locations, but this is what I had to hand. In case it's not clear - S5 and S1 are located very close to each other.
So what do these data look like? In the plot below max flow speeds (vertical axis) in each direction (denoted by +/-) are plotted against the Holyhead tidal range (horizontal axis) for each of the locations shown on the map. Red lines show what we'd get from springs/neaps interpolation, the blue lines represent the estimate we might make if we only knew the springs flow:
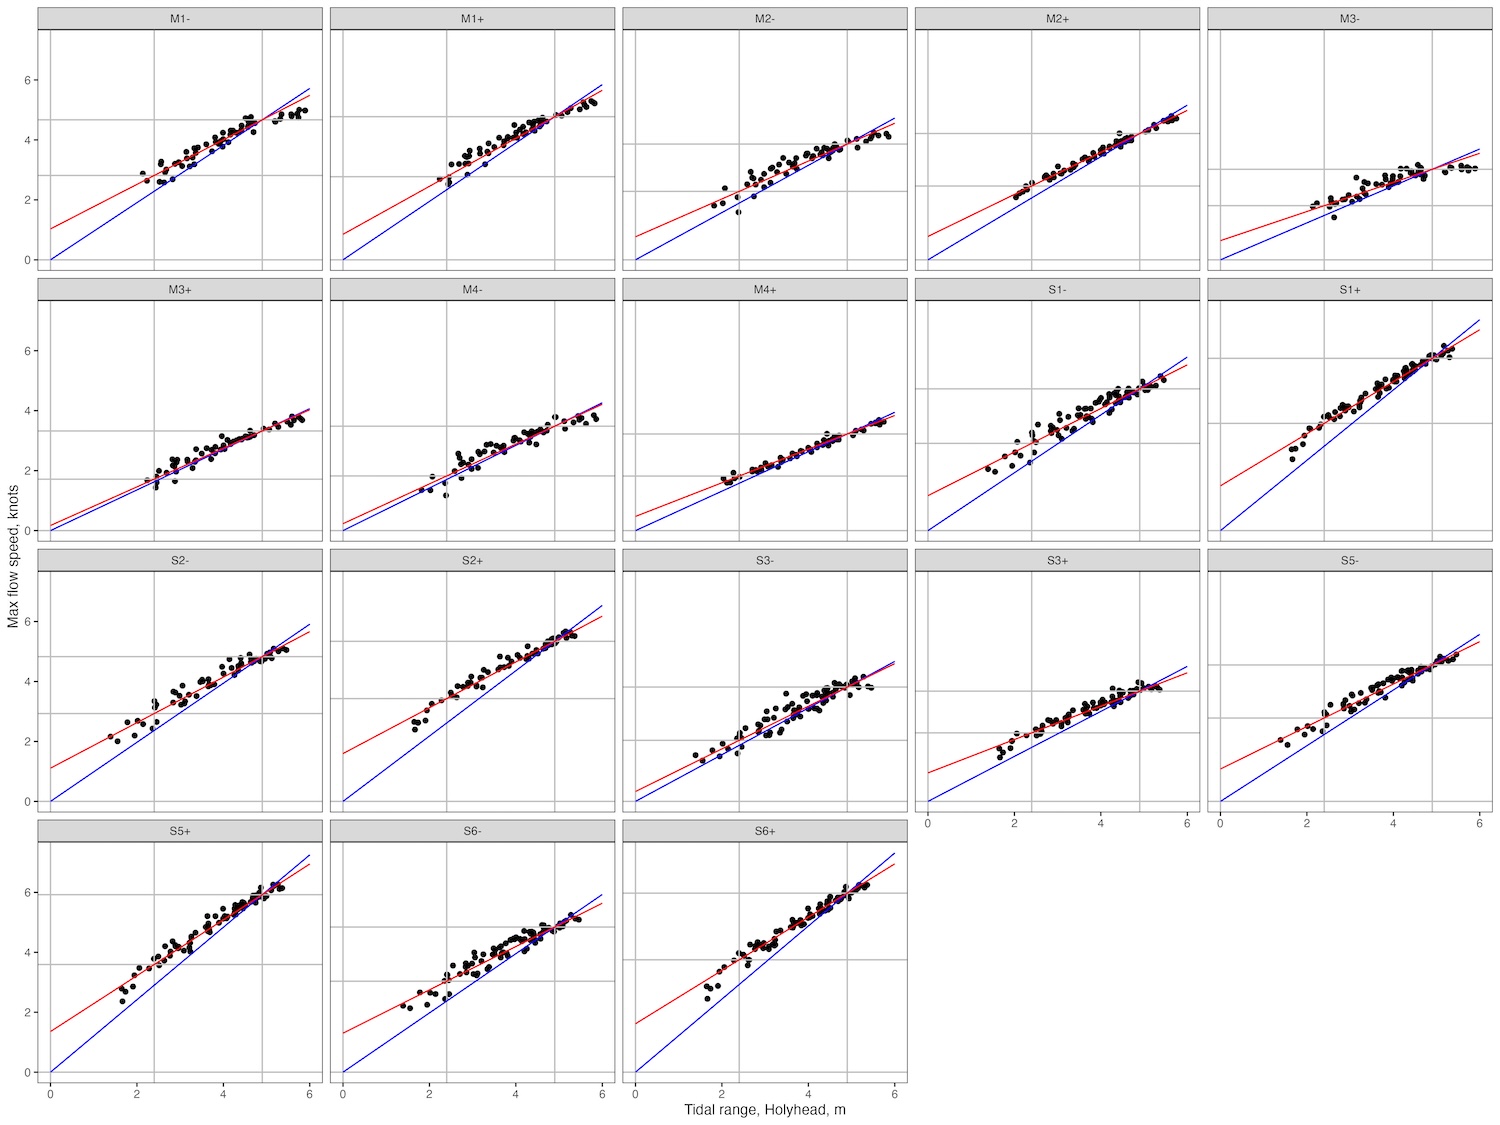 Overall, the results look pretty good - the red lines especially seem to track through the data. There's clearly a few discrepancies, which are worth a closer look.
Simple 'springs only' interpolation
The simplest method, as noted above, requires only that we know the flow speed at springs. We then scale this flow speed relative to the tidal range, to get the blue lines on the plots above.
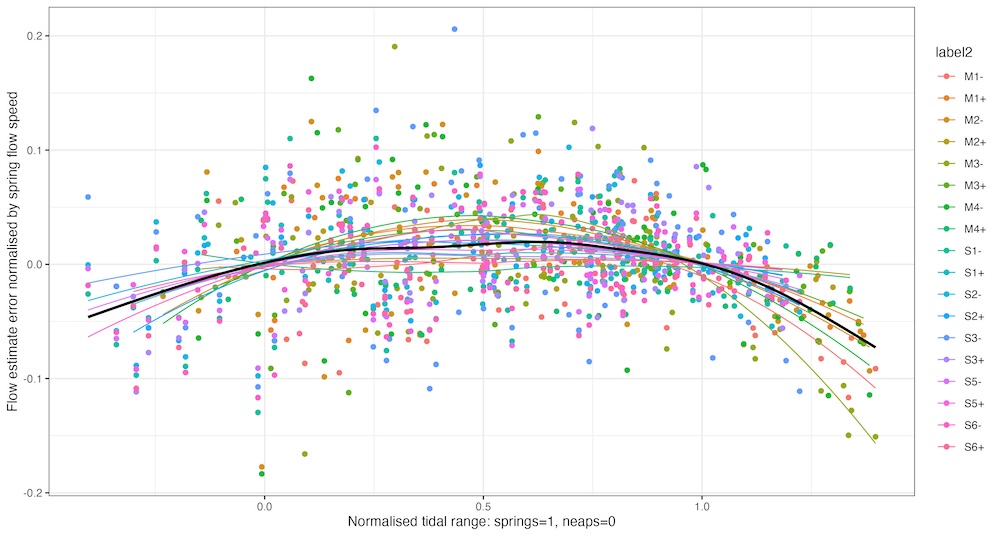
Let's look at the errors that this approach leaves us with. On the plot below, I've taken the data from all the locations, and scaled them by maximum flow at springs. I've put smoothed lines through the data for each location, and added a smoothed black line as a fit to all the data:
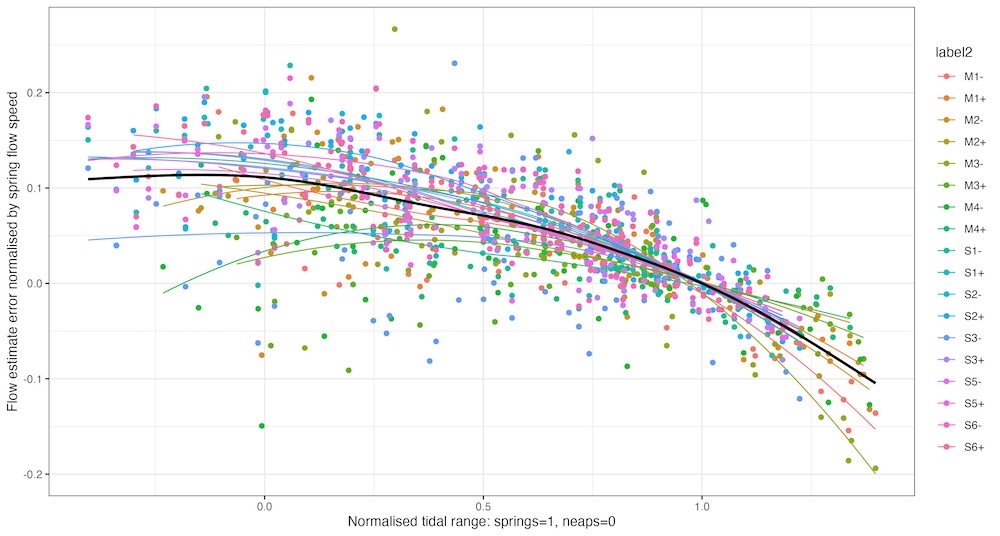 I've also scaled the tidal range so that springs is at 1 on the horizontal axis and neaps is at 0. As we expect, the errors are all close to zero at springs. But around neaps, this approach underestimates the flow speed by ~10% of the spring flow on average, and up to ~15% at some locations. And the method overestimates flow speeds on a big spring tide by ~10% on average, up to 20% in some cases.
Spring-neaps interpolation
Can we do better if we know the neap flow speed too and interpolate? Here's a similar plot for this method:
 On the whole, the errors are now smaller - less than ~4% between neaps and springs, and remaining similar for very small tides. This approach does still over-estimate speeds on big springs by ~7% typically and up to 15% in some cases.
Is there a solution?
Might other approaches give better results than the simple techniques, long used by kayakers and yachtsmen? A French paper from 2022 asked this question, looking at flows in the Fromveur Strait and Alderney Race calculated using computer models. One of their methods, an exponential fit, can be used if you know spring and neap flows. It does provide slightly better results, but doing the calculations requires iterative solution of a transcendental equation - which is probably a bit much to include in your trip planning process.
Somewhat more sensible than the exponential fit is using a power law. This works a bit better than linear interpolation, but it's not a spectacular improvement.
Of course, neither the exponential or the power law fit can be done if you just know the springs flow speed. Unless, of course, you know the form of the fit in advance. It turns out that in these data sets, many of the powers in the power law fits clustered around 0.68 - which is interesting, but it's unclear whether that would be generally true, given the small area that all the data was taken from. It'd be interesting to know, because it's pretty easy to use this approach - if you're using the tidal factor method, you just need to raise the factor to the power of 0.68 before using it:
In the example given in the notes, the factor is 0.65, and the springs flow speed is 1.7 knots, so we calculate the speed as 0.65 x 1.7 knots = 1.11 knots. If we want to use the power law method, we'd calculate it as 0.65^0.68 x 1.7 = 0.75 x 1.7 = 1.27 knots.
Is there a problem?
Actually, the main thing to take from all this is that the methods we're using aren't too bad. Even the simple method with spring flow only is accurate to 10-15%, which is less than half a knot for most tidal streams. And for most non-exceptional tides, the full interpolation method gets us within 5% - which gets us within half a knot even for a tidal stream that attains 8 knots at springs.