
This week I am presenting my weekly market report to you not as a PDF but on this website. Nothing much has changed, you just have to scroll the screen instead of turning the page. The reason for this is that I have not yet fully set up my computer during my move abroad, and this place is also comfortable for me. Since the intention of my valuable followers is to get information from me, you probably won't find this strange. Apart from that, if you like my weekly reports and want to interact with me more during the week, you can also access my posts during the week by ordering a coffee to support me. Now let's move on to the analysis.
First of all, there was a lot of movement in the markets this week. Some investors cried and some laughed. I am starting my analysis again with the intention of relieving the crying of those who cried and making those who laughed laugh more.
GOLD
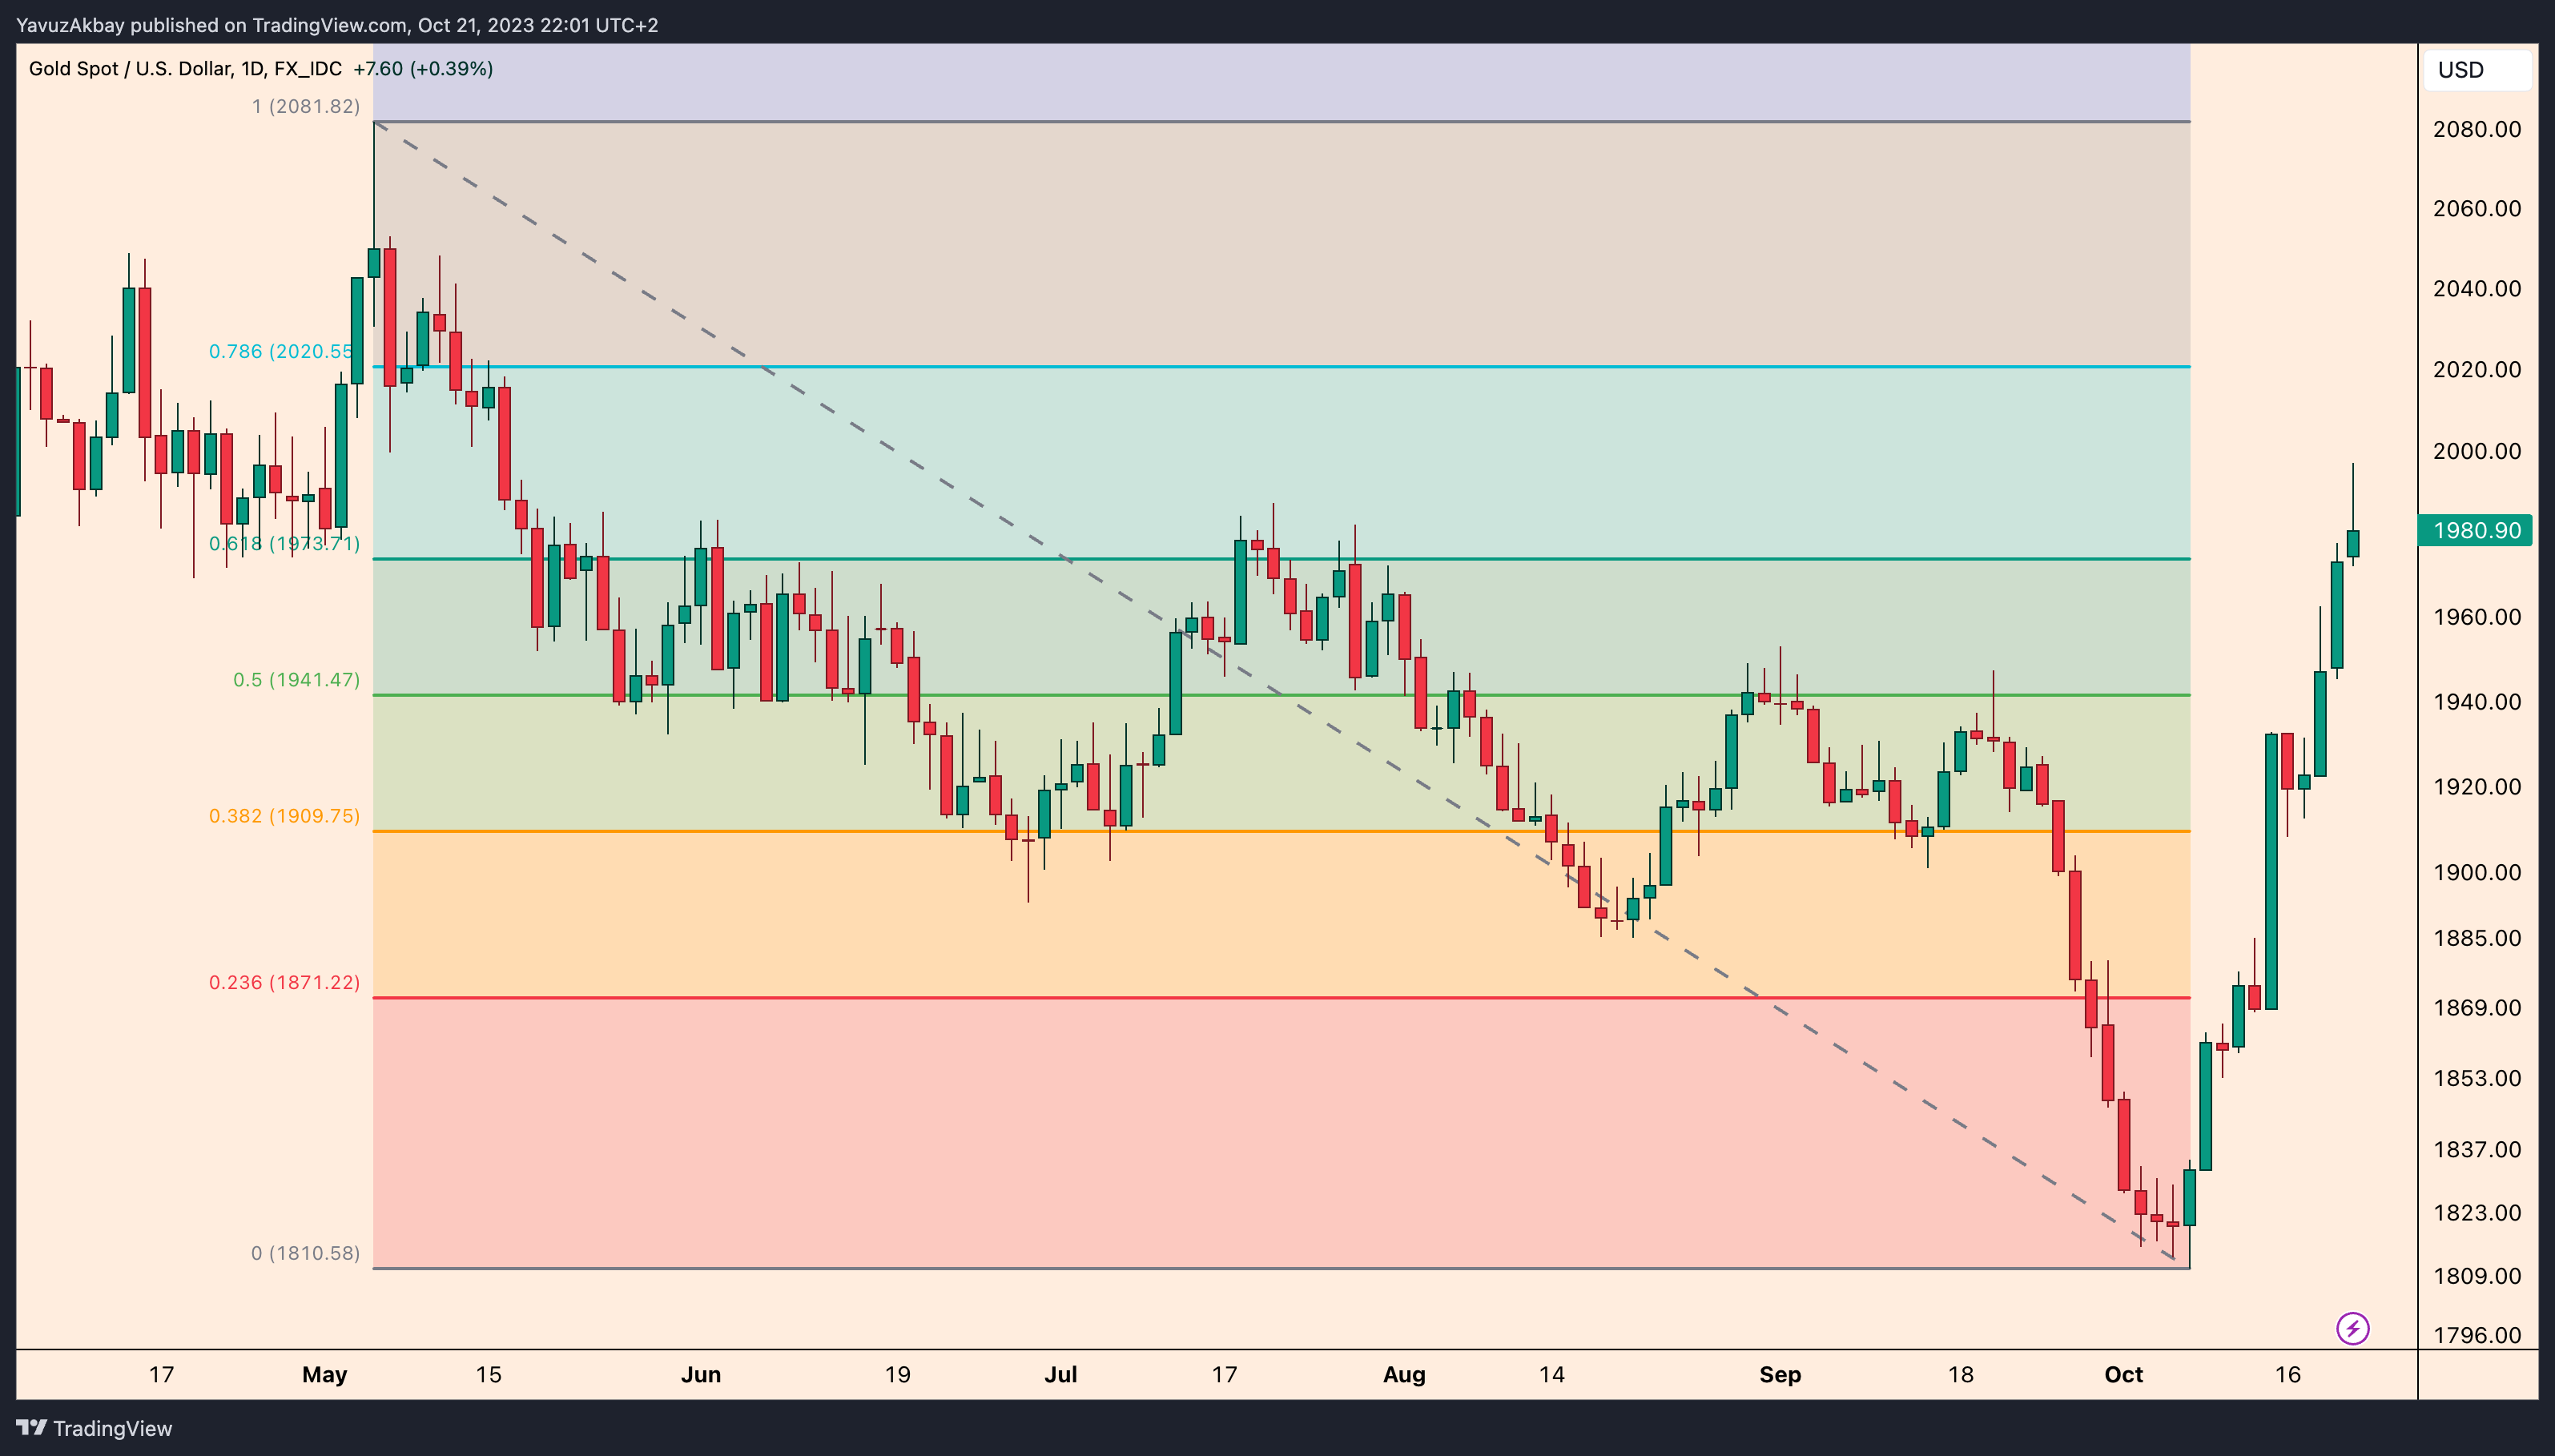
First of all, there was a big bounce in gold this week. In the past weeks, I said that the $1810 level was the bottom and that it should find support. Again, what I said came true and gold returned from this level. The strange thing is that I did not expect such a sharp turnaround. Of course, I had target prices respectively, but even I did not think that it would happen so fast. As a result, gold rose 10.30% in just 10 days. On this page, I tried to catch up with the run by making various analyzes about gold between the weeks, but without even giving me time to catch up, gold managed to make its investors and me laugh. As you know, ever since I wrote these reports, I have always argued that gold and Bitcoin are real currencies and I always keep them in my pocket instead of cash. So this rise made me laugh too.
Although $1980 is a solid resistance, gold closed the week above it. I think this rise is a rise in accordance with the fibonacci retracement. Therefore, $1980 is a support point for me. In the continuation of the rise, the $2020 level will act as resistance, but in a possible closing below $1980, gold may see the $1940 level again.
PALLADIUM
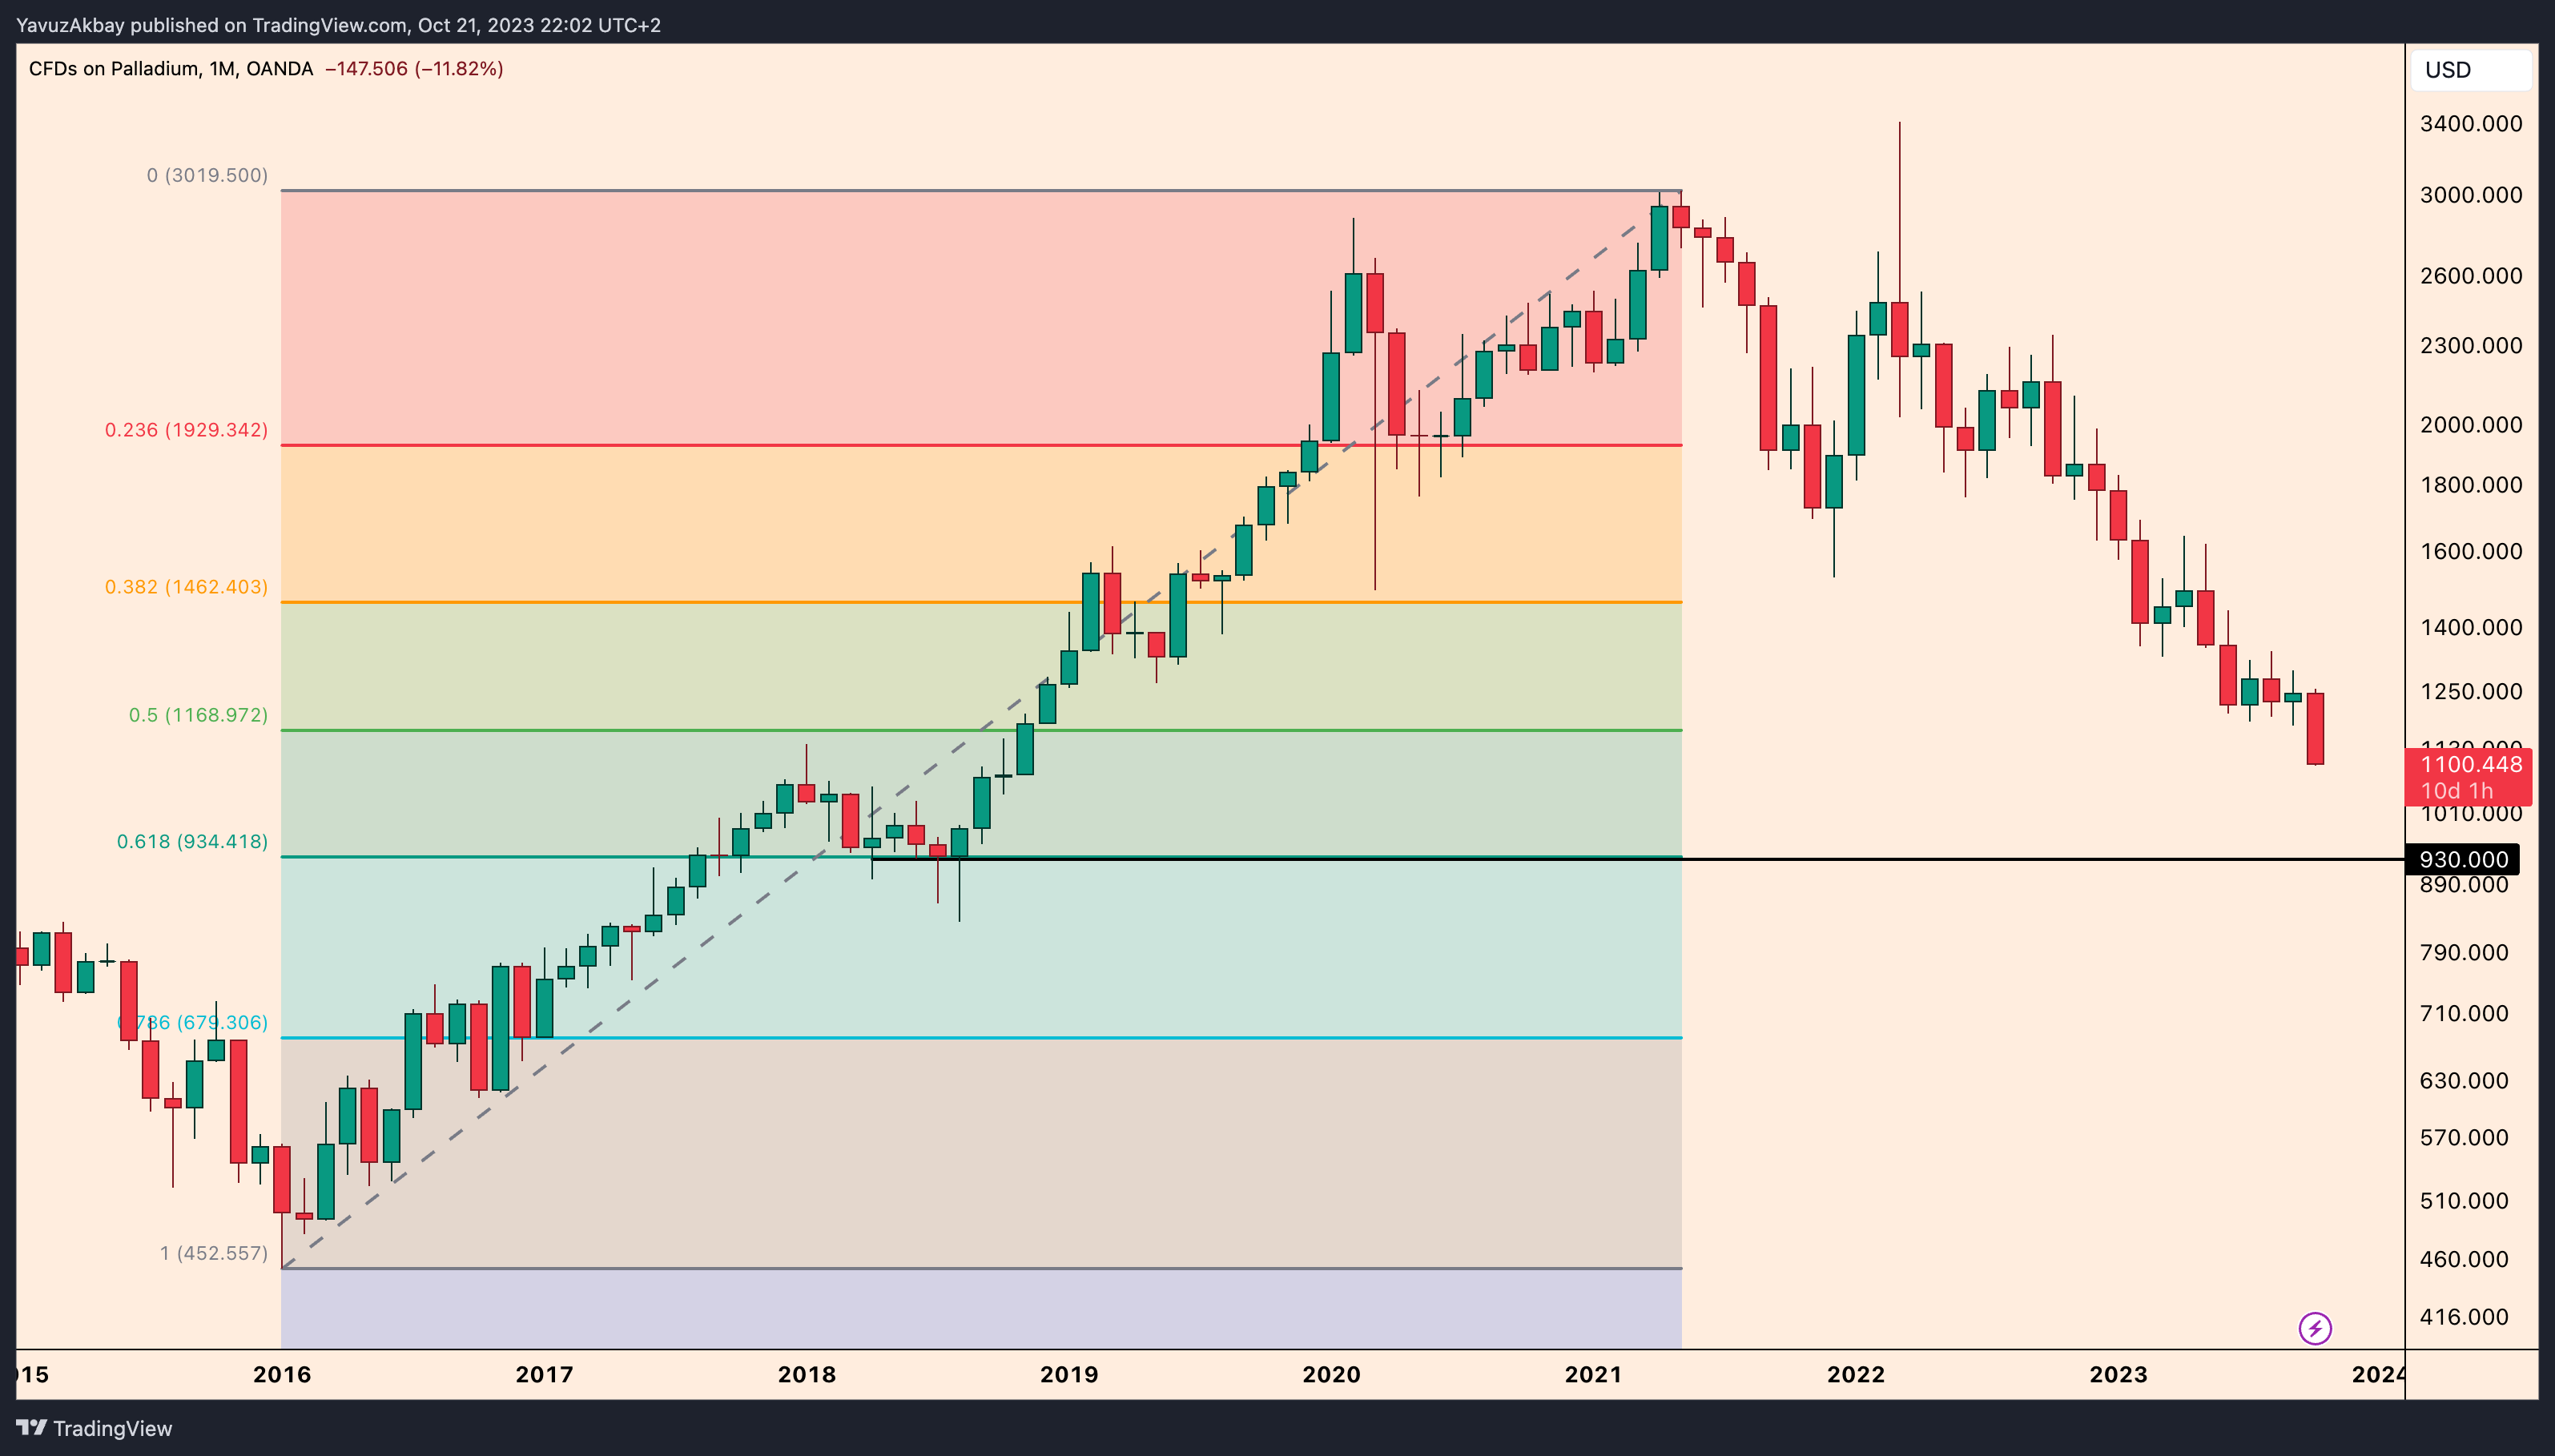
Palladium has been in decline since it was rejected at $3000 in May 2021. Every time it tries to raise its head, it is rejected from the downtrend, deepening the depreciation. My last support point for palladium was at $1210. This support was broken this week and palladium now seems to be retreating all the way down to $930 and back to its 2018 price. I think that palladium will find support from these areas and start its upward movement again. Especially considering that the relative strength index is currently at 32.83, palladium is in oversold territory. Palladium has never been sold this much since almost 2003. Therefore, every time the RSI goes down to these levels, we see an upward movement in palladium. I think this upward movement will be seen especially in the $930s. Therefore, these levels are a buying opportunity for me. After buying, the target will be the 30-month moving average. Currently, the 30-month moving average is at $1656, but when palladium returns from the bottom, it will probably be at $1500. Therefore, I have a profit expectation of 61.53% in palladium.
COTTON
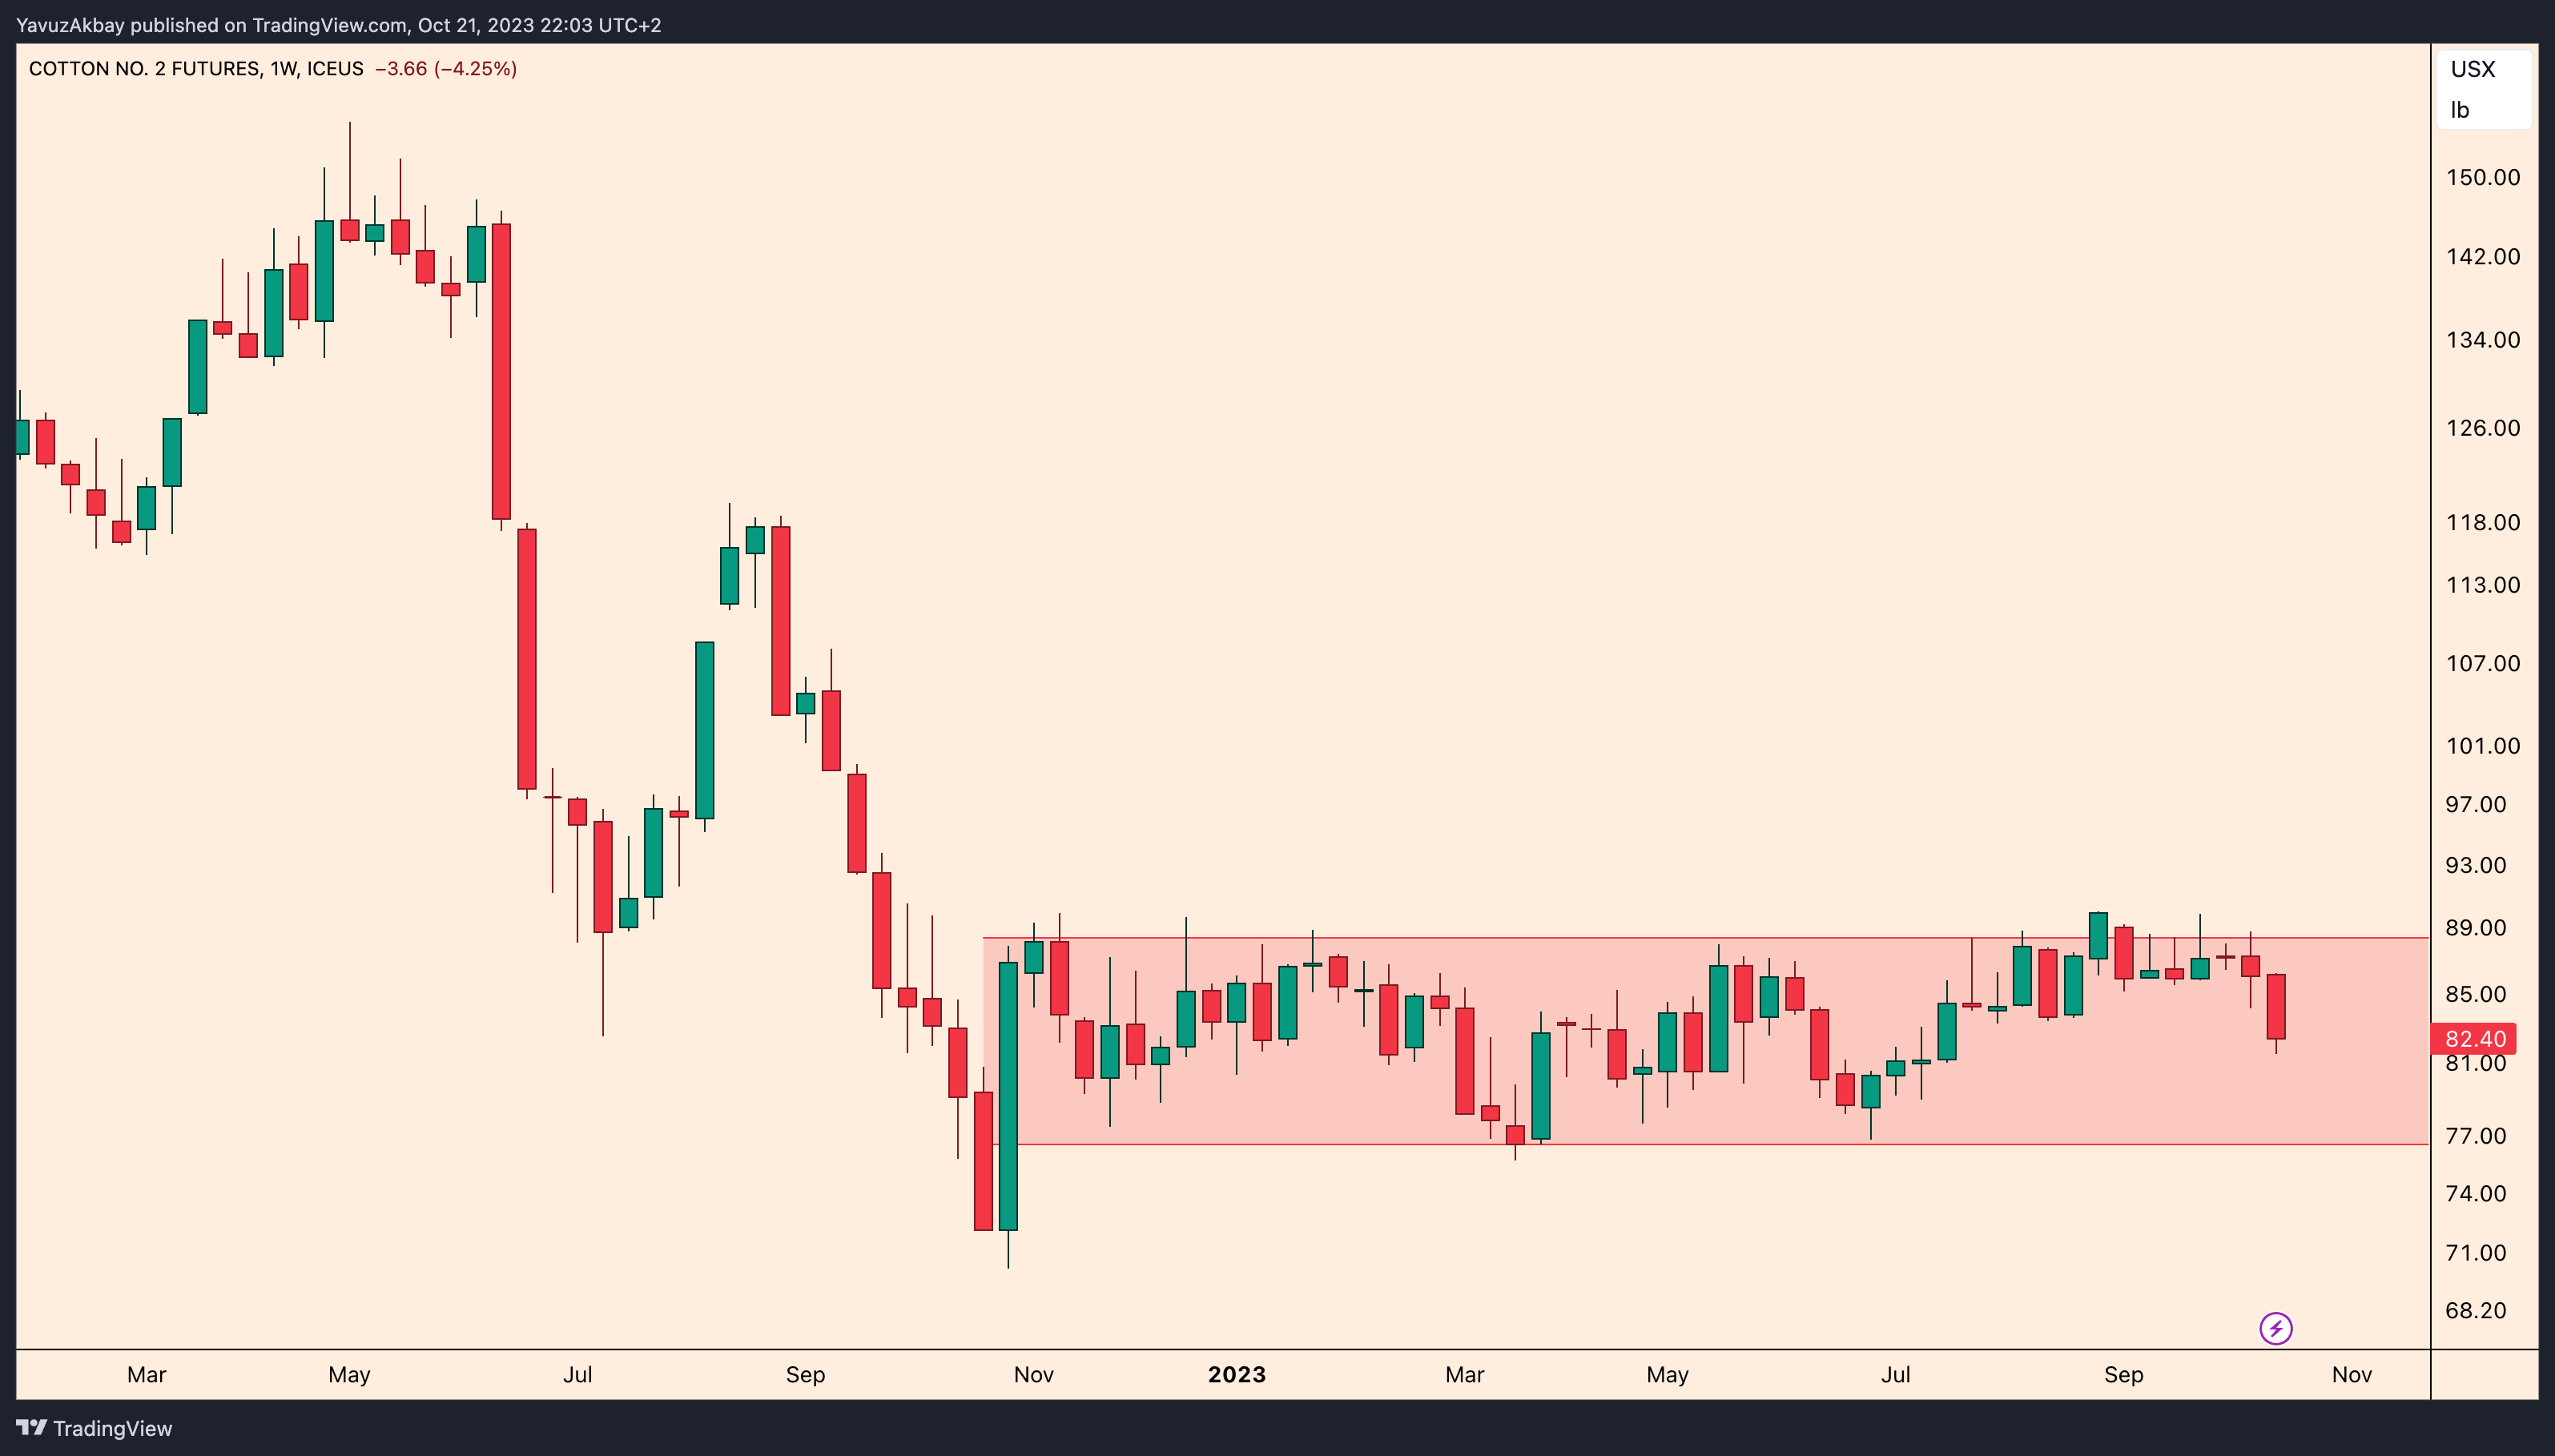
I did a cotton analysis weeks ago, but not much has changed since then. The side channel in cotton continues to function. Cotton, which has been oscillating between $89 and $77, was rejected at the $89 level just this week and continues its decline towards $77, the support of the channel. I think the run in cotton will start only when $89 is broken. When this level is broken, I will be sharing the target and updates on this page.
COFFEE
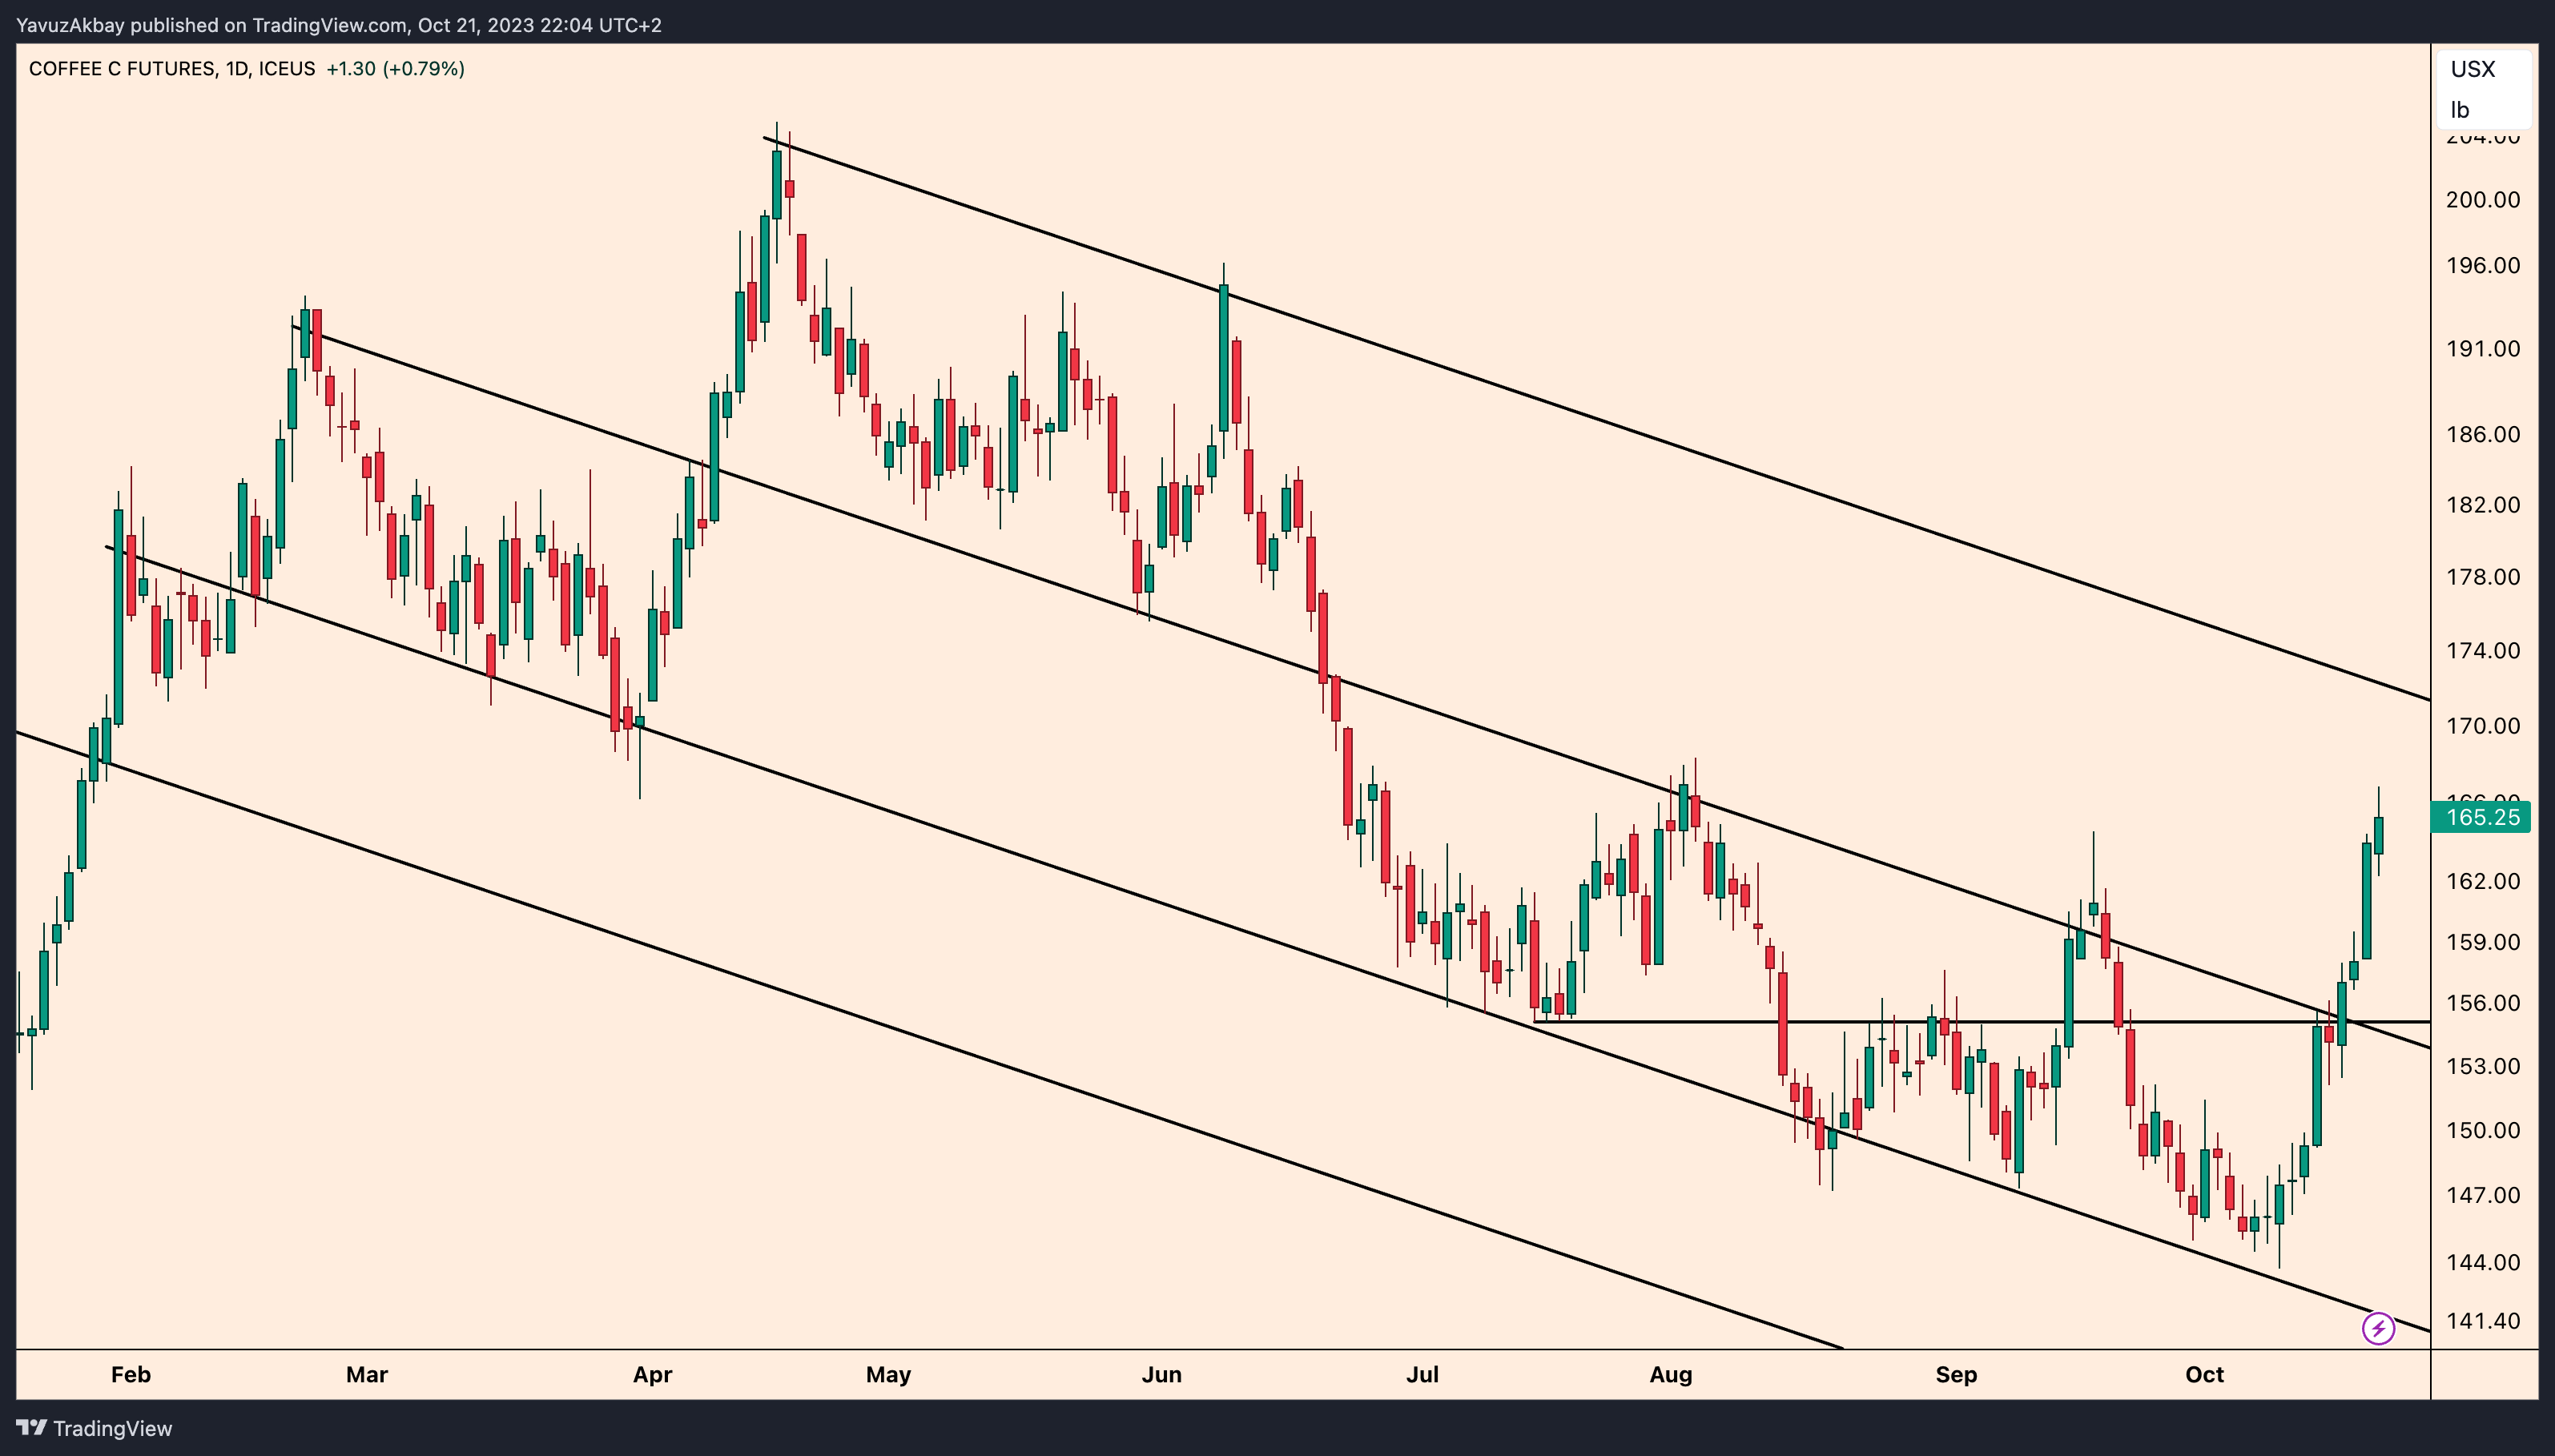
In coffee, I said that it continued its downtrend in the last weekly reports and gave a buy signal at $145. In this buy signal, I stated that the target was $155 resistance. The target came and 6.50% profit was pocketed. But after that, coffee will continue its run, rising almost up to $166. I think this rise will continue at least until $170. Therefore, I think that those who have not sold yet should take profits at these levels. I do not think that new purchases should be made, but since the $170 level is also a downtrend, the run may harden with the break of this trend, so it is entirely up to the investor's initiative whether to buy or not after this level.
BITCOIN
Just a few days ago, I told my followers who bought me coffee here that if Bitcoin stayed above the WMA30 in the 4-hour timeframe, it would go up to the upside. So, this came true, and Bitcoin went even higher. Since I usually do my short timeframe posts during the week, in this article I will look at Bitcoin over a wider timeframe.
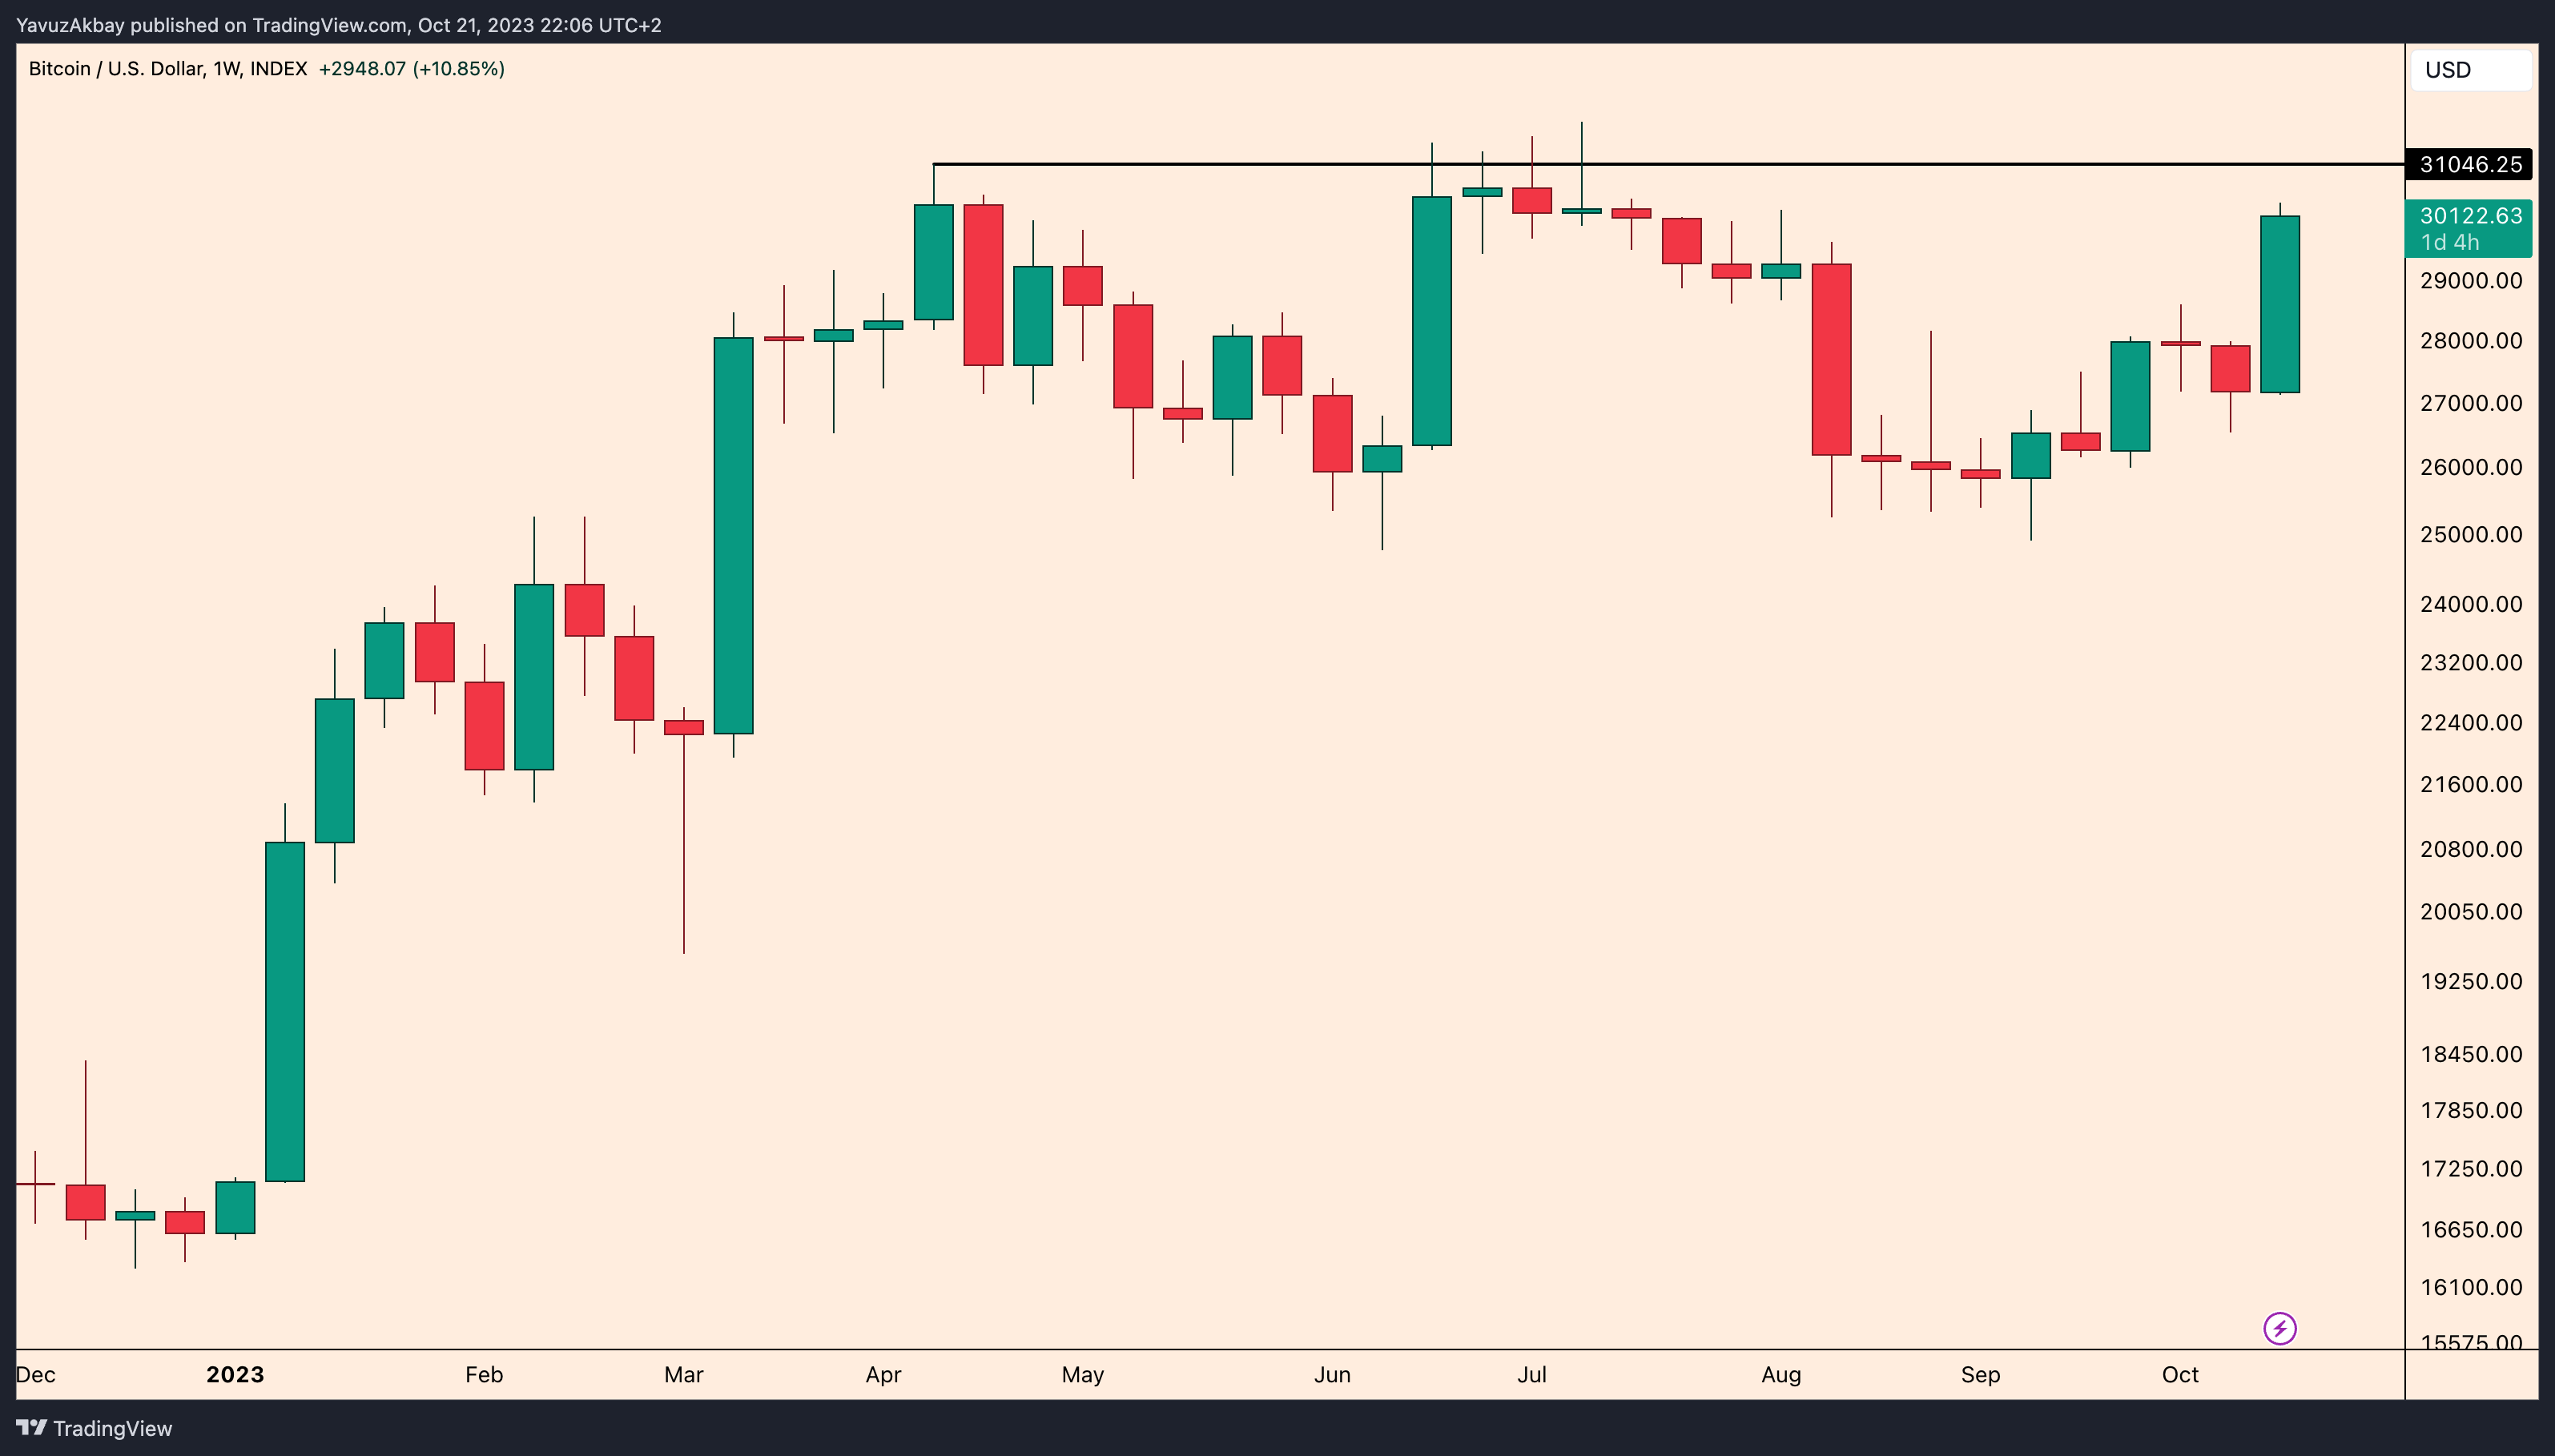
In the weekly timeframe, it is possible for Bitcoin to run up to $31000 in particular. There seems to be no obstacle in front of it. But here the following problem arises. At $31000 there are still large sell orders on most exchanges and most traders want to take profits at this level. Therefore, a rejection from this level is possible. But at the same time, since it has been rejected twice from this level, there is a possibility that Bitcoin will break this level this time. So, what kind of strategy will I follow here?
If there is a rejection from this level, a pullback to the 30-week moving average level of $27900 is possible. Therefore, I will leave my short-term assets at $30000 and wait for $27900. If there is a reversal from this level, I will buy at this level and wait for the $31000 level to break. But if there is no return and the moving average support is broken, $25500 will be the working support of the Shoulder-Head-Shoulder pattern for me. I think the weekly close below this level will bring us to the $22000 level. I wait for $31000 again by lowering the average at the supports.
But if $31000 is broken, $38000 is the target for me. After reaching this target, it will return back to the $31000 level and after this return, the $31000 level will be a solid support.
Therefore, I don't think anyone should be afraid after breaking above $31000. Bitcoin below $31000 is cheap Bitcoin for long-term holders.
POLYGON
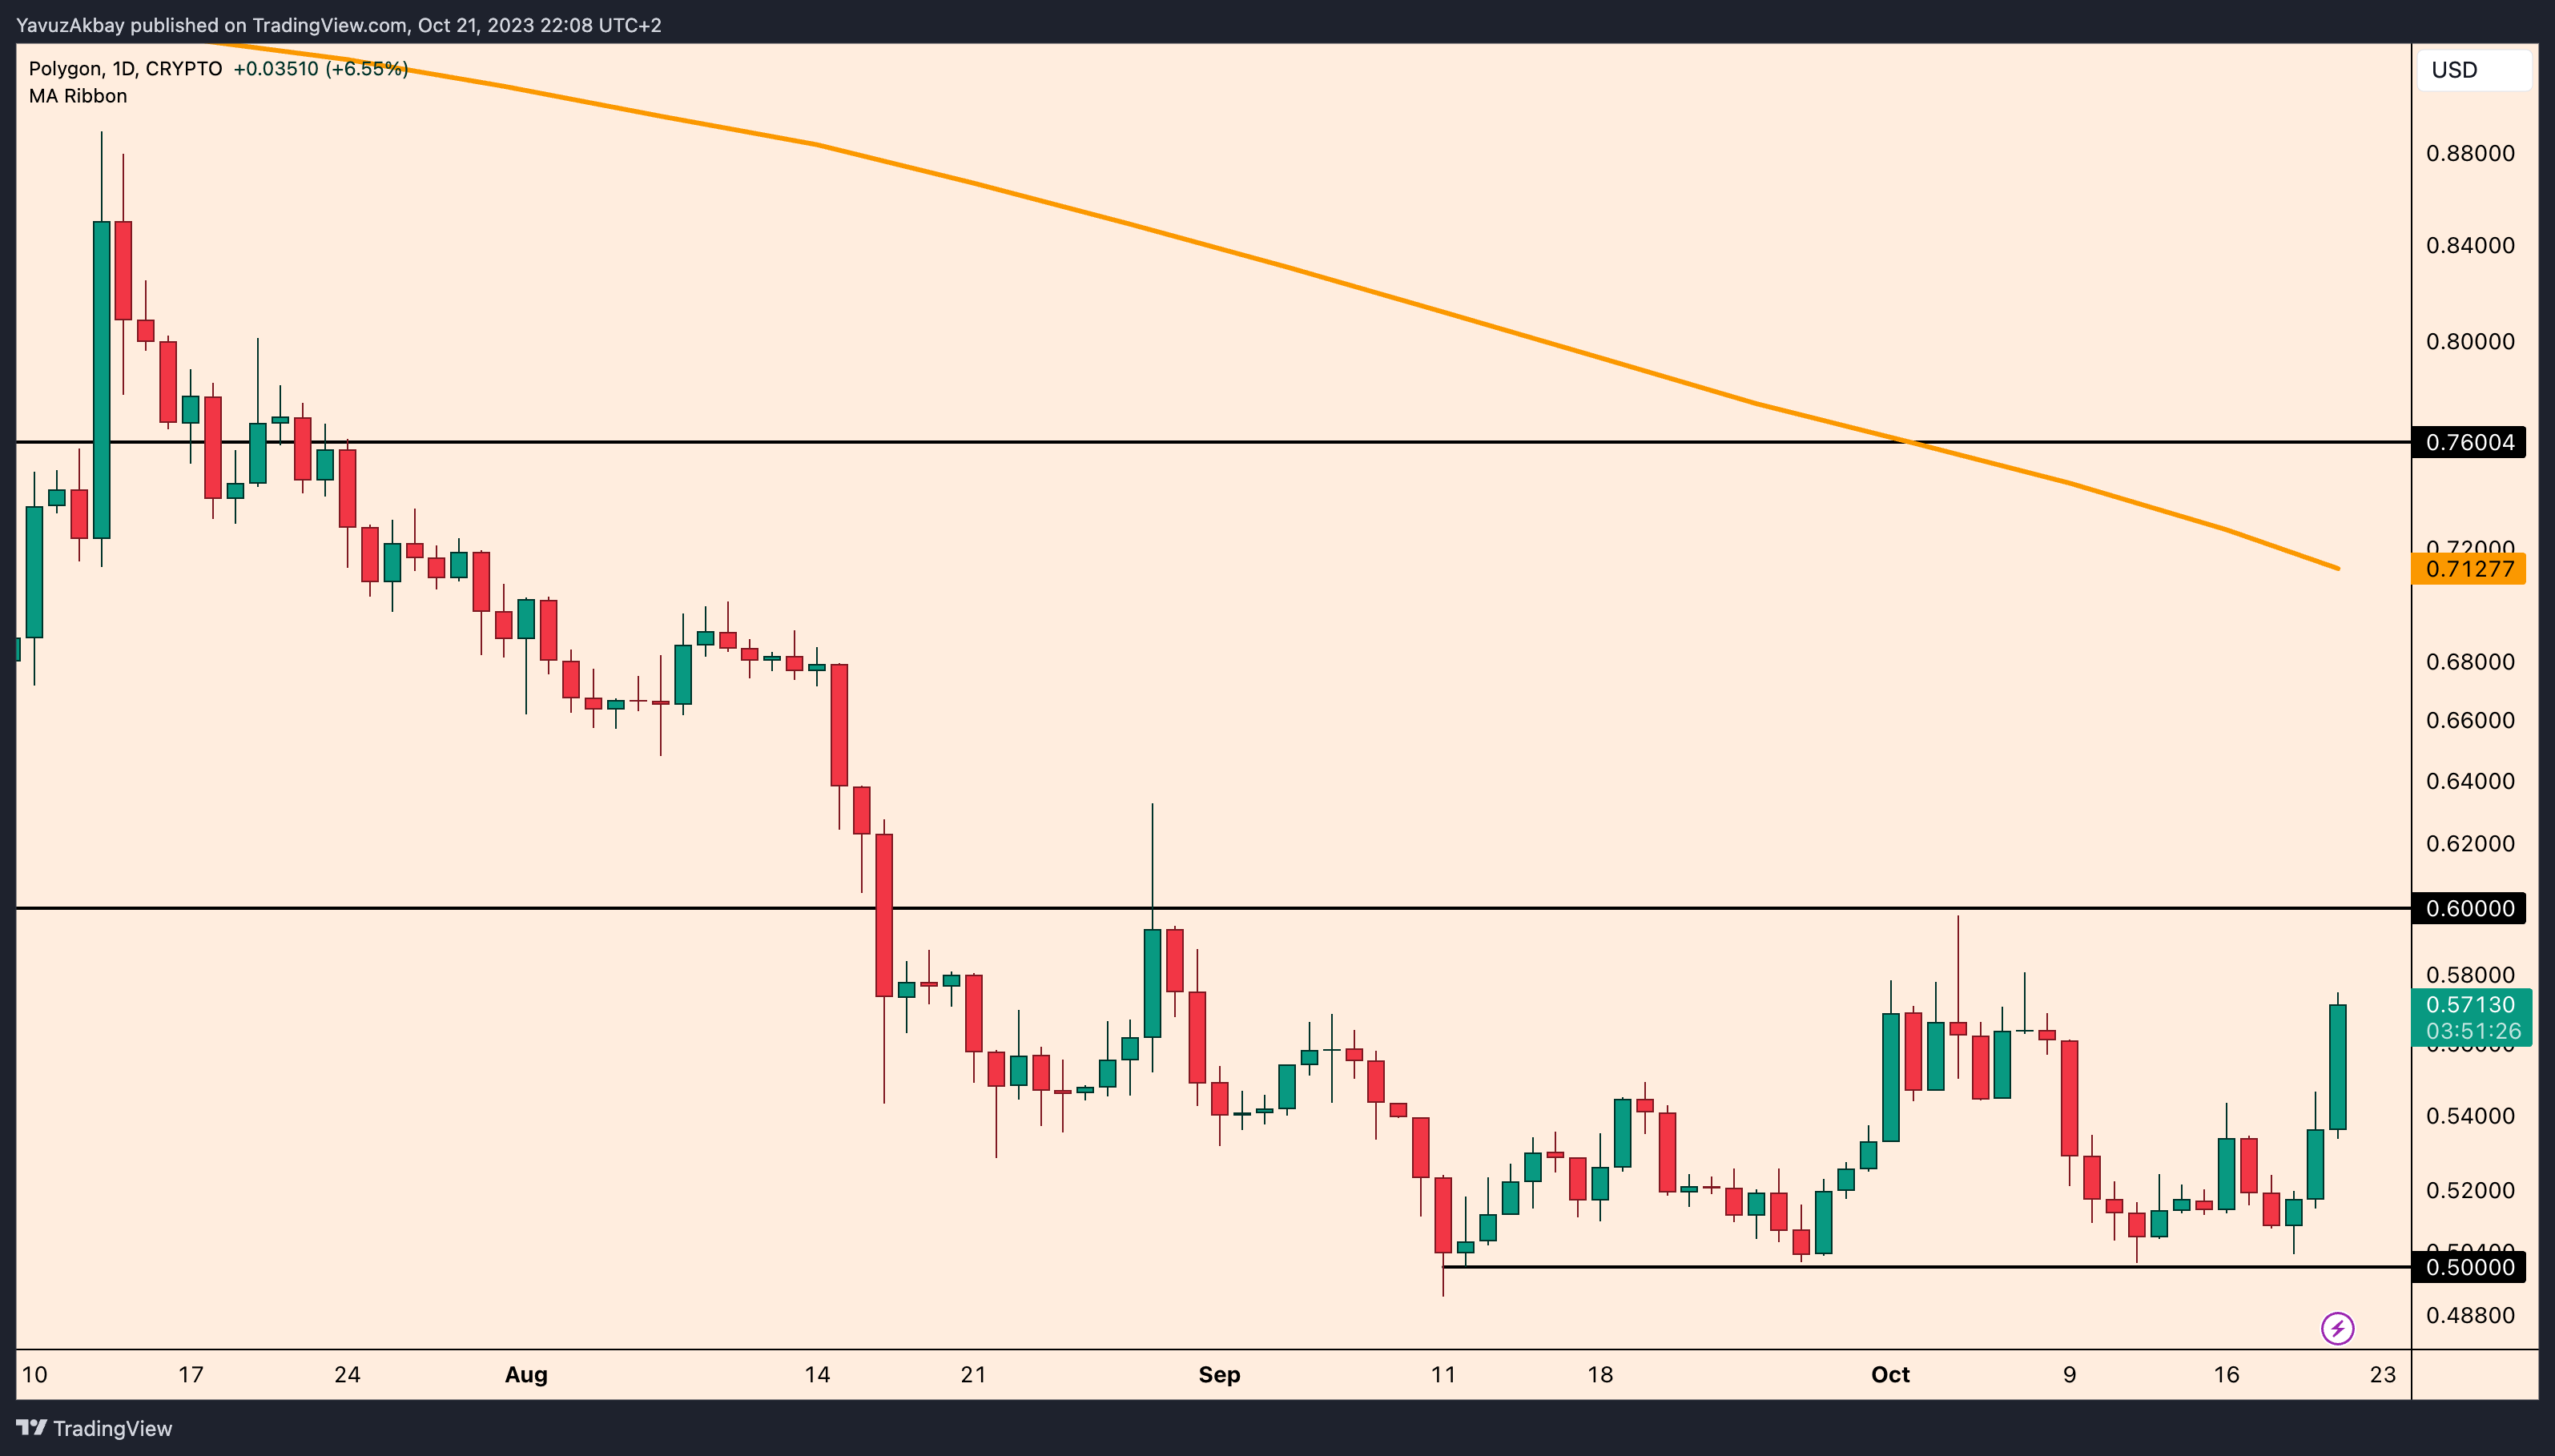
With the rejection of Matic around $0.50 this week, I think a double bottom formation has formed on the weekly timeframe. The decisive level here will be especially $0.60. A break of $0.60 will bring the 40-week moving average of $0.71. Therefore, I think Matic is among the exceptionally cheap cryptocurrencies.
In a possible drop below $0.50, I think Matic should hold at $0.40. If $0.40 comes, I will add to my Matic wallet. Other than that, I currently only have what I added at $0.50.
SOLANA
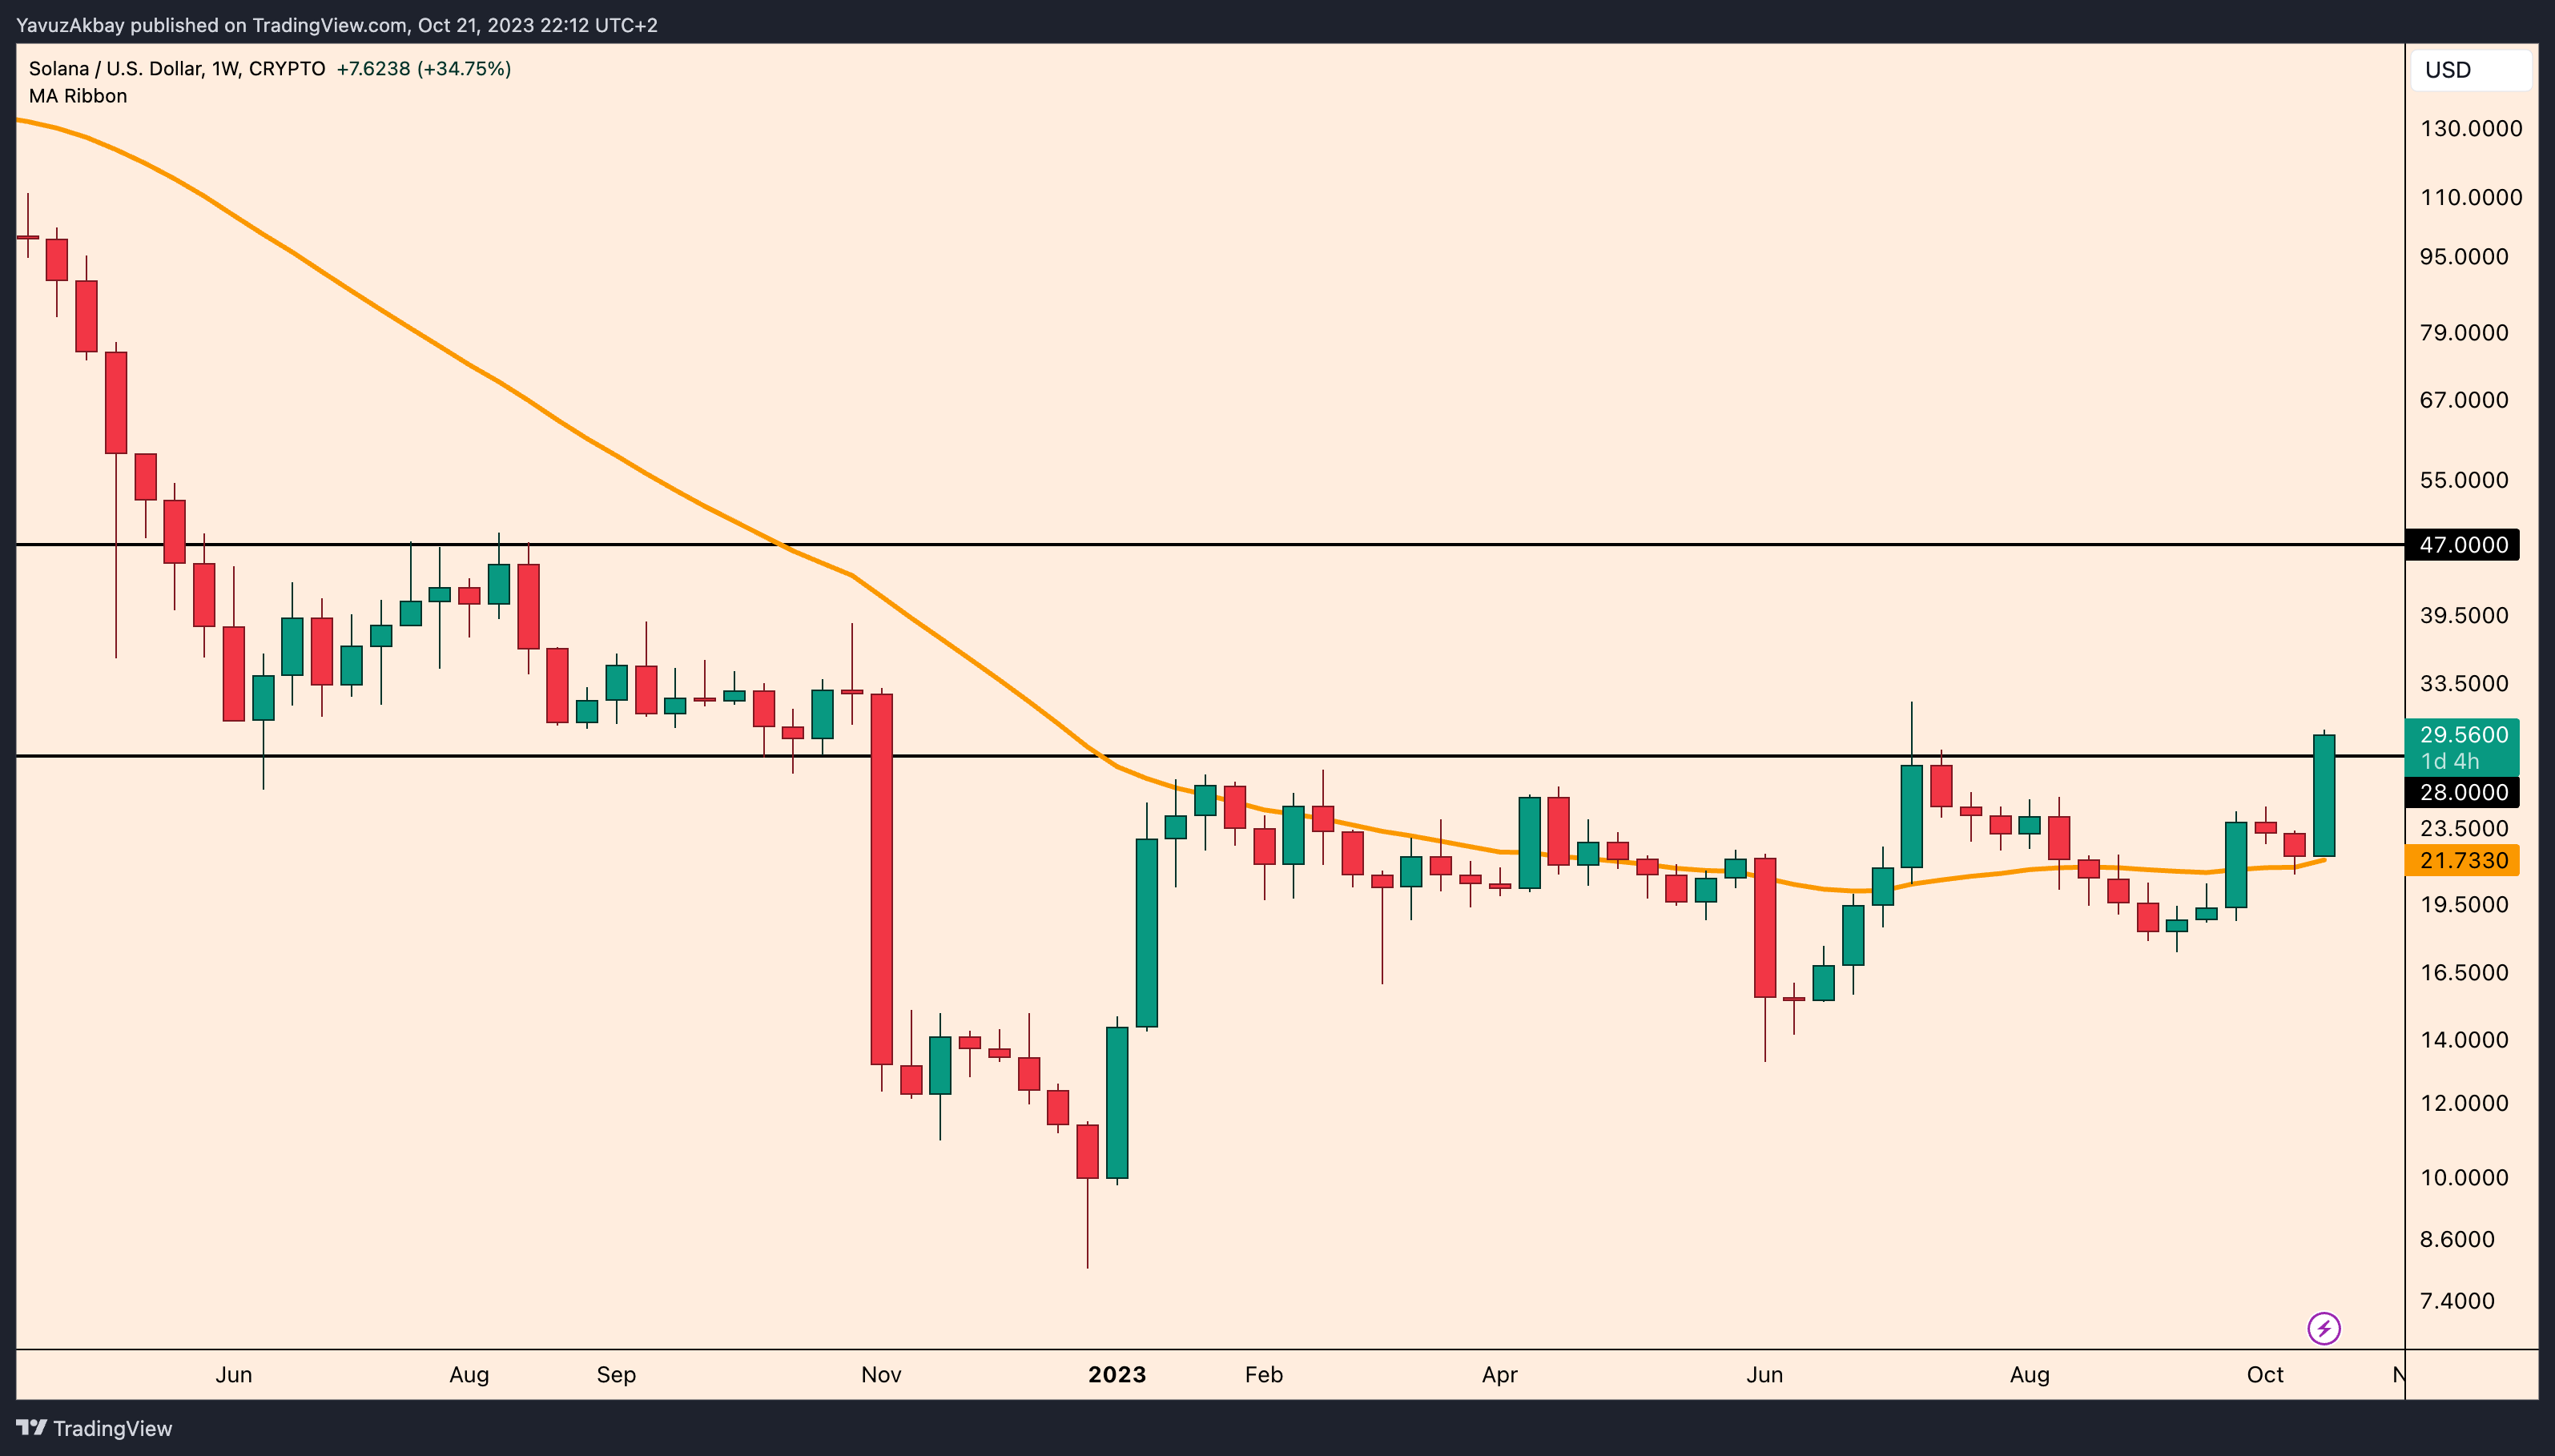
As long as Solana stays above the 40-week moving average, the bullish sentiment will continue. This week, it ran from the moving average to the $30 level and if it closes this week above the resistance, I think it will start a much more bullish run. The target will be $47 at the weekly close above the $28 resistance. However, the level we will follow on the return from resistance is the 40-week moving average of $21.50. As long as this level is not broken, I do not see a problem in Solana.
USDTRY
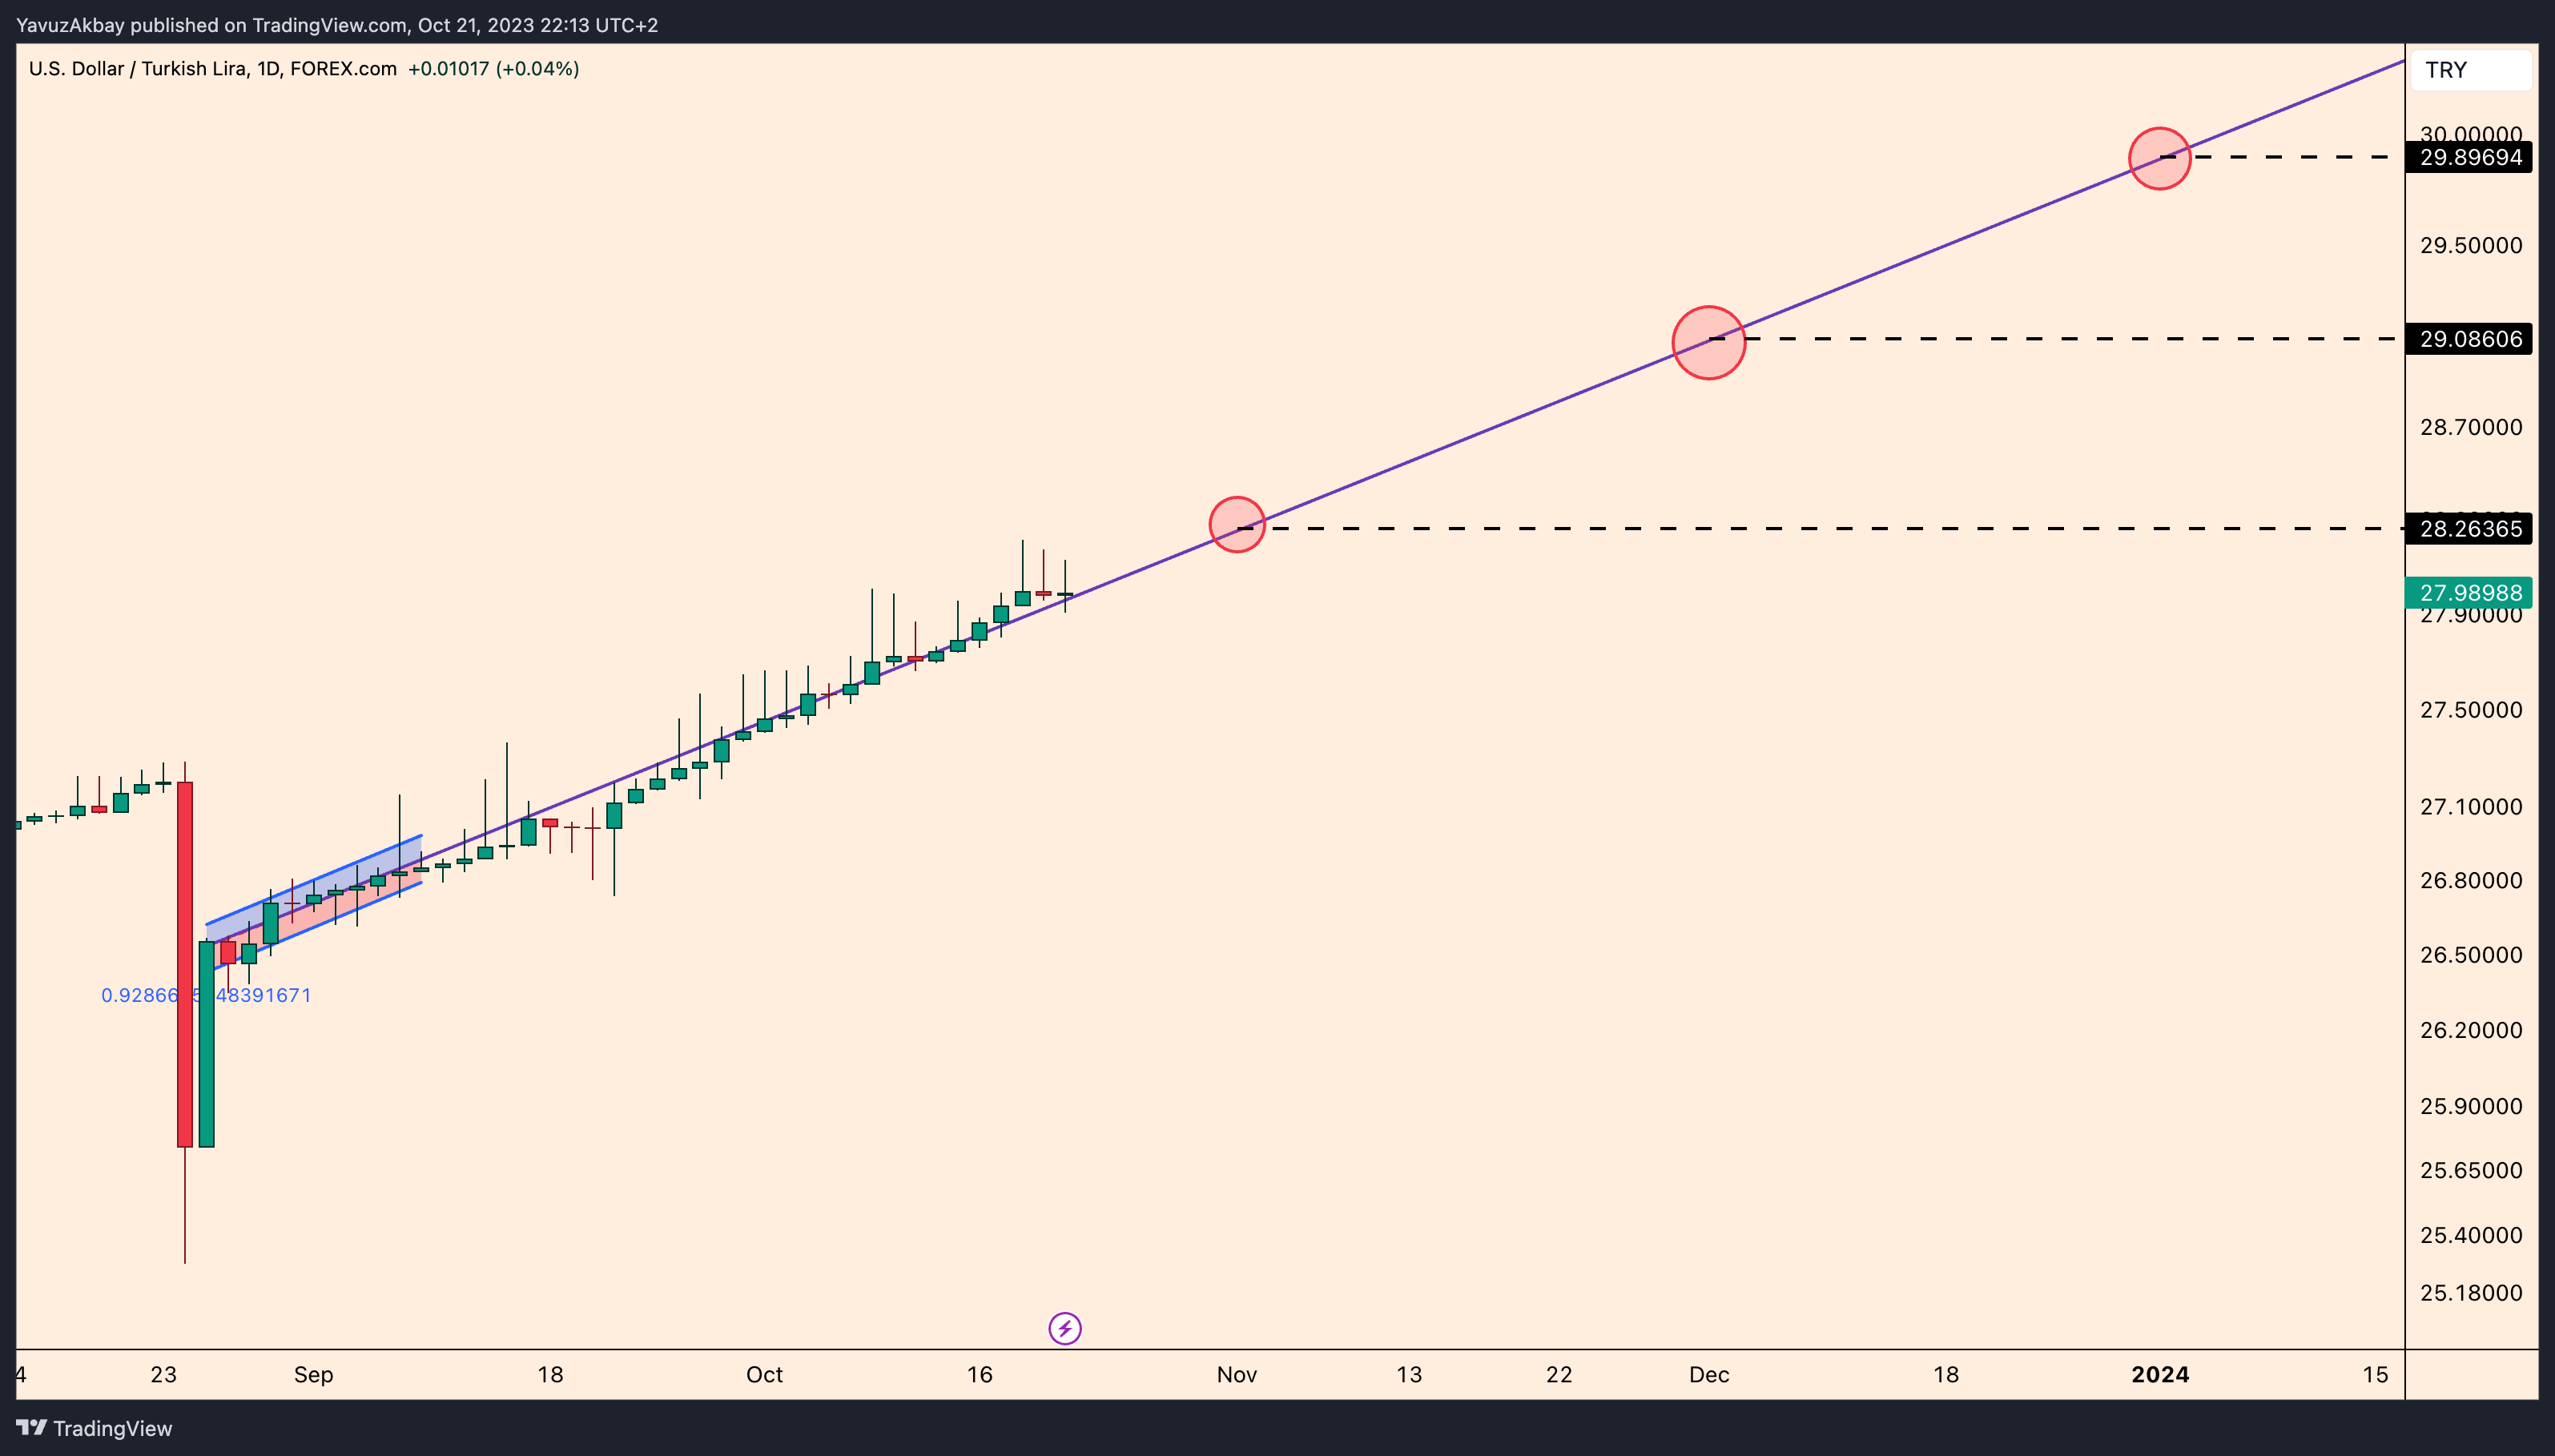
The Dollar/Lira parity is moving in the regression that I have been telling my followers who have ordered coffee in the past weeks. If this progression continues, I predict that the Dollar for Turkish investors will be 28.26 Lira at the beginning of November, 29.08 Lira at the beginning of December and 29.89 Lira at the beginning of January. Since Turkey is an extraordinarily unstable country, these levels are certainly subject to change, so this analysis was done using the regression method only and has been guiding me since approximately mid-September. So I felt the need to share it with you, my followers.
USDJPY
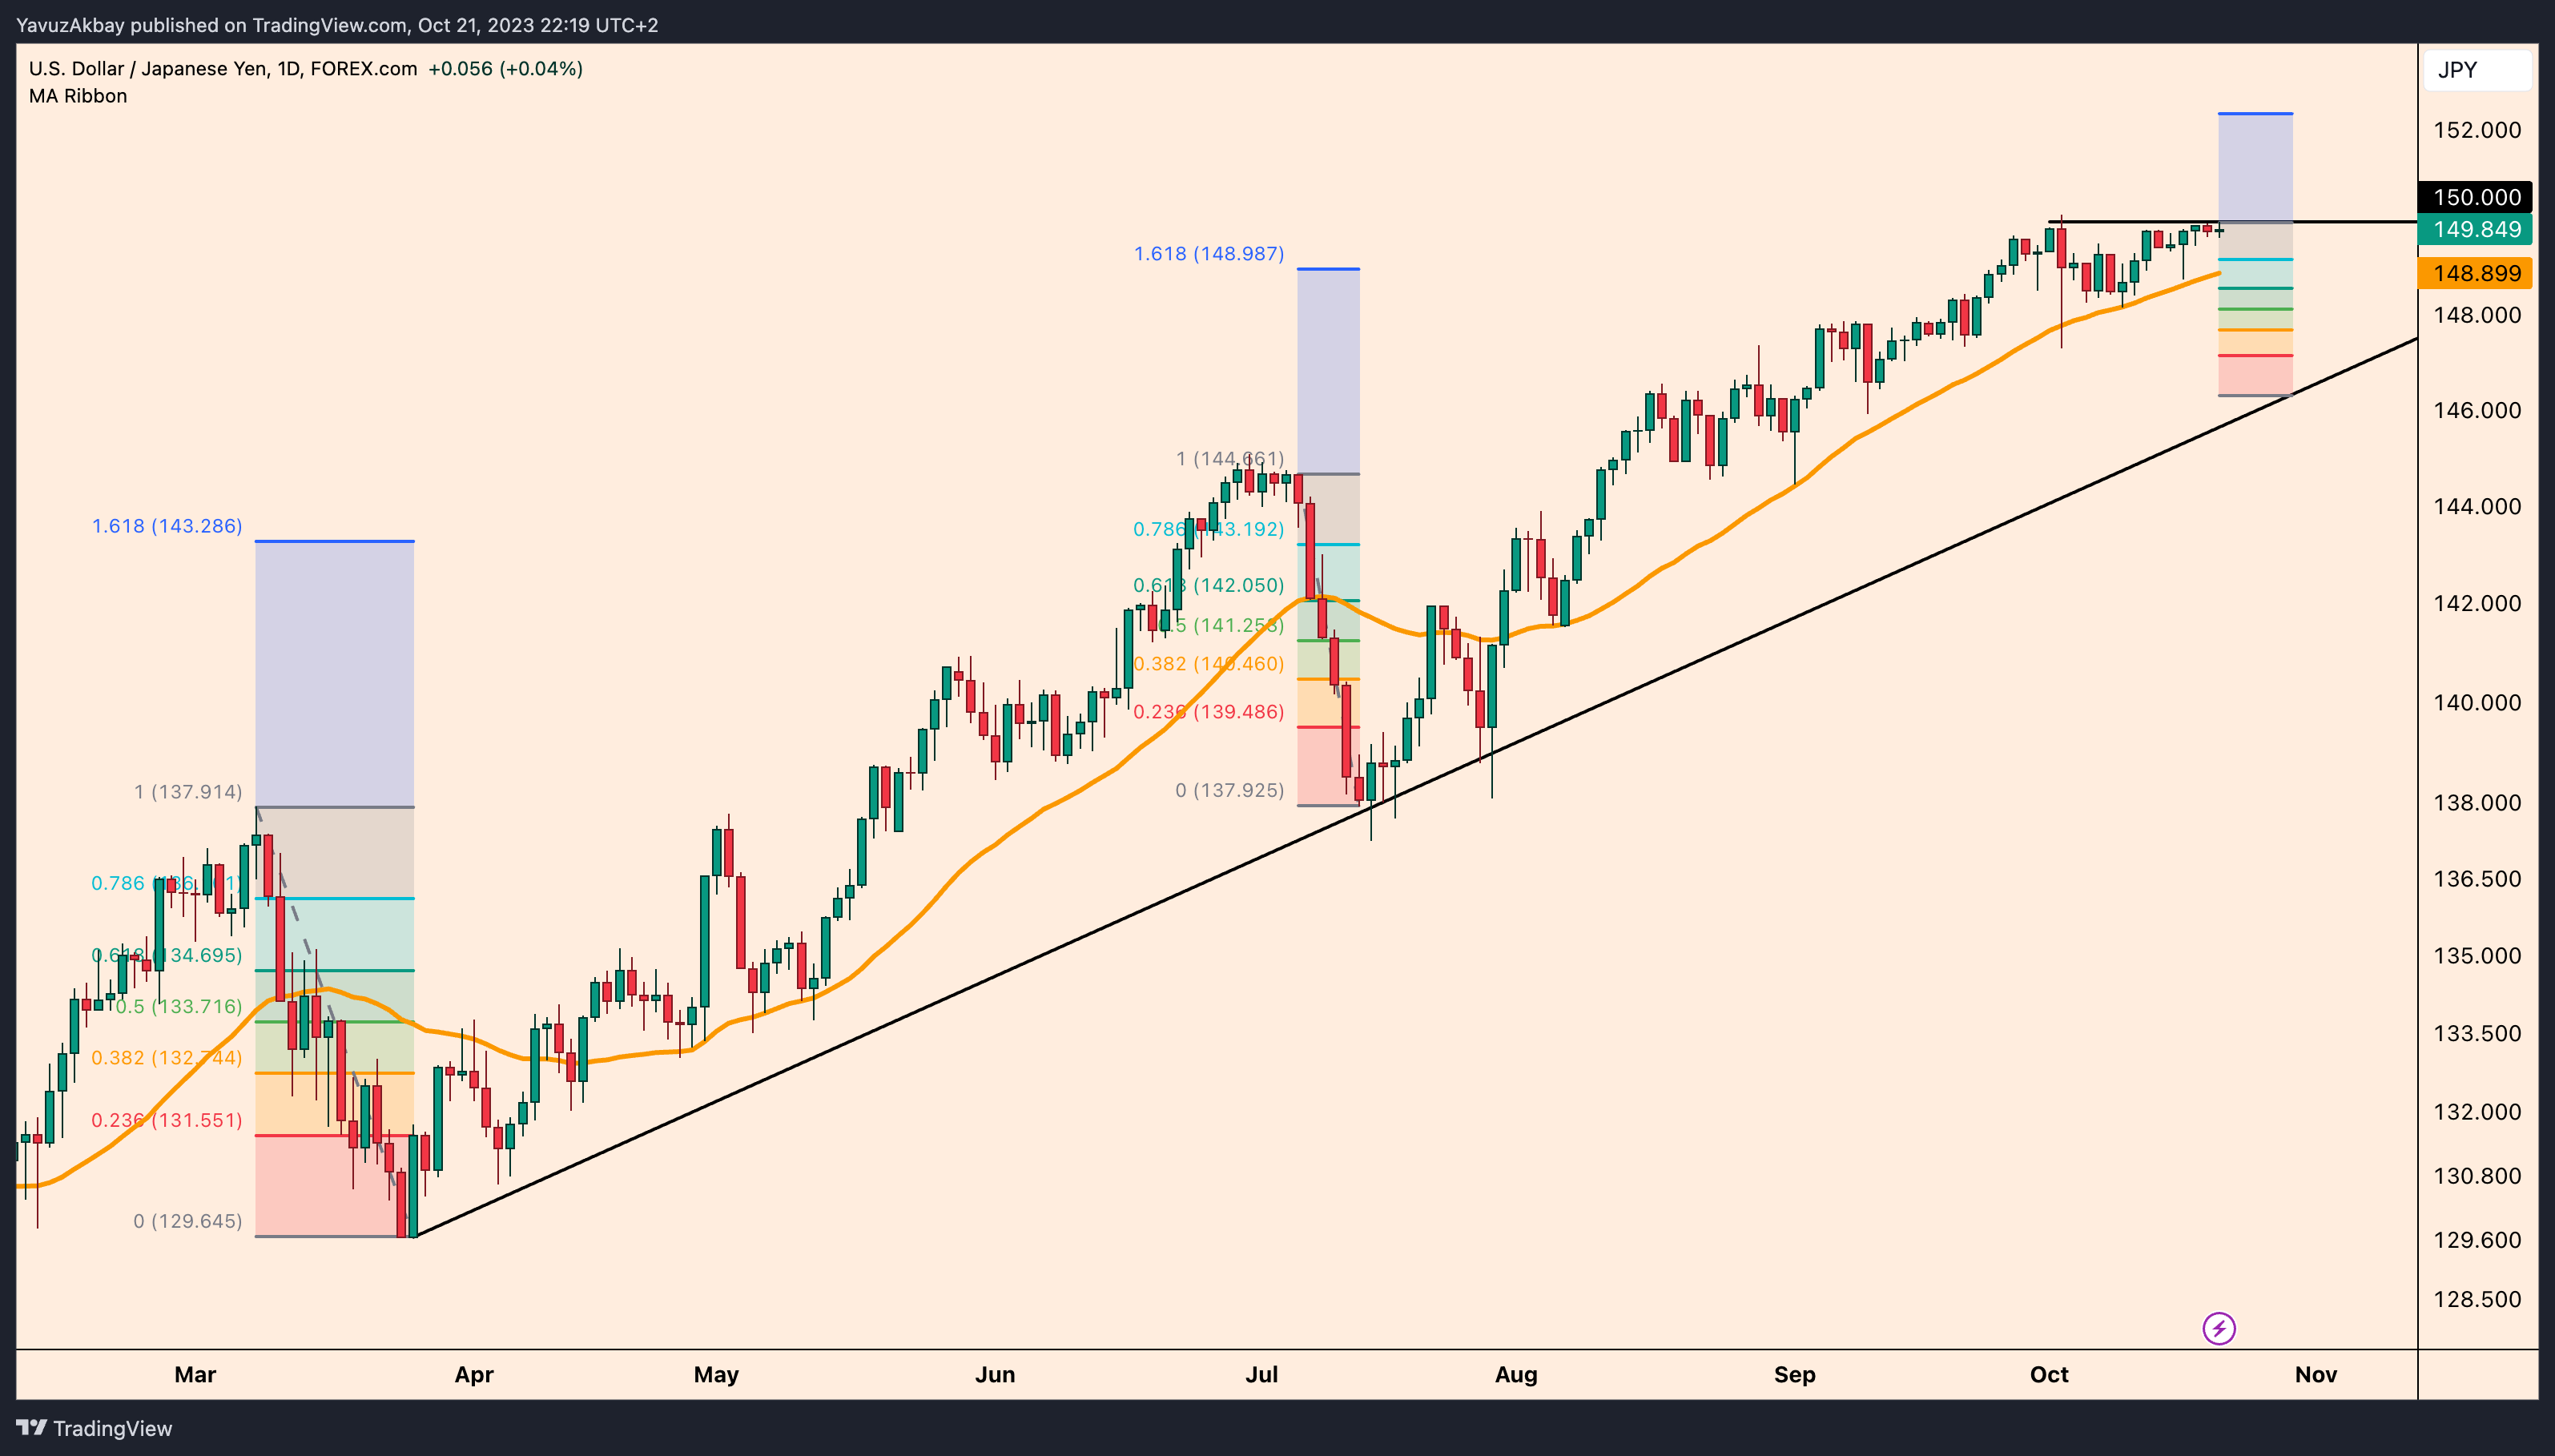
The Japanese yen has been continuously depreciating against the dollar since early 2023. The Japanese yen, which has corrected repeatedly during this depreciation, has been trying to break the 150,000 level since early October. I have not received a definite sign of rejection from this level, but if the Japanese yen falls below the 40-day moving average level of 148,900, I think it will correct at least to 146,500. I determined the target it will run after this correction by applying fibonacci correction to previous corrections. If we consider that the Japanese yen, which ran up to the fibonacci level of 1.618 after the previous corrections, will run up to 1.618 after this correction, we can see approximately 152,334 as a target.
EURUSD
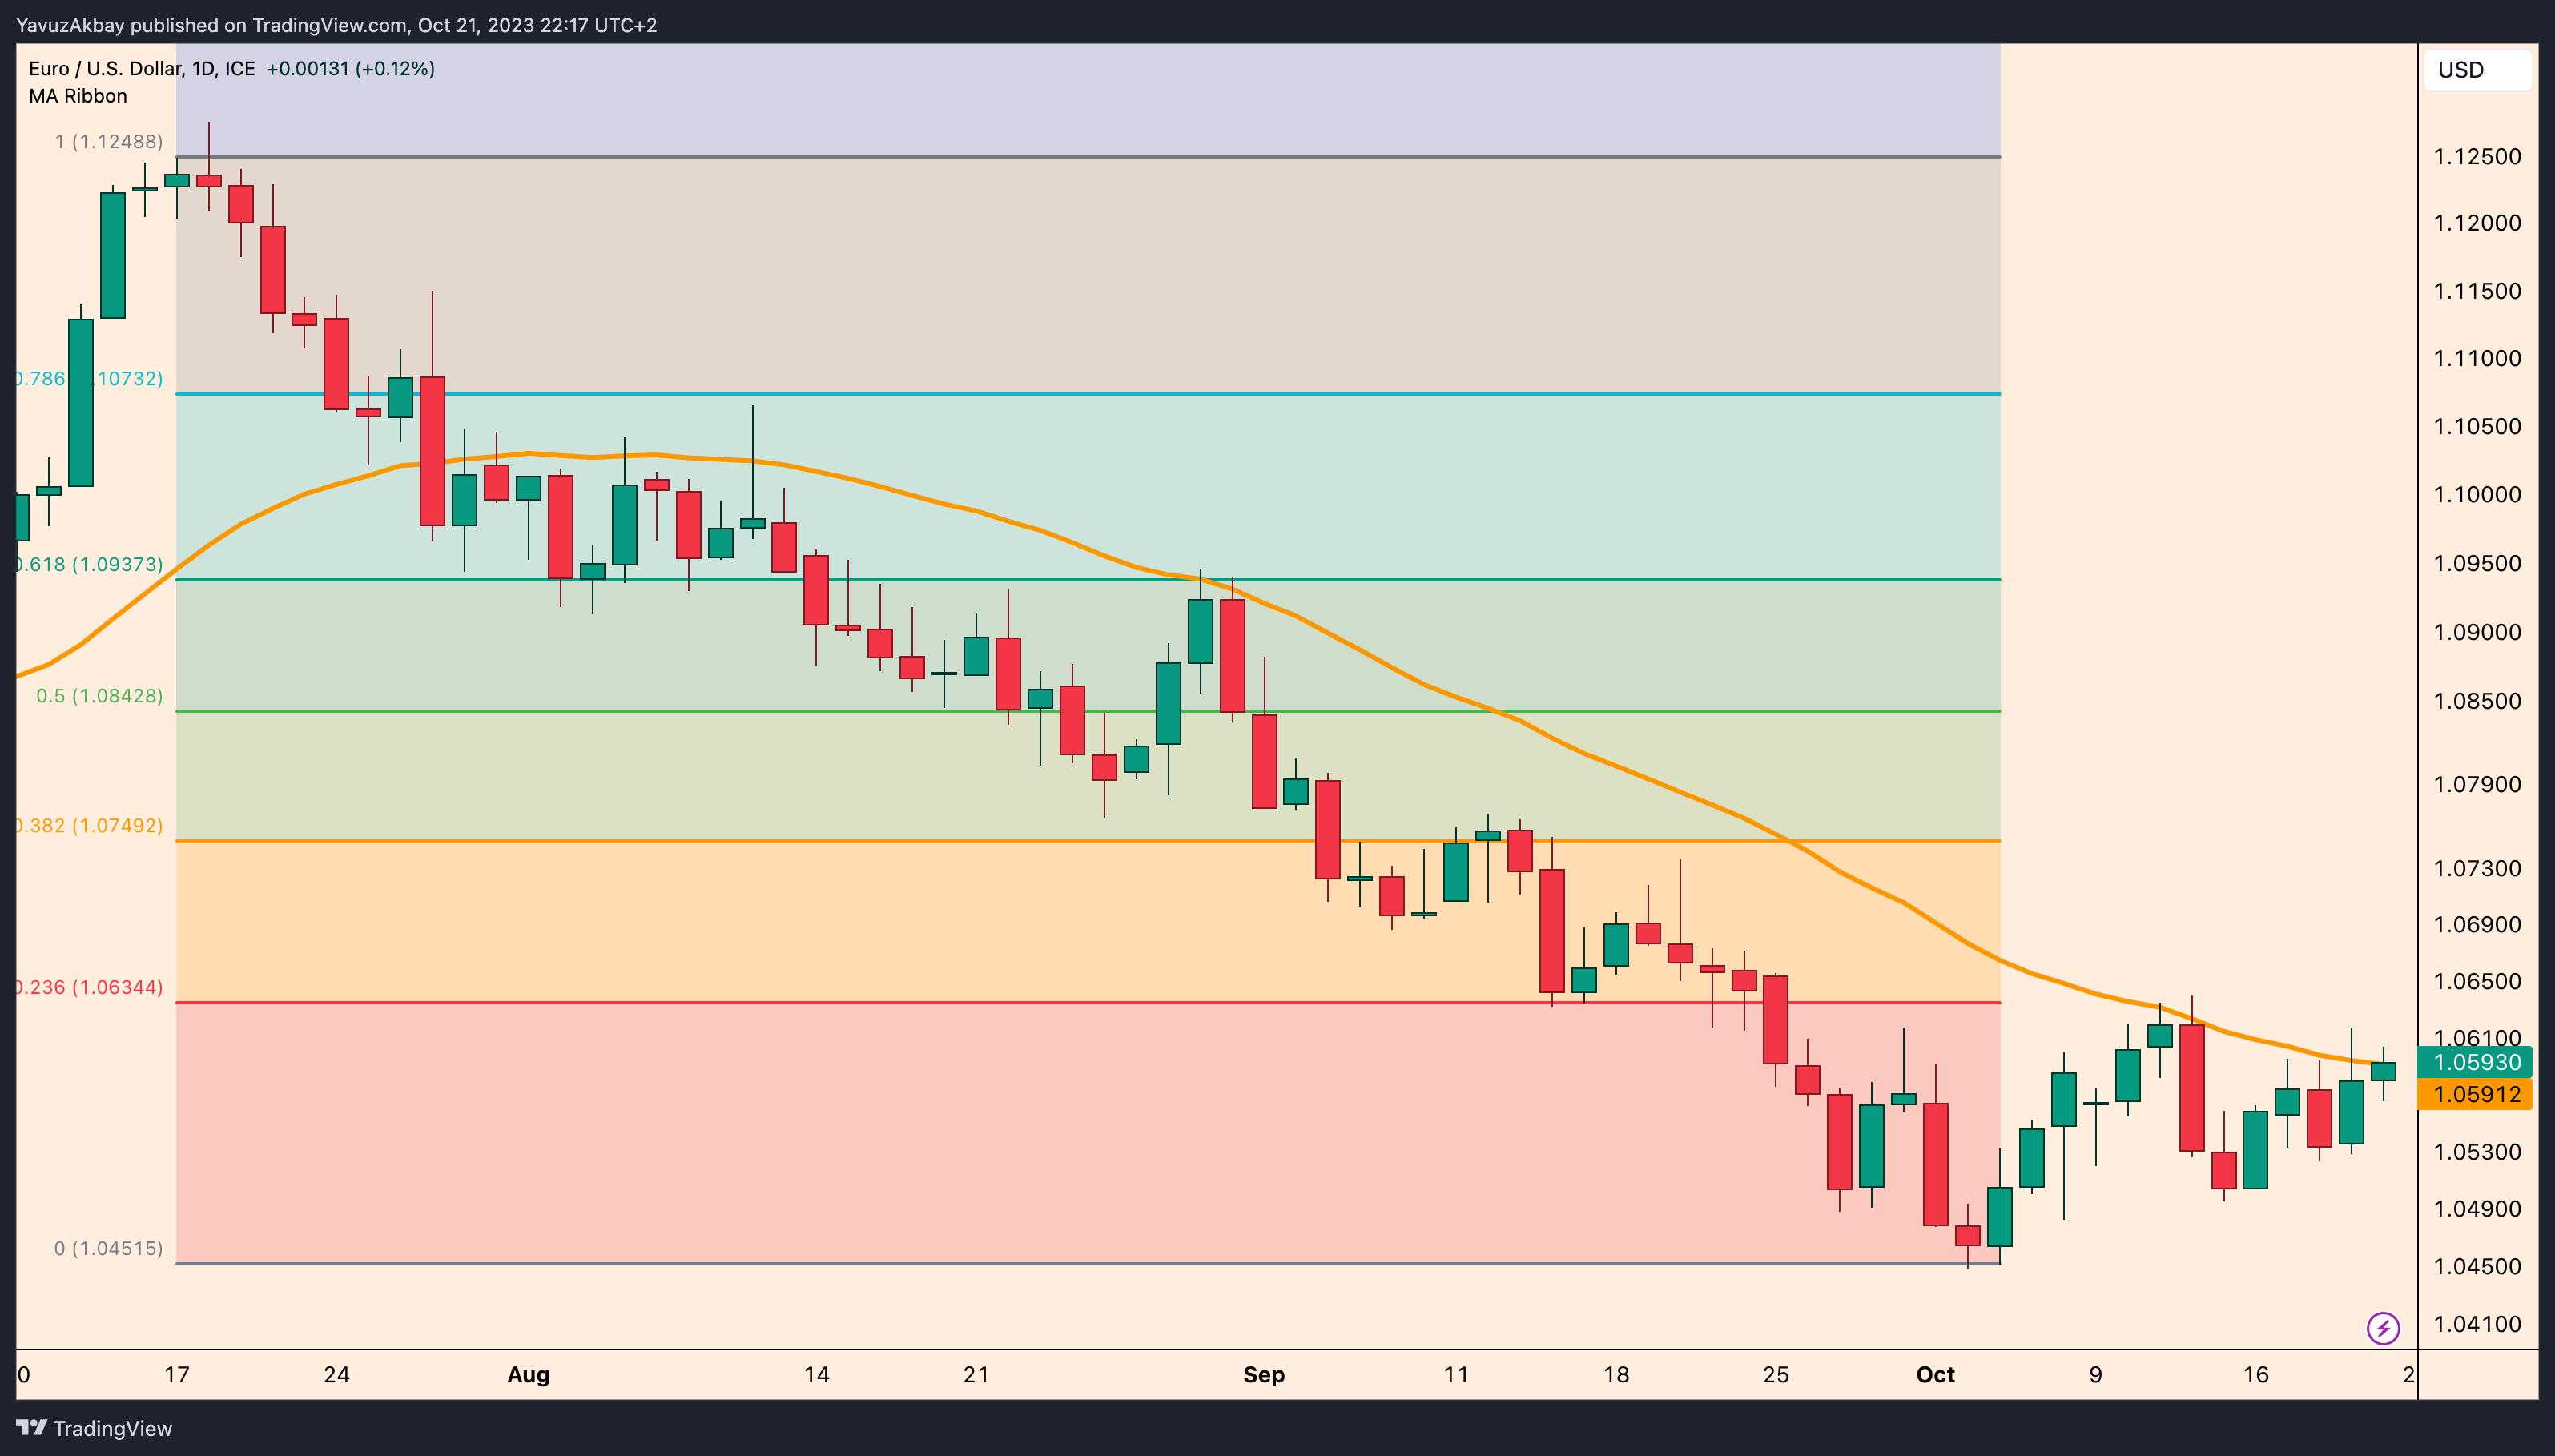
On a daily timeframe, the Euro is in a very critical zone against the US Dollar. Having fallen as low as $1.045 in early October, the Euro has started to run again and is currently trading at $1.059. I think that especially the 40-day moving average is a decisive indicator for the Euro. After 2 days of closing above this moving average, I think that the Euro will rise in compliance with the fibonacci correction. The levels I will follow here will be $1.063, $1.074, $1.084 and $1.093 respectively.
DOLLAR INDEX
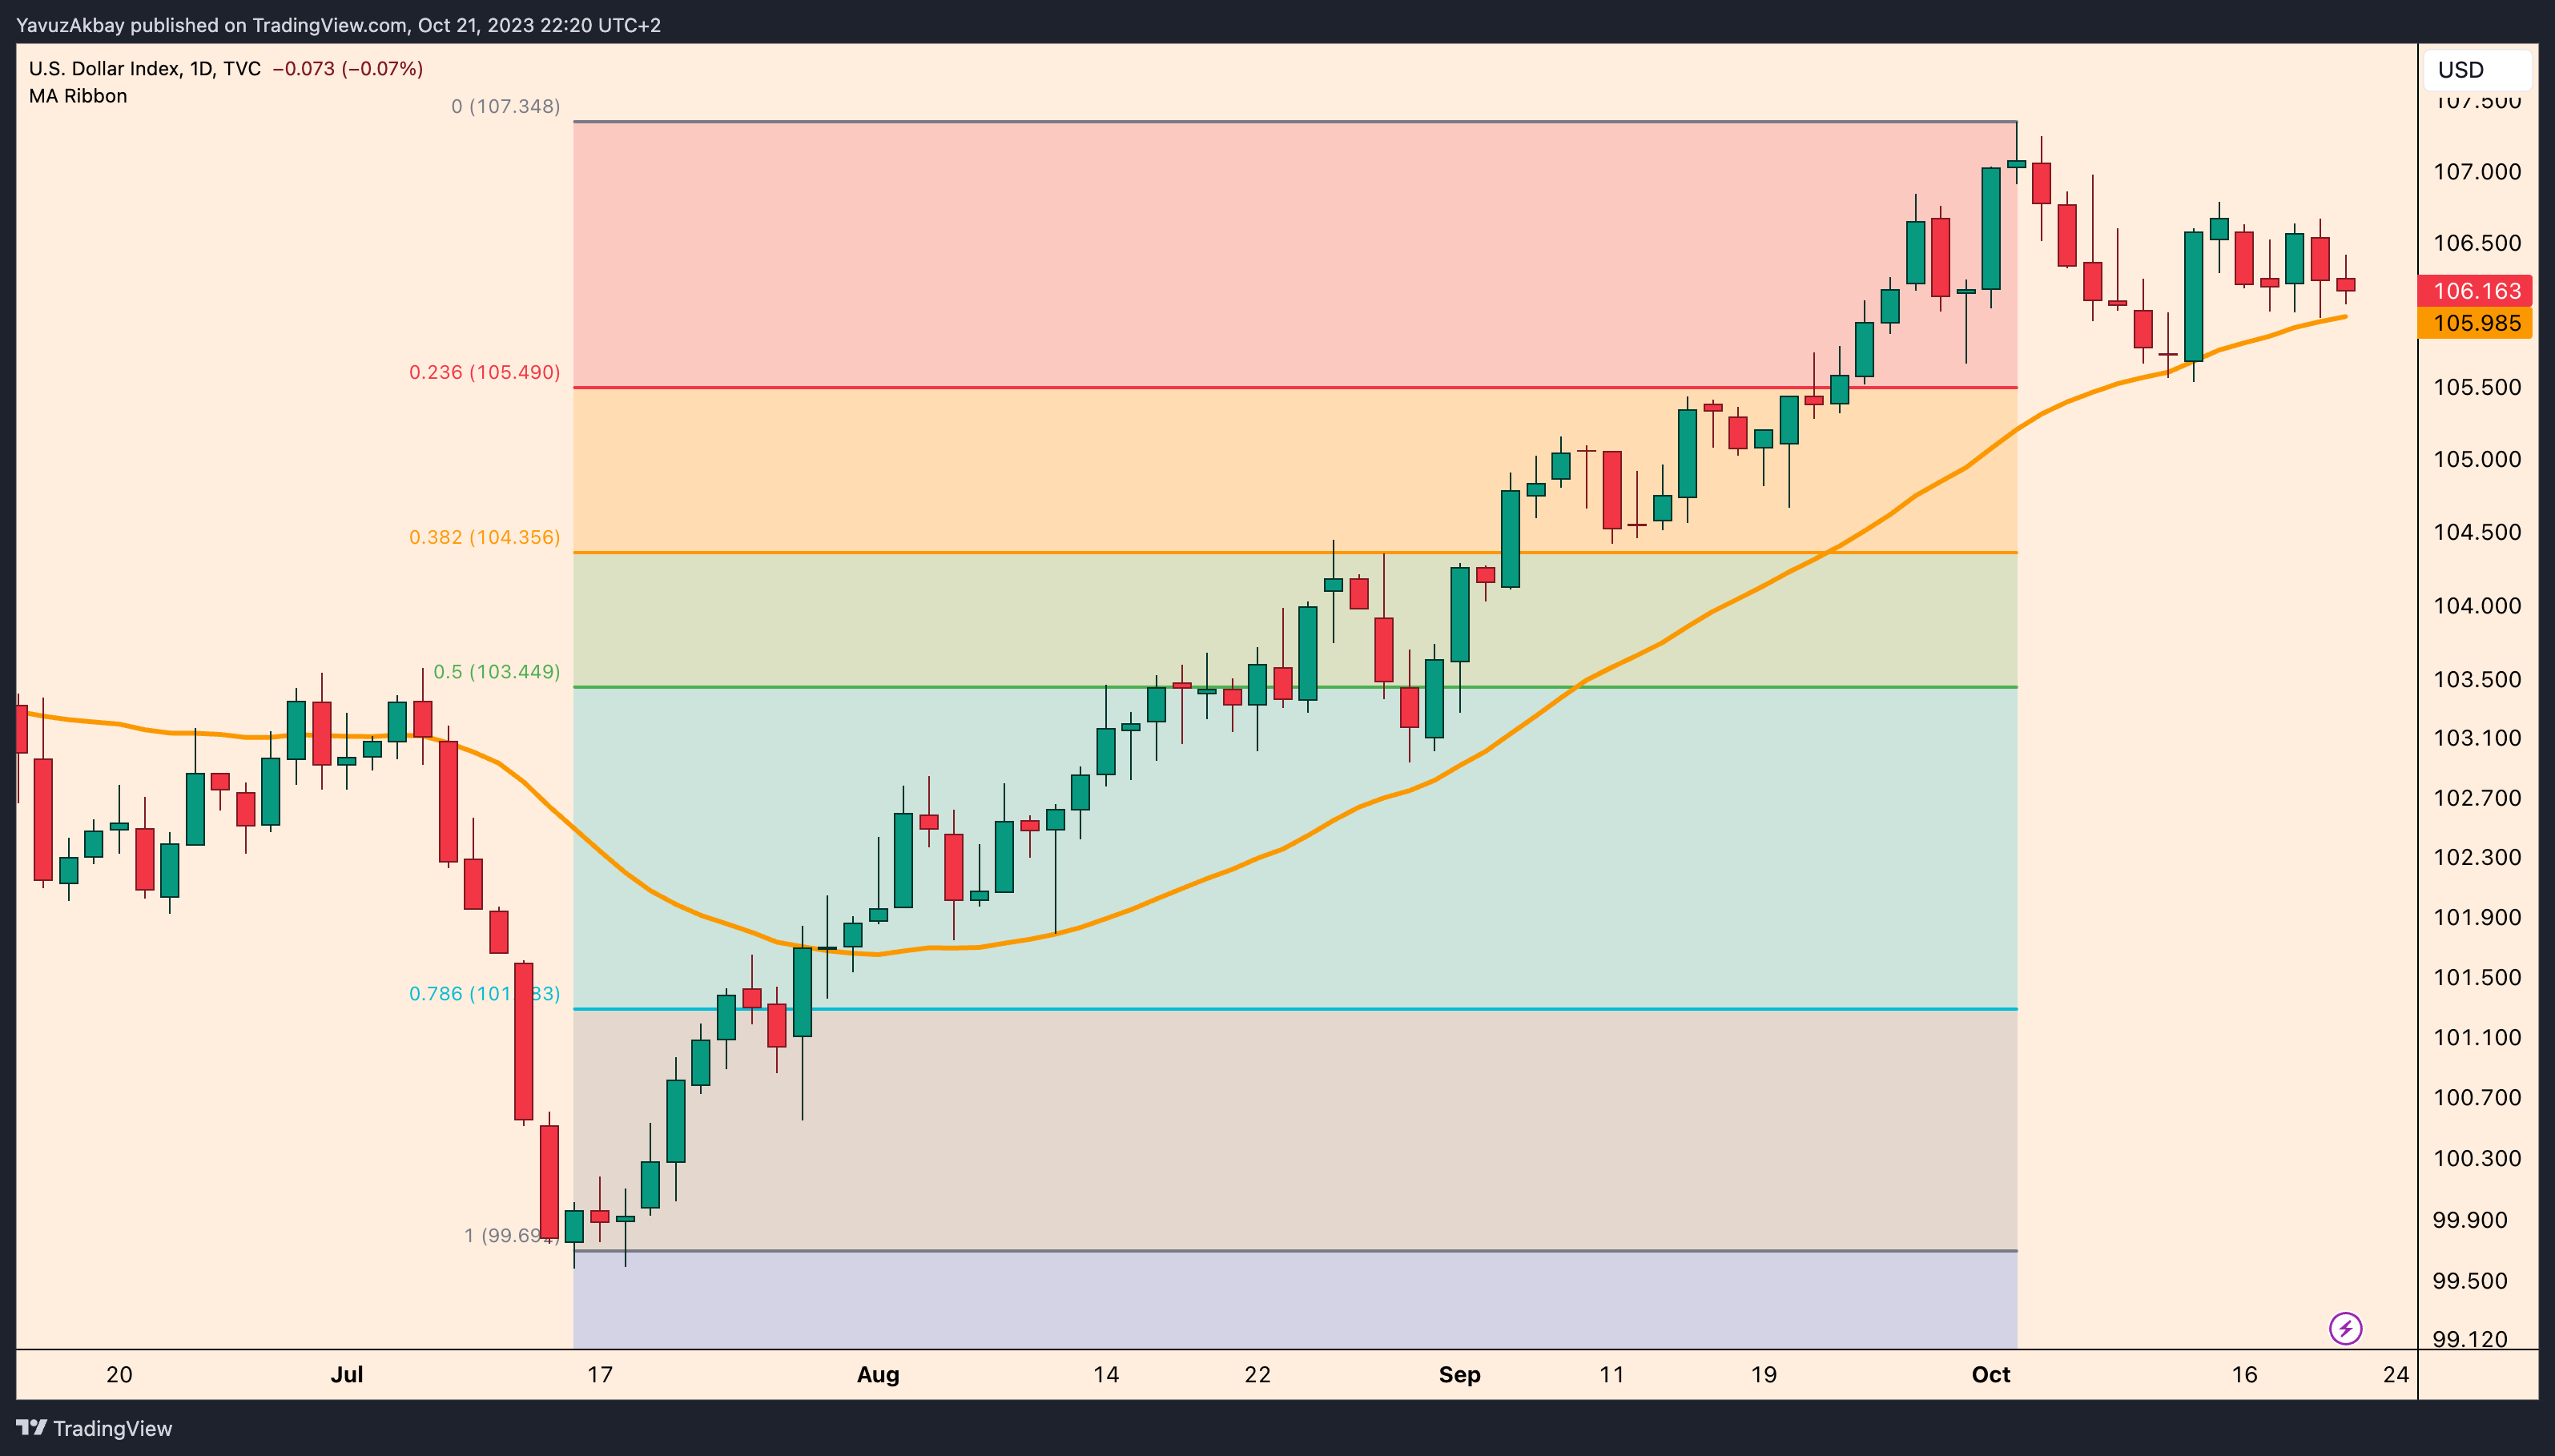
The dollar index seems to have finally taken a break from its relentless run since July. The index, which rose about 7.30% from $99.600 to $107.000, has been killing the markets in this process. Since the 40-day moving average is working very smoothly in this index, I think this moving average level is also important for this index. So if there is a daily close below $106.000, I think the index will fall at least to $104.500. Since this analysis is also consistent with EURUSD and USDJPY, I think it is very possible that this scenario will come true. After that, you know that the decline of the dollar index also means that the markets are rising in general. So I think the markets will breathe for a while in such a decline. It will benefit Bitcoin, Commodities and Forex.