

I am introducing a new segment starting this week; The Chart of the Week, in which I will describe the price chart which may have a significant effect on the stock market over the next few days, weeks, and perhaps months.
In today's installment I am focusing on the Nasdaq 100 Index (NDX), which houses the largest 100 technology and related stocks in the Nasdaq market. What makes this chart significant this week, and perhaps in the future is that as the pessimism over the Fed's next rate increase rises, money is actually moving into the technology sector.
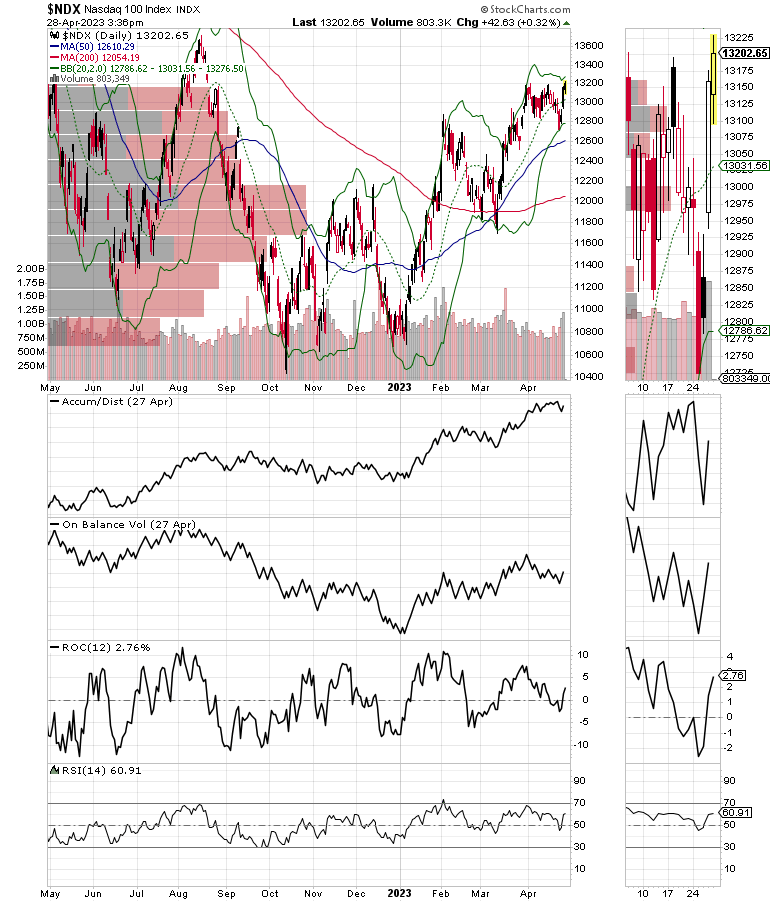
As the chart illustrates, the index is now well above the 13,000 price area. Moreover, a move above 13,200 could lead to a significant further extension of the rally. This is important not just for technology investors, but for the whole market as investors who have either been selling the market short or have been staying out of the market in fear of the Fed will likely be forced to move money into stocks.
In the short term, if NDX moves above 13,200 we could see a move to 13,600., I would not be surprised to see this develop before the Fed's May 2-3 meeting. On Balance Volume (OBV) is slowly rising, which means buyers are starting to move in. Meanwhile Accumulation Distribution (ADI) is in a well established uptrend, which means short sellers are running away.
I'll keep an eye on this for sure. But at the moment, this is very encouraging.
Thank you for your support, especially if you're a member. If you're not a member but like this post consider buying me a coffee or becoming a member. Please share these posts and hit the Like button. It helps to spread the word.