

Main Elliott Wave count of USD currency basket against 16 other currencies (EUR, USD, GBP, CHF, JPY, CAD, AUD, NZD, CNH, DKK, MXN, NOK, PLN, SEK, SGD, ZAR, TRY).
Monthly Chart
Let’s start with emphasizing that the USD Basket is not the same as the DXY index, where the latter only contains 6 currencies (EUR, JPY, GBP, CAD, SEK & CHF) + USD while the former has 16 + USD. While the graph of the two indexes price curve usually does not differ materially, I like to use both because when they show divergence it is typically due to included/excluded currencies like AUD & NZD. In addition, with more currencies involved you get a more solid average value in my opinion.
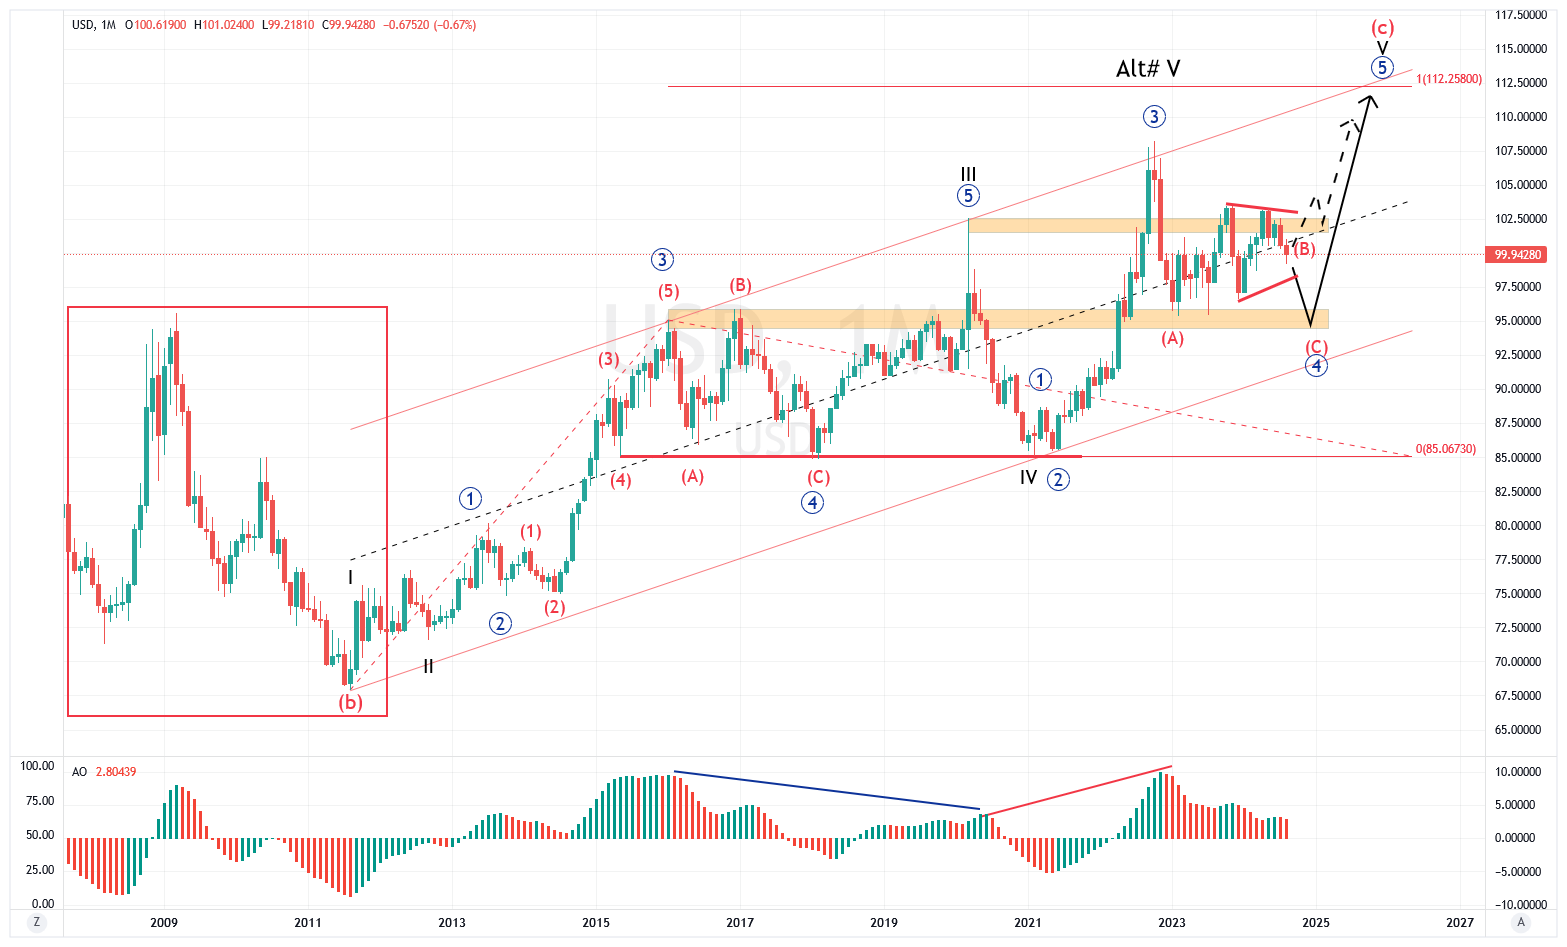
One disadvantage with the USD Basket is its limited historic data that only goes back to Sep-02 but we know thanks to the DXY that the Dollar came down from its 1985 in 3 large waves. However, here is where it gets interesting; while DXY made a low in 2008, it took until 2011 before the larger index did the same time. At that time though, DXY did not make a new low.
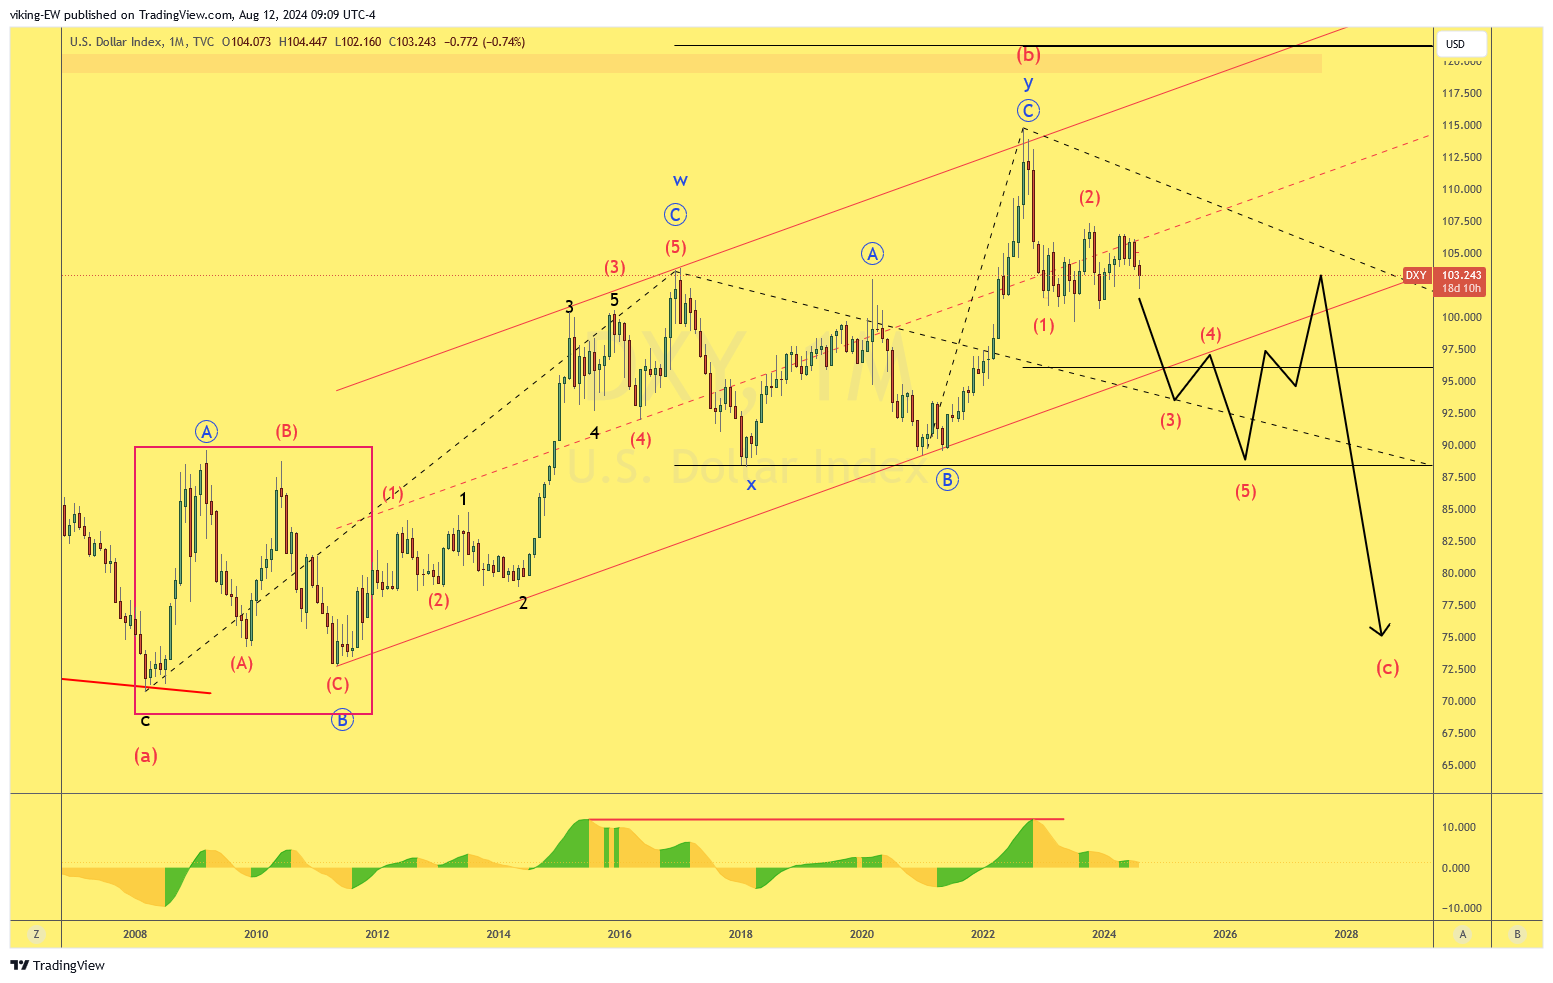
This divergence makes for an interesting setup that provides two different counts determine if there will be further USD strength or excessive weakness to come. While it is not uncommon to see reasons for both a bearish and bullish count in a chart, this typically plays out on lower time frames over a shorter period. Here we have a long time structure anchored in a low going back >10 years. That is quite unique.
Of course, neither of these charts will tell you what happens next but that is a reality we always have to deal with. No one knows what will happen next and no chart can with 100% certainty tell you either. Instead, these charts really tell you and are a receipt of the dollars manifold role of complexity as a currency. While it certainly is not a risk currency, it is not just a risk-off, aka safe haven, currency but it is also a growth currency. On top of all it is also the reserve currency of choice, since many years and will still be for many to come.
Weekly Chart
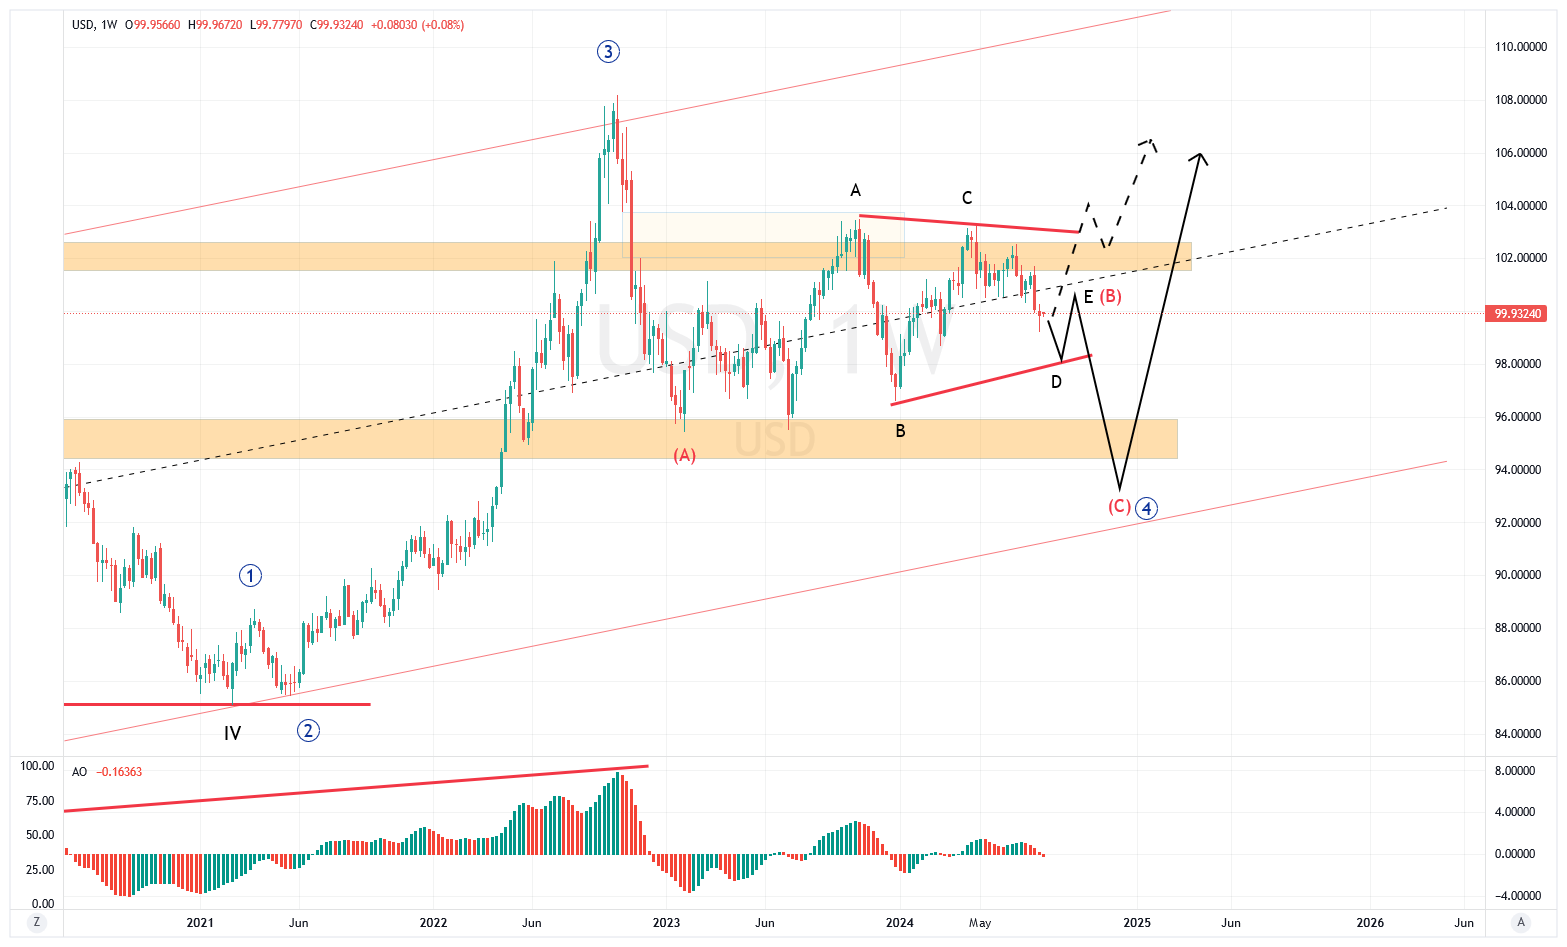
However, once it has shown its intentions then we will have a pretty good picture of what probably will happen next and how far that move may reach. At this moment, I would say that USD probably is waiting for a catalyst in what could be seen as a “no man’s land” zone. This expresses itself on the weekly chart as a contracting triangle pattern. No one knows which way it will breaks, but my estimate (of fair guess if you like) is for a 60/40 chance it will break lower, first. Next support will then decide which of these two counts really are the correct one.
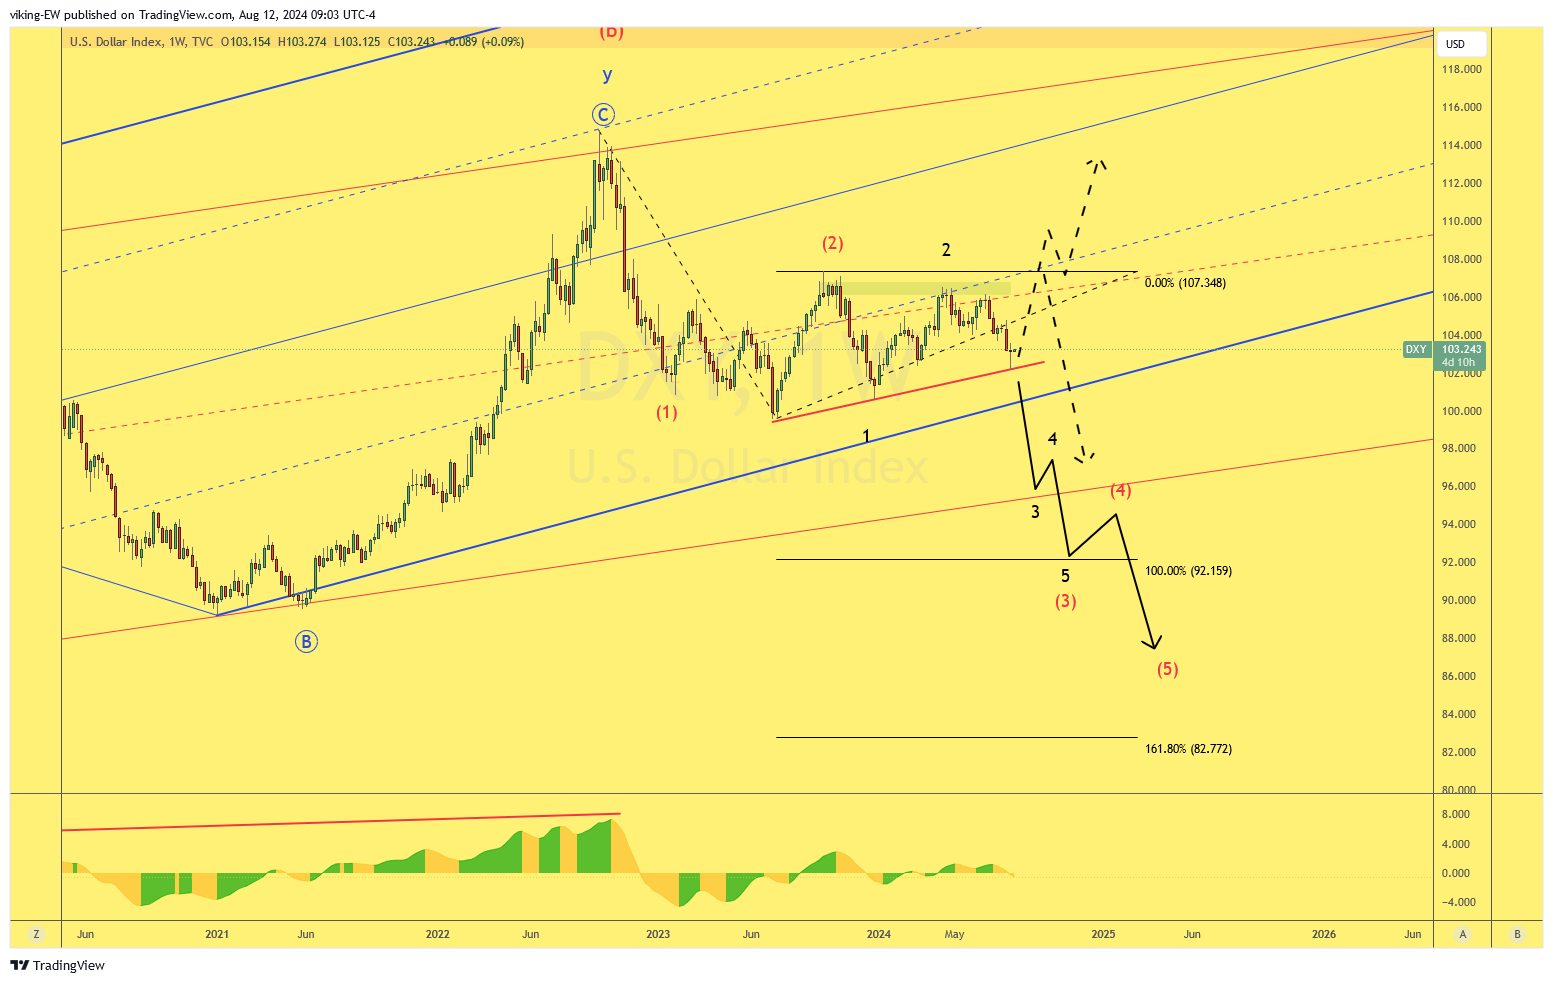
On DXY we see a similar contraction, but here we are looking for an impulse lower. For this to happen, nearby trendline support needs to be broken first of all. If this fails, it is likely the whole count fails and the probability for a move higher would increase. There still remains resistance, which has to be broken as well, or it turns around once again. This is the nature of a correction, whether this is a wave 2 or B
I will return to this once we reach and are about to cross that bridge.