

Monthly Chart
The Monthly structure of Gold is pretty easy to count in my view, except I would say that wave (III) on this chart could possibly be wave I – If Gold were to stretch out far beyond its current target range around $3000. In which case the following sub waves would have to be adjusted accordingly.
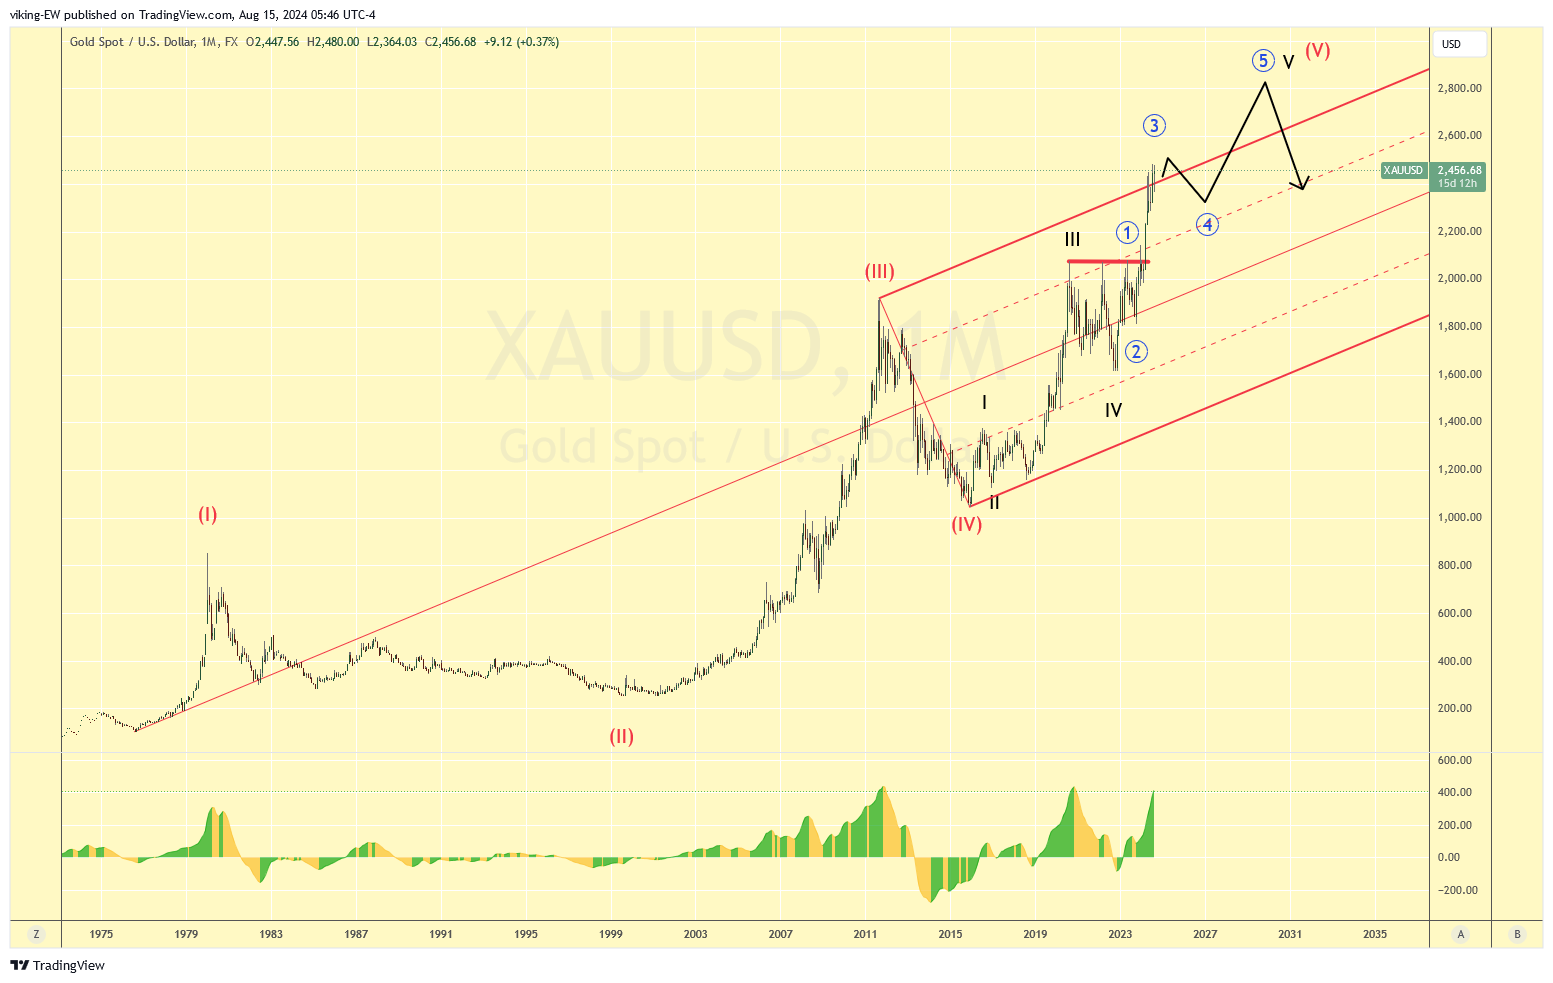
The price development of the yellow metal has been really explosive since the beginning of the 21th century and while I think (and as the count suggests) there is still further to go, I think this market is quite overbought at this moment and ripe for some correction. Thereafter I think it will continue to move higher but in a less steep angle and a more traditionally extended wave 5 of V of (V).
Of course, this projection goes far into the future and many things can happen between now and then, so it’s crucial to be prepared to re-evaluate as things change.
Weekly Chart
The count continues to be clean and nice also on Weekly, but as can be seen it is approaching or already is at a high here for wave (5) of Primary 3. Is the high in? I don’t know, nobody knows, but there are indications that could be the case.
As an example, we can see divergence on the Weekly AO block, which has flatten out making a second lower top despite price now is higher than it was at the higher block peak. Also, after a first accentuated pin marking the end of wave (3), despite price has moved higher the wicks on the upside have become more frequent.
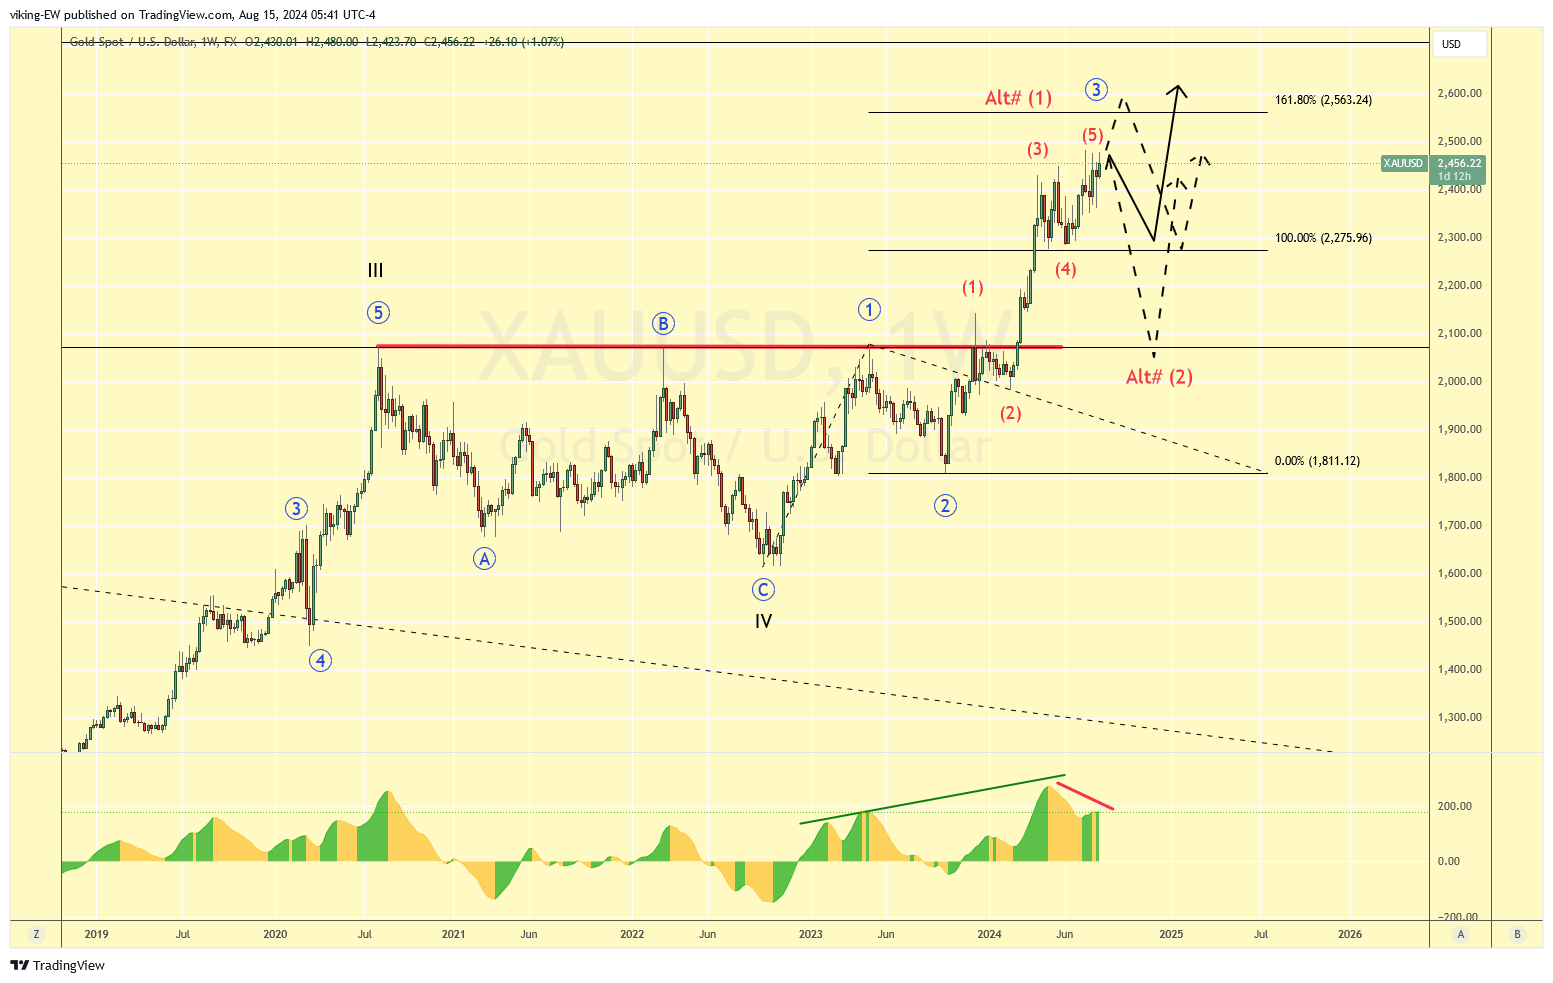
The distance to the wave tunnel has been stretched with about 37% and something similar with the distance to the Ichimoku cloud. That is not extreme but well into the danger zone for a snap-back to dynamic support.
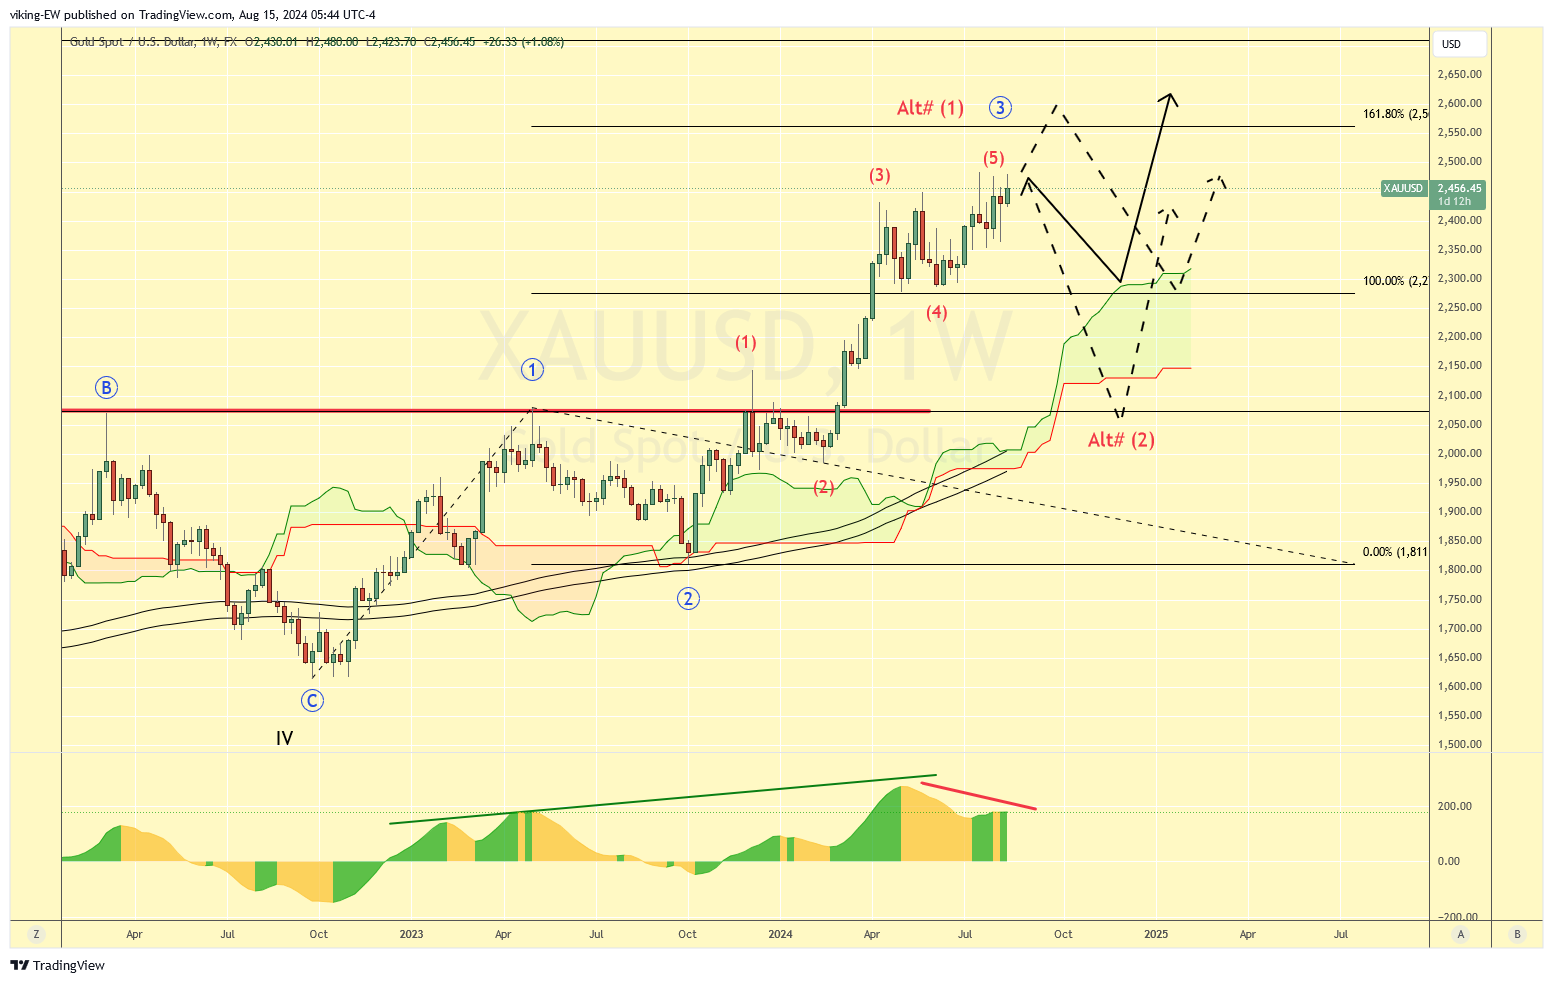
Would this be a good place to short Gold, or take profit and move to the sideline waiting for the next wave up? Could be but notice that this 5 waves sub structure for wave 3 hasn’t yet reached 161.8% of wave 1, so it could as well extend even if there is no sign of it right now. Let’s see what Daily has to say.
Daily Chart
The daily chart doesn’t provide absolute clarity about what’s taking place at the high. Like, wave 5 is a tiny bit short as it’s still below wave 3 – if it is wave 5 as there is a slight overlap between 1 and 4, but I can live with that at this stage of wave maturity. Elliottwave isn’t perfect and rules are there to be broken when it makes sense. The sense here comes from the accentuated divergence between both (3) and 3, as well as between 3 and 5.
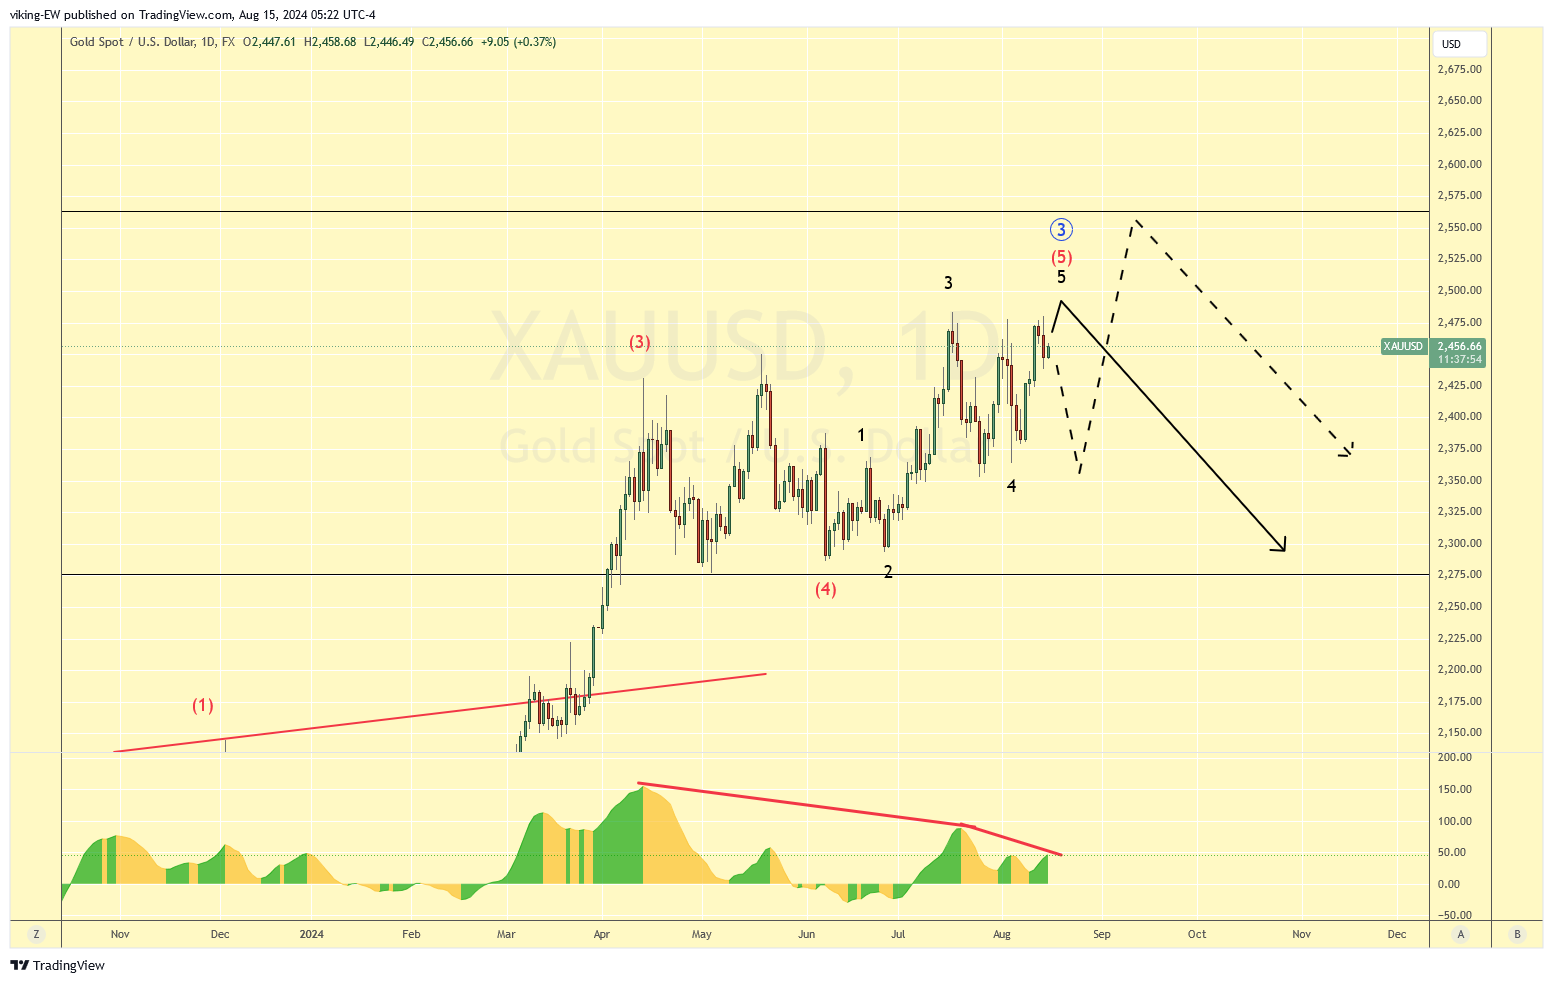
So a truncated 5th could make sense here but if price were to climb above wave 3, that would be to prefer. We are also currently also having an Inside day unless the range of the mother candle is breached. That mother candle (yesterday’s) is also a bearish engulfing candle or “outside day” candle.
So the final verdict would be, expect lower prices, even if we get a new high, but wait for that engulfing candle to either show a fakeout on the high or breaks to the downside. That would make a trade with higher probability to succeed. I’d prefer the fakeout scenario here.
Alternatively, we are either still in wave 4 with a new high coming after a drop down to the $2360 area. A 1-2, 1-2 extended wave scenario is also a possibility, if something happens that by nature pushes the gold price higher, but right now I see this as a lower probability although can’t be excluded.