

Monthly Chart
If we assume EURUSD made a final low in September 2022, then the structure from the 2008 high makes a perfect WXYXZ complex combination in a Super Cycle wave (b) correction. In such case, next wave up has to be a wave 1 impulse or we would have to get creative and figure out somethings else if sticking to Elliottwave. We can certainly see one large wave up, but is it in 5 sub waves and is it completed? Unfortunately, the monthly chart doesn’t provide such granularity so we need to go lower on time frame to find out.
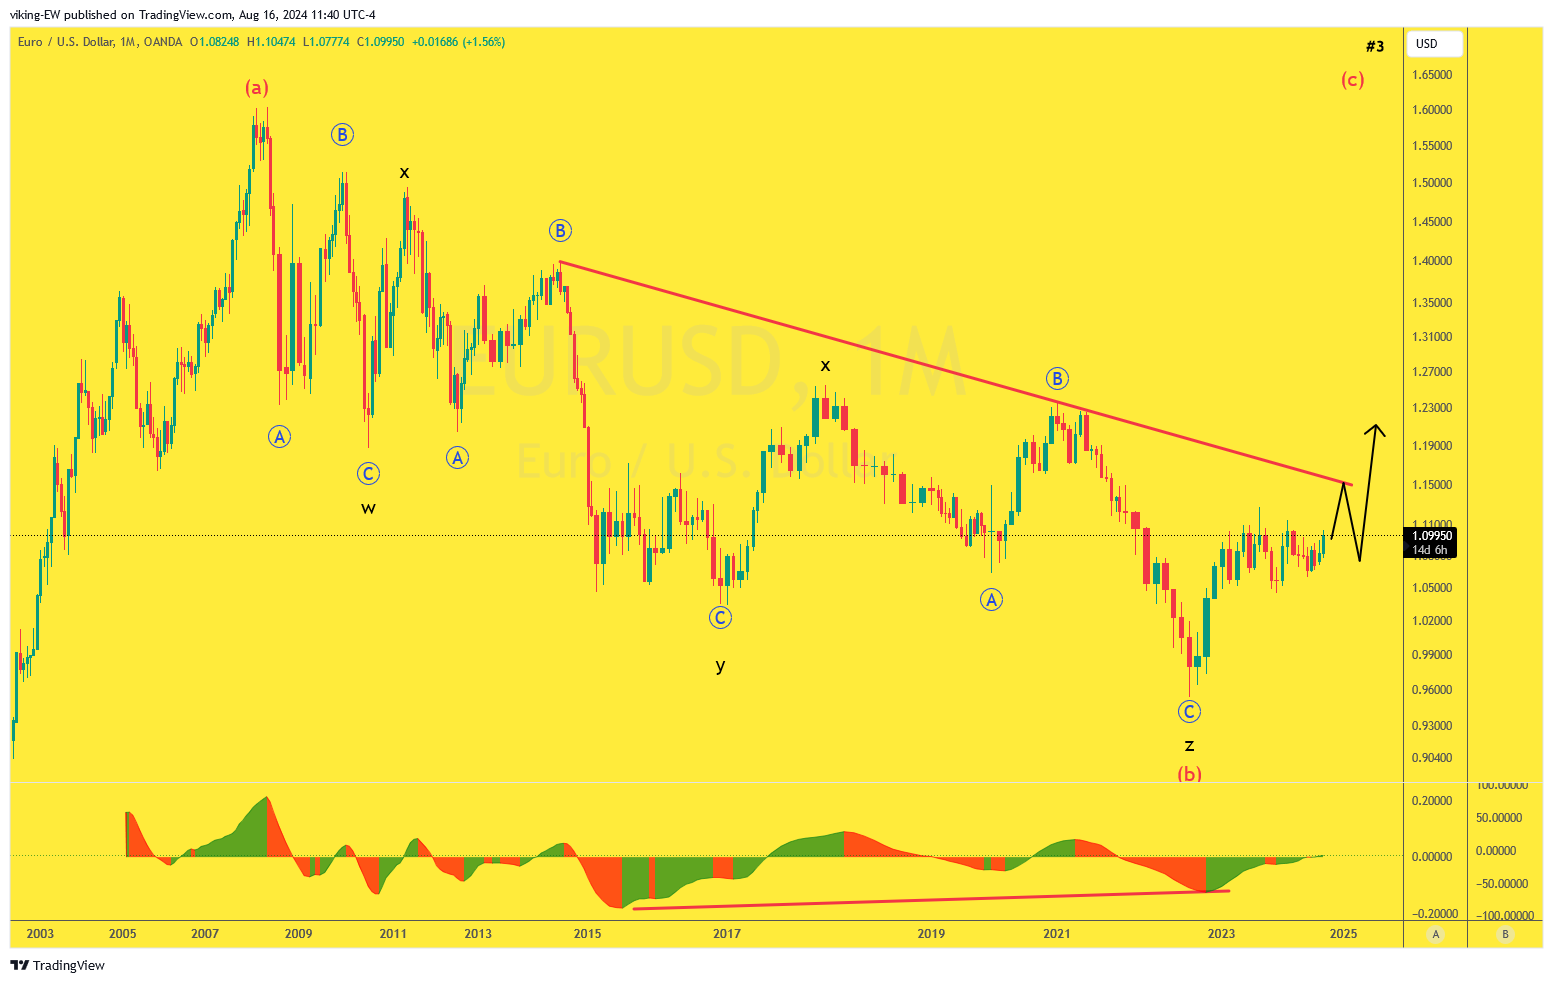
Before we do this, it’s important to acknowledge that the monthly candle hasn’t closed yet. Thus, despite it looks very strong today there is no guaranty that it will close like that, but if it all holds true… If we are in an impulse making 5 waves up, then we could see price back up again in the 1.60 region (or higher), in due time. It would probably take some years but using wave (a) as a template seems like a reasonable idea i.e. 6-10 years maybe.
Weekly Chart
Weekly shows what looks like a solid wave up to the high but is it a 5 waves impulse? In my view, as Daily also will clarify, it’s not and it can indeed be seen here but in a not very obvious way; The price action unfolding after the high, first a sharp drop then it looks like contracting into a triangle. Thus, sticking to EW rules it can only be either wave A or 3 at the high, with the triangle unfolding as wave 4 or B. Of course, the triangle drama is only true as long as price doesn’t breach the second high at 1.1140.
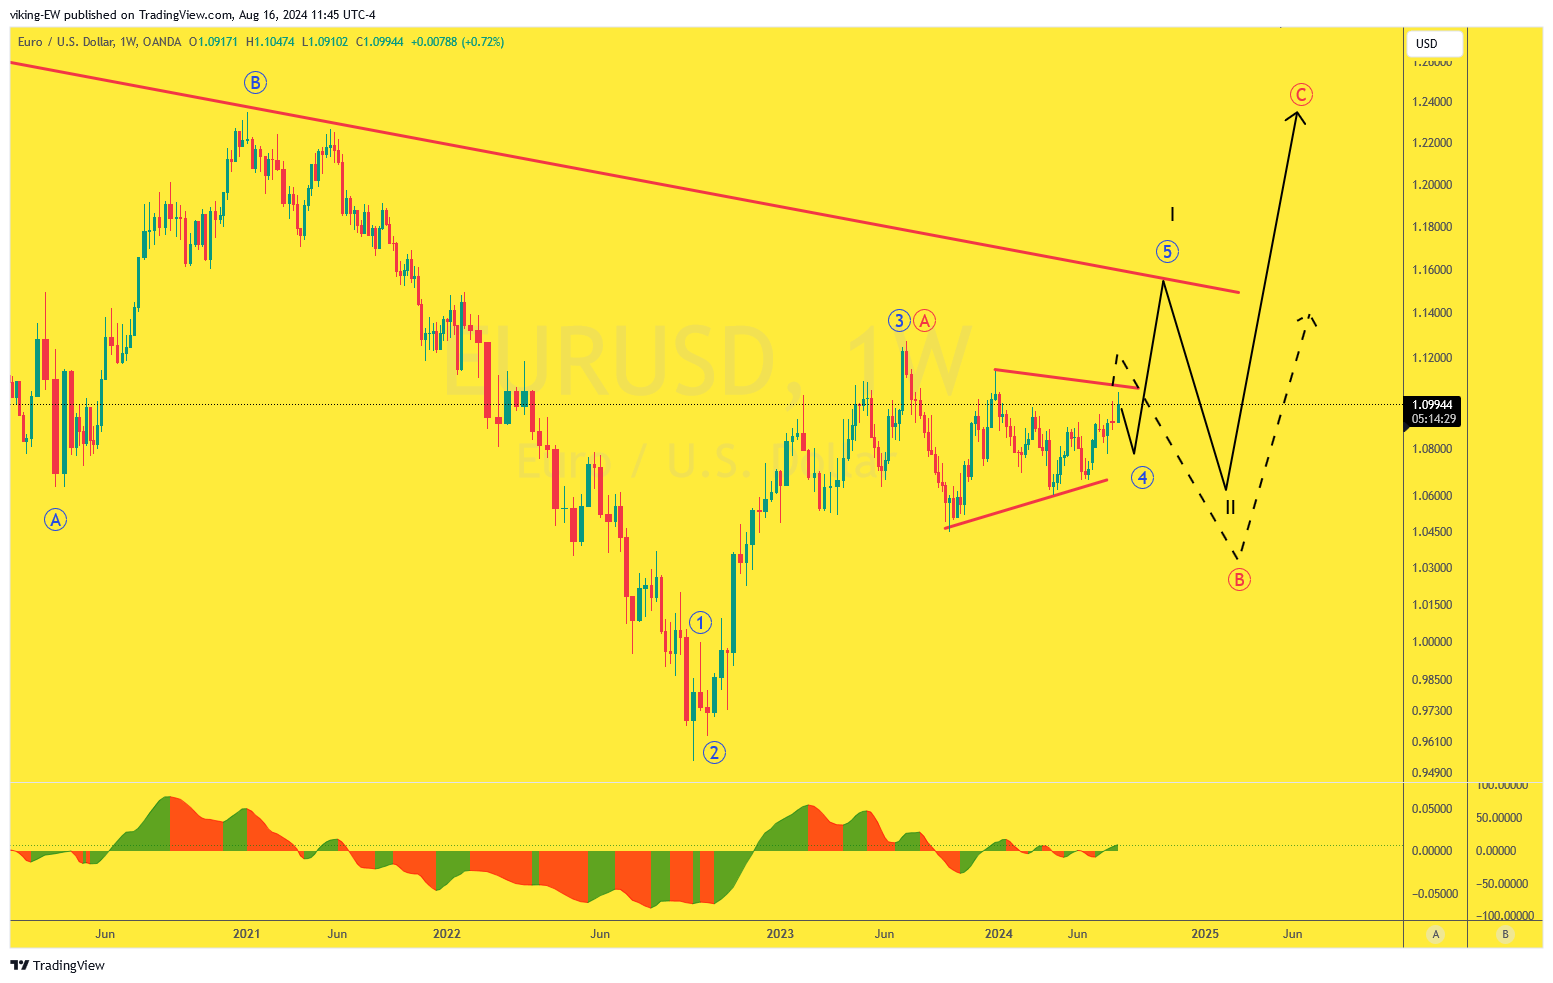
There is another tell, though, which gives an impulsive indication, even if the current high is that completed impulse. Look at and compare the structure on the way down to the left and the way up on the right. That should give comfort to the bull, even if we can fit in a completed 5 waves structure on the wave’s high. Let’s look at Daily for a yet detailed picture.
Daily Chart
So the Daily makes it crystal clear to me that the current high is either wave 3 or A and what will transpire next is to decide which of them. I have to say that I’m divided here; The larger structure calls for a bottom in place and that we now are in a 5 waves impulse up – and there is nothing that conflicts with that. However, if it doesn’t complete as a triangle here and then move higher, it would look more like a wave B to me than a 4, simply because the correction would proportionally be too drawn out.
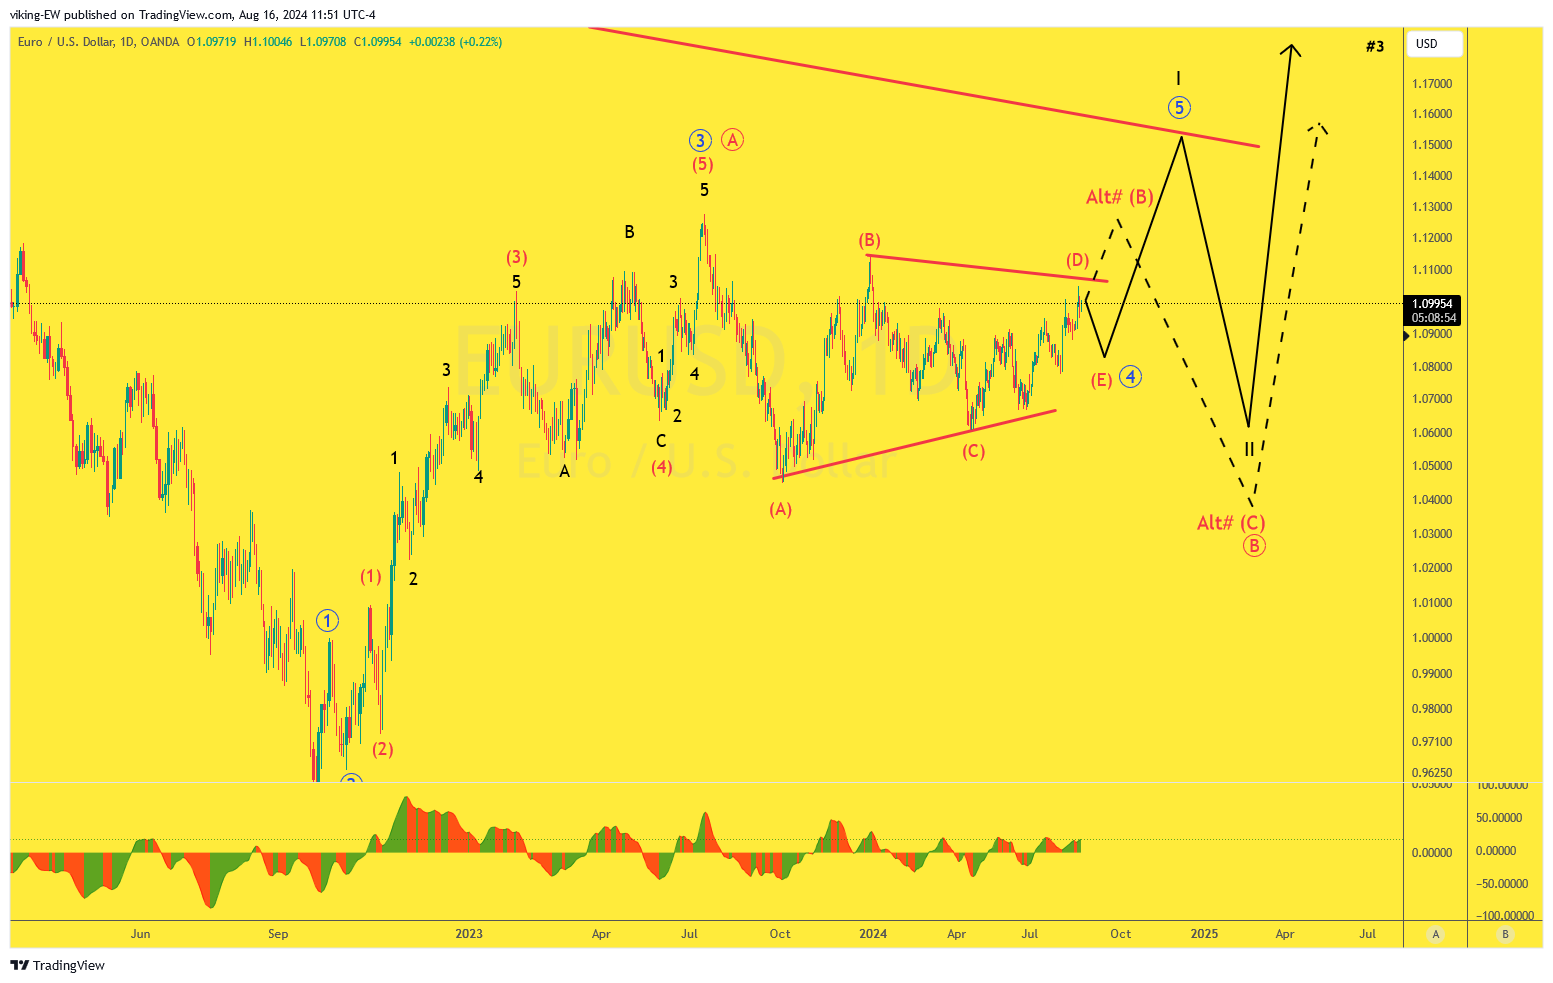
Therefore, I would like to see USD making a last push lower into wave (E) and then a strong move up, out of the triangle and tope somewhere between 1.15-1.18 before a deeper correction into wave II. However, I don’t pretend to know what will come next, today Euro is strong or USD weak but it may change tomorrow. I don’t like to chase it here.
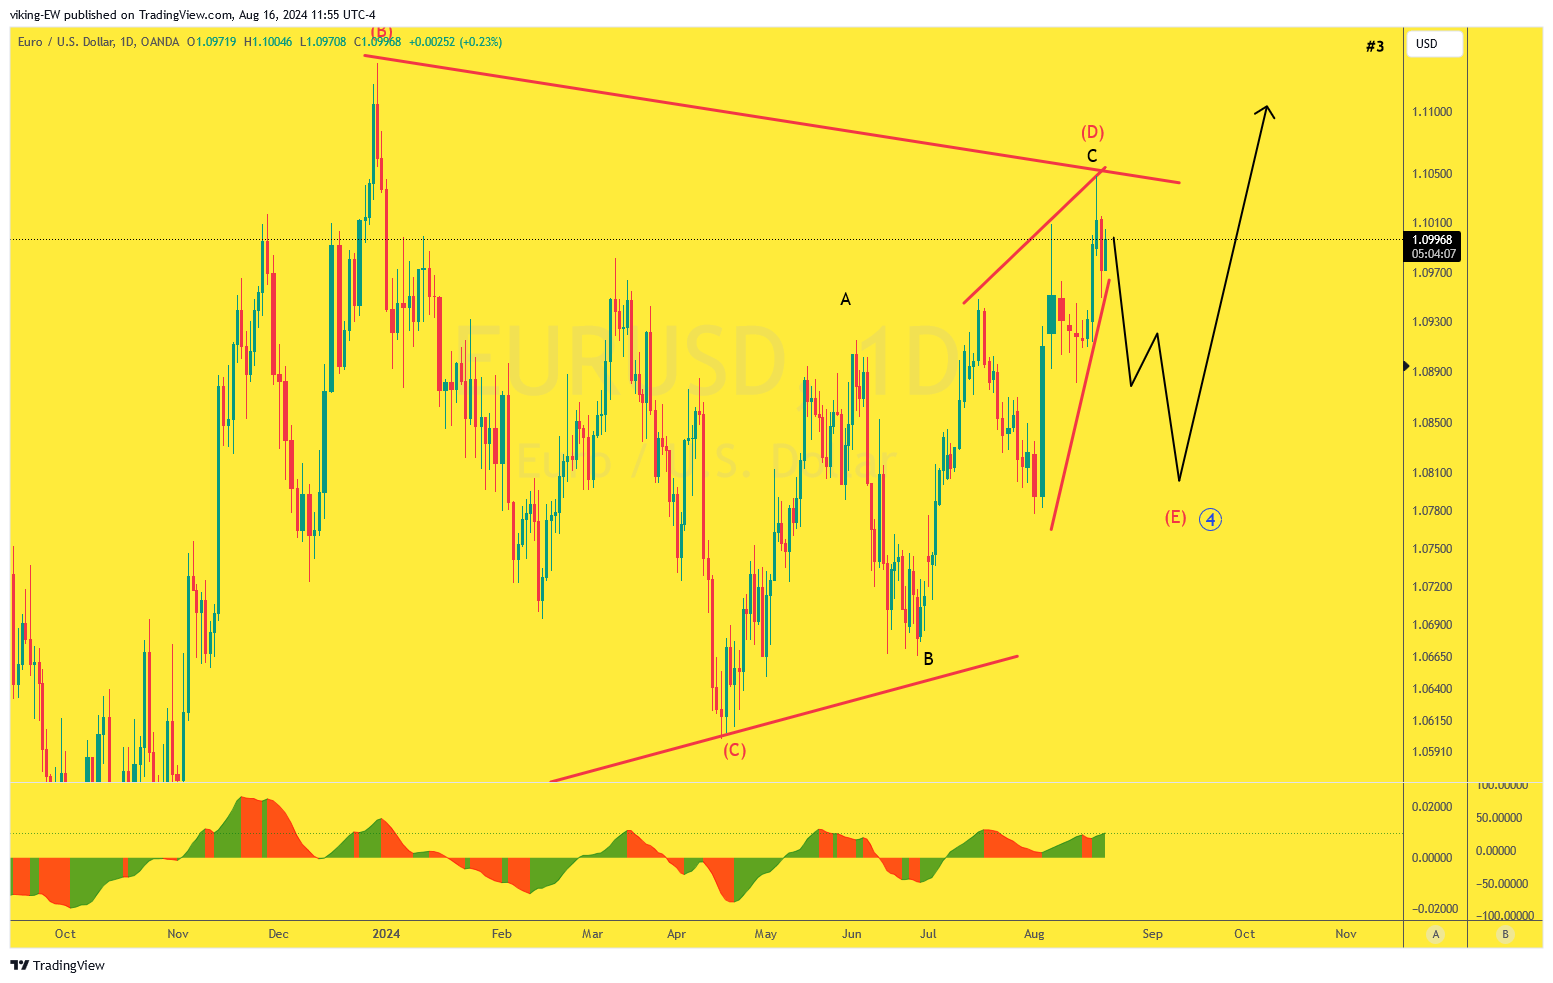
An extended move higher from here breaching 1.1140 could paradoxically enough mean we will only get a 3 waves structure, even if price move higher after the correction, but no 1.60, maybe 1.20/25 at best. I’ll keep track of lower time frames for any signals to post and update this bigger picture view as things transpire.