

Monthly Chart
Making a full count on a Monthly chart can be tricky because, where to start? My approach to this is that I first assume that over time all FX pairs move in a corrective swing pattern. So impulse are either wave A or C but which is which? Well, while B-waves many times can be tricky to count, they usually have a clear character making them stand out in their own way.
So if we know we have a B-wave it becomes quite easy to find A and C. Of course, it’s not always that easy in practice as it is to write it, e.g. we also have to deal with WXY combinations but you get the idea. At the end of the day, it’s usually possible to find both 2 and 3 different counts and then it comes down to which of them you feel most confident in, and how you grow that confidence.
EUR/AUD created a large triangle between 2000 and 2007 as the first (b)-wave on this chart and then there is that recovery between 2012 and 2020 that definitely isn’t an impulse, so that’s what I “hang” this count on and feel confident in being the best one.
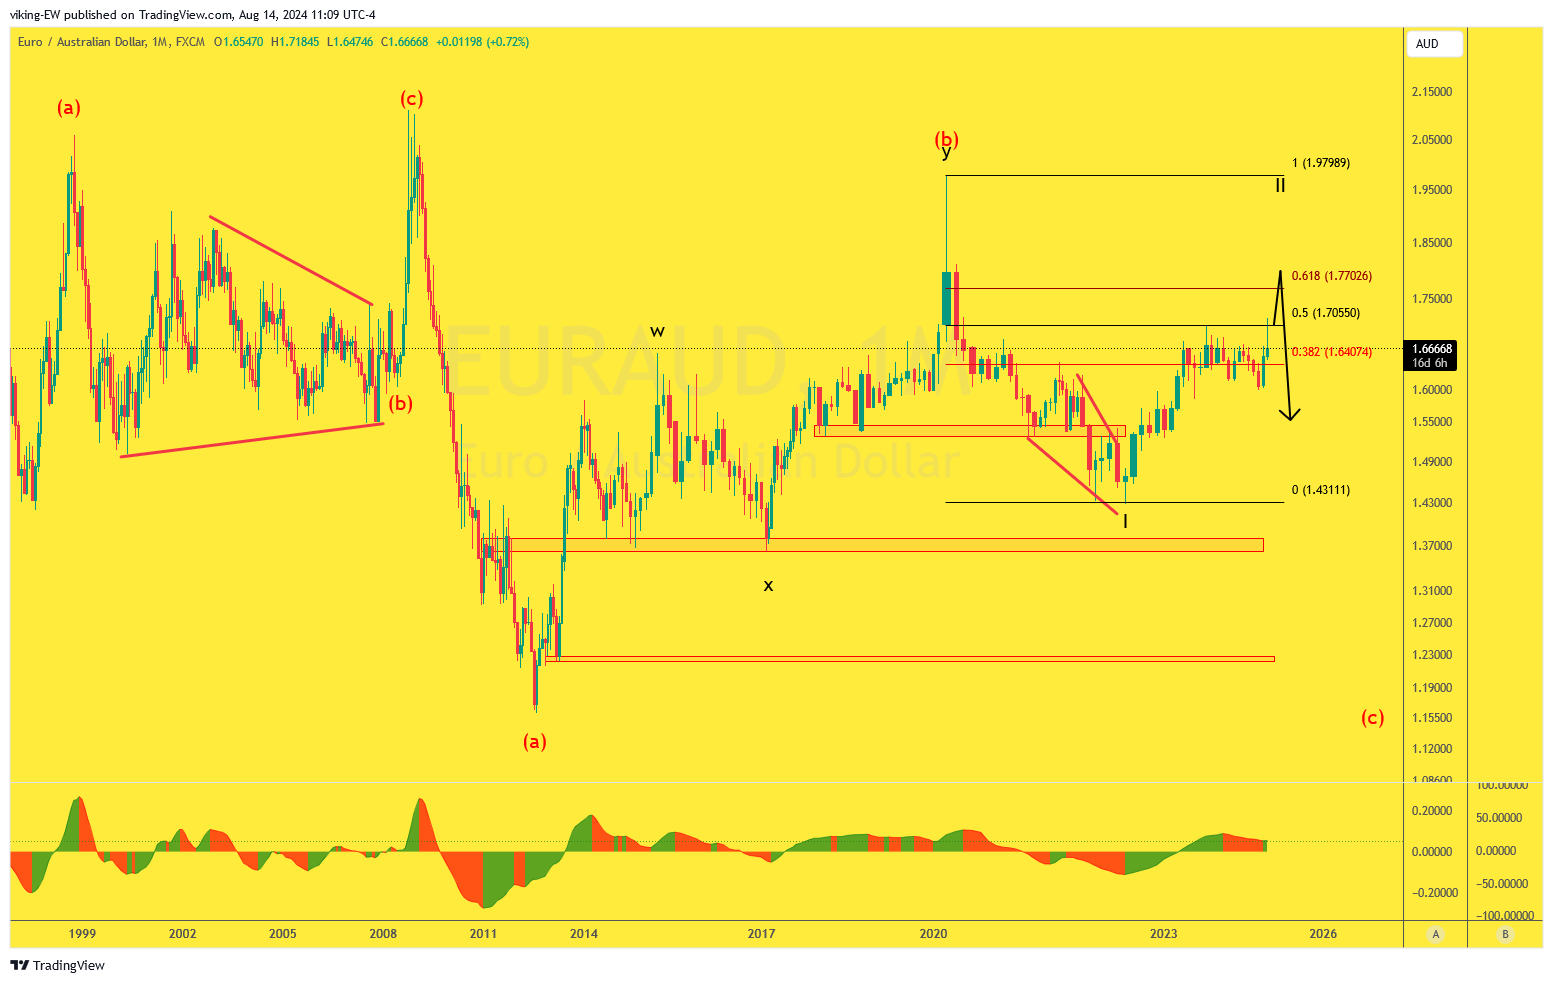
On this basis we are now in wave (c) down to somewhere in the area of the 2012 low, but it won’t be a strait journey, of course, as current the Euro is going strong in a bullish counter trend. However, in the larger picture this is still wave II or possibly another B wave at best. The latter would be true if the 2020 high is taken out.
As you see, there are never any guaranties – even if we are on the right count. Now you see the last candle with a very spiky pin and think that has to be bearish, right? Well, if that candle looks the same when the month closes out, yes that would be bearish but is it now? Not necessarily. In fact, it may lure in sellers feeding the bulls so they can push price higher. We simply have to wait for the candle to close before we can trade on it and that goes for any candle no matter time frame.
Weekly Chart
As usual, there is no really certain way to determine where price will go next but based on current price action and a good structural assessment; we can have a good understanding of where it may go with a certain probability. The weekly chart is a good base for this. After the first wave down from the last high, which I have counted as a Leading Diagonal here, we have a sharp correction back up.
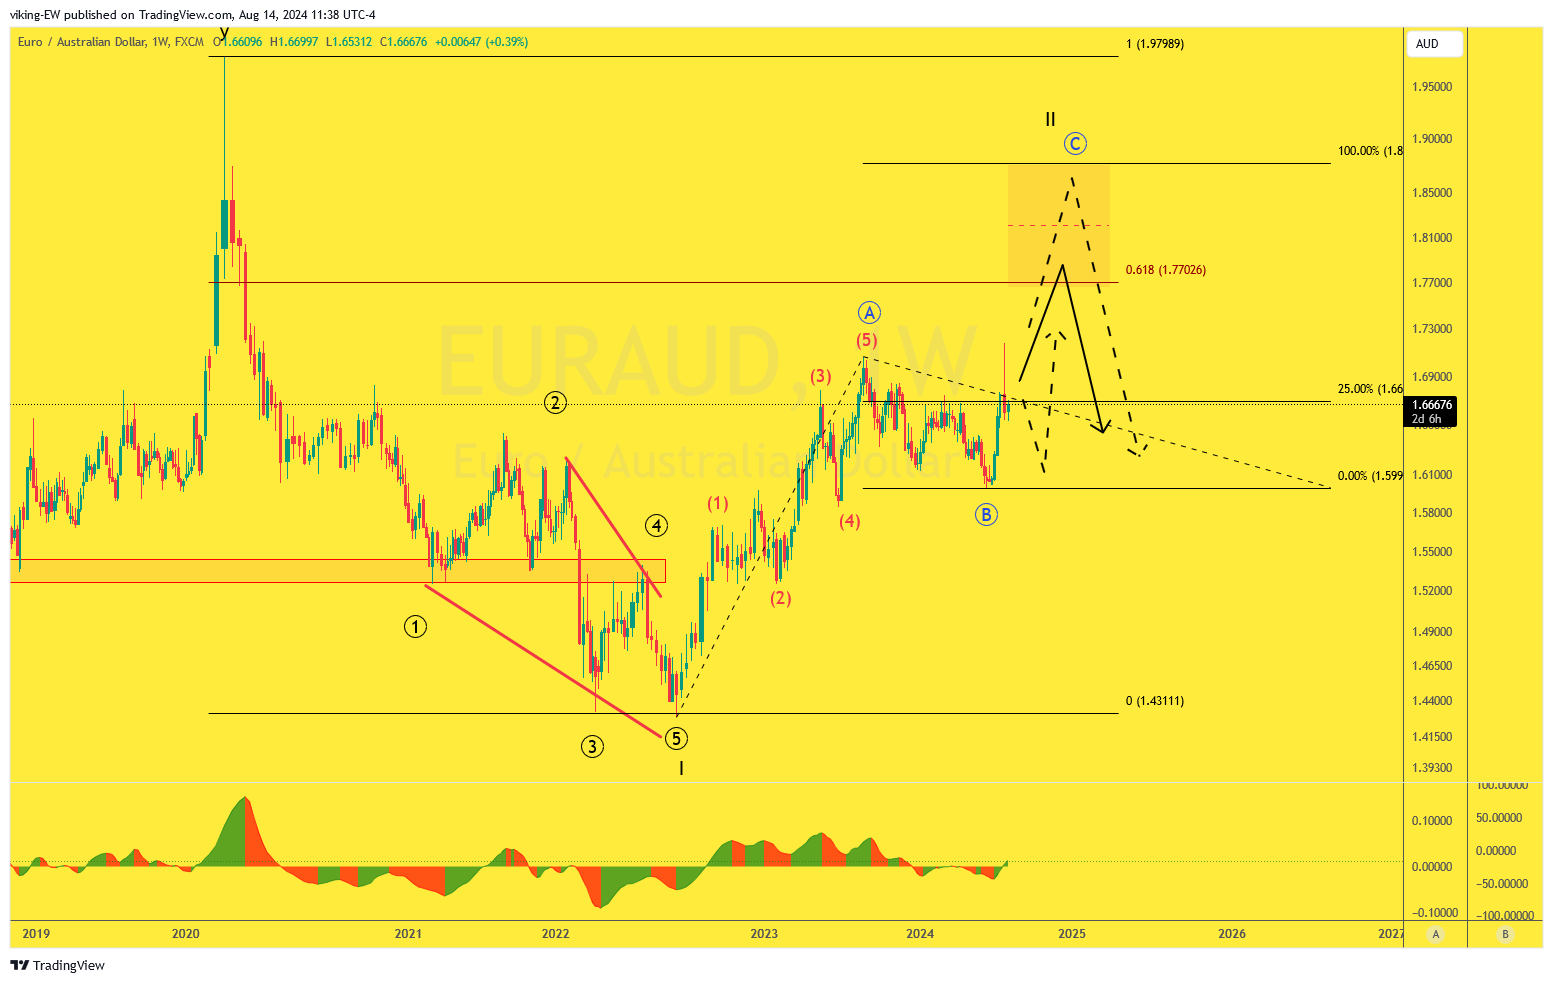
I can count that wave in 5 sub waves so looks like a completed wave A, which followed by what may be a completed wave B but that’s not a certainty just yet. This is what’s going on inside of that spiky Monthly candle I mentioned before. We don’t need to recover the full pin of the candle, but a close above wave (5) of A @ 1.70657 would confirm B for me.
In addition, we need to visit lower time frames, starting with Daily, to spot if we get any 5 waves sequences there. That is also needed or we are still correcting in wave B. Before I do that, let’s have a look at our target zone for wave II, it’s pretty wide. It’s logical, though, as it’s between the 61.8 Fib of wave I and the assumption that wave C or II may be of the same length as wave A, approximately – which is quite common.
Daily Chart
The Daily wave up from the 26 June low is very steep but it can indeed be counted in 5 wave and yes, it has a very pointy pin at the top. The following drop back lower is thus just expected and question now is if this correction has competed? At a first glance it looks as if it’s only one wave (and we want 3) but at a closer look we a think tail below a small head, before price went higher again.
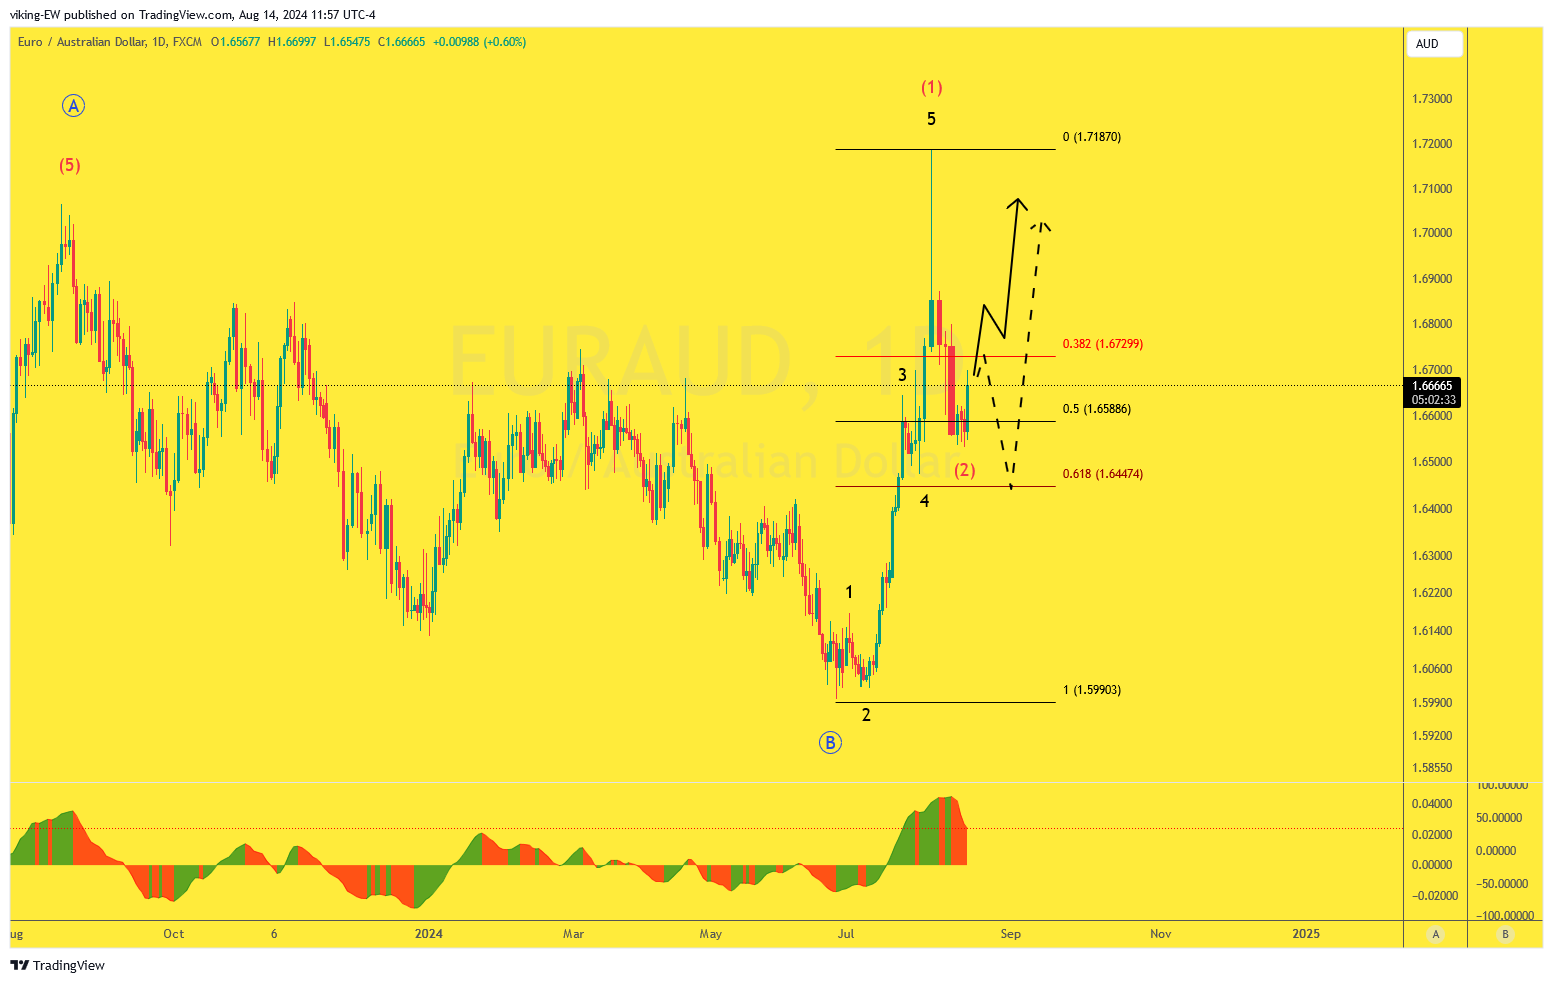
Taking into account that we have corrected >50% I judge it as possible, even if 61.8% is ideal for a wave 2. So what’s next? To gather more info on lower time frame, although I won’t do this here as I only go there when I like to find a trade setup and that falls outside of this post. At the same time, that big red candle tell us all we need to know. Price has to climb back above it to show it has what it takes.
If/when I find a trade setup I may post that separately, this is just meant as a basic analysis.