

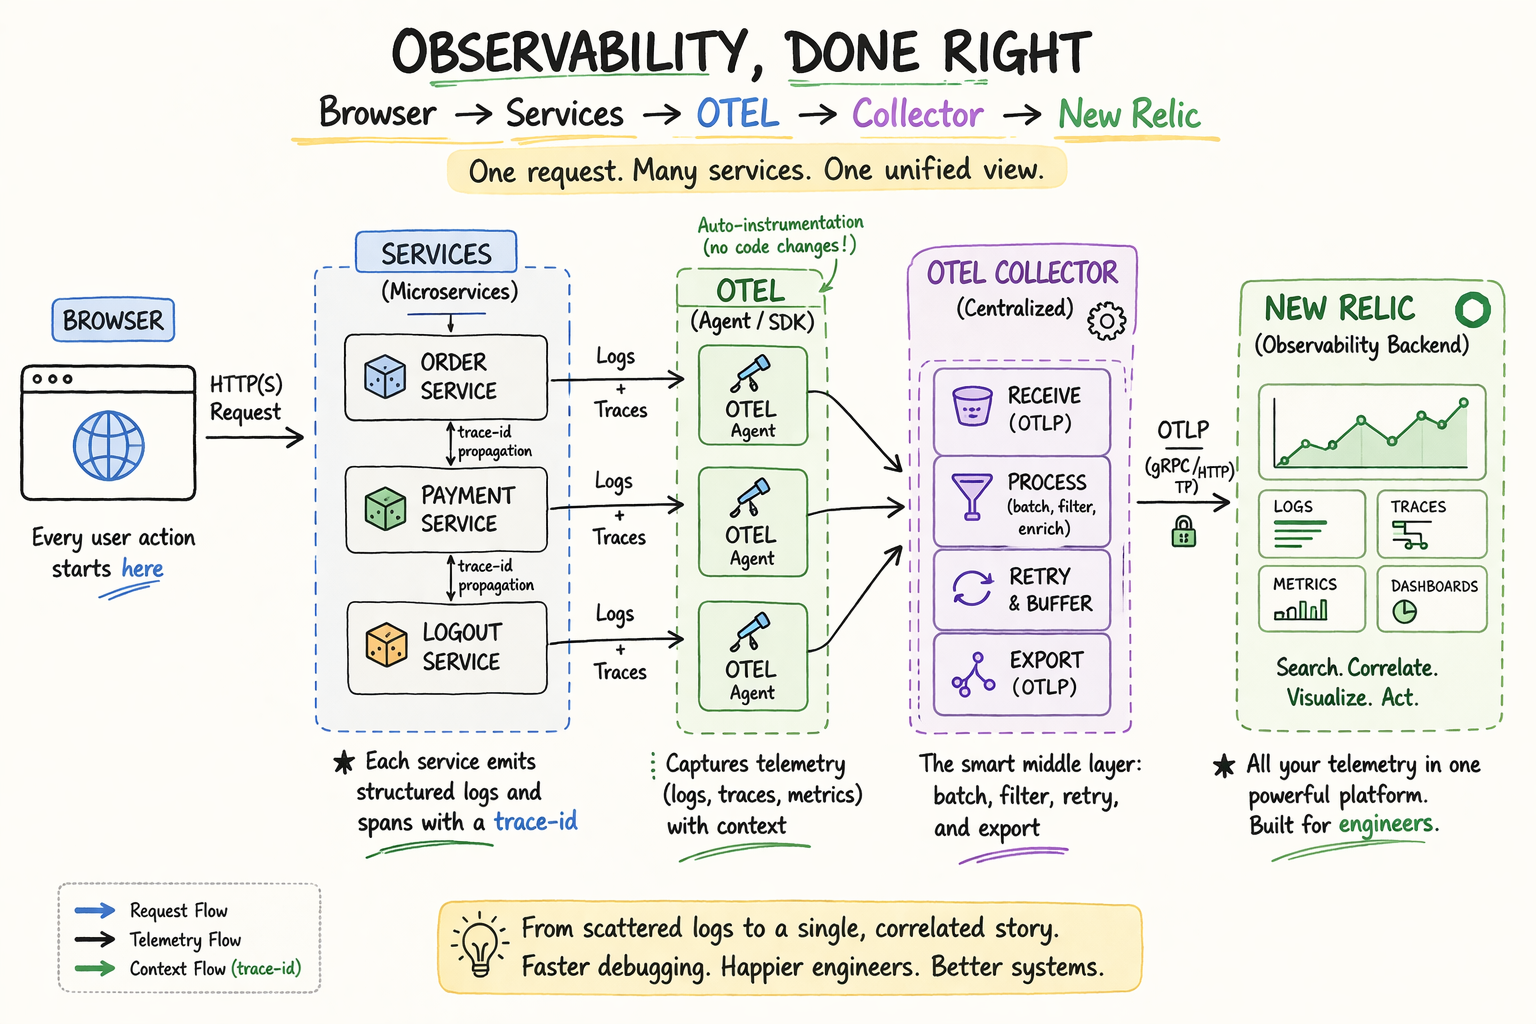
Observability as a System, Not a Feature
In modern distributed architectures, observability is not an auxiliary concern but a foundational system capability. Traditional logging approaches—where individual services emit unstructured logs—fail to provide meaningful insights when requests traverse multiple services. As systems grow in complexity, debugging requires not just data, but correlated, structured, and centralized telemetry. Observability therefore evolves from simple logging into a designed pipeline that captures, processes, and presents system behavior in a coherent and queryable form.
The Role of Microservices in Fragmenting Visibility
Microservices architectures inherently distribute computation across independently deployed services such as Order, Payment, and Logout. While this separation improves scalability and maintainability, it fragments visibility. A single user request may span multiple services, each generating its own logs in isolation. Without a shared context—such as a trace identifier—these logs remain disconnected, making it difficult to reconstruct the lifecycle of a request. This fragmentation is the fundamental challenge that modern observability systems must solve.
Structured Logging as the Foundation of Correlation
To address fragmentation, services must emit structured logs, typically in JSON format, enriched with metadata such as timestamps, service names, and trace identifiers. Unlike unstructured text logs, structured logs enable downstream systems to parse, index, and correlate events efficiently. The inclusion of trace IDs ensures that logs generated across different services can be tied back to a single request, forming the basis for distributed tracing and cross-service debugging.
OpenTelemetry as the Instrumentation Layer
OpenTelemetry serves as the standard framework for generating telemetry data within services. It provides consistent APIs and agents to produce logs, metrics, and traces. In practice, OpenTelemetry can be integrated either through manual instrumentation—where developers explicitly create spans—or through automatic instrumentation using agents that capture telemetry without code changes. This abstraction standardizes how telemetry is produced, ensuring compatibility across different services and programming languages.
The OpenTelemetry Collector as a Centralized Processing Layer
The OpenTelemetry Collector operates as an intermediary layer between application services and observability backends. Rather than sending telemetry directly from each service to a backend, services forward their data to the collector. The collector performs critical functions such as batching, filtering, enrichment, and protocol translation. By centralizing these concerns, the collector reduces load on application services and provides a flexible control point for managing telemetry flow at scale.
New Relic as the Observability Backend
New Relic acts as the destination where telemetry data is stored, indexed, and visualized. Unlike self-hosted tools, New Relic provides a managed environment that integrates logs, metrics, and traces into a unified interface. This allows engineers to query logs, analyze performance metrics, and visualize distributed traces within a single platform. The backend transforms raw telemetry into actionable insights, enabling faster diagnosis and system understanding.
End-to-End Telemetry Flow Across Services
In a typical request lifecycle, a user interaction initiates a request in the Order Service, which generates a trace ID and emits structured logs. As the request propagates to the Payment and Logout services, the trace context is preserved, ensuring continuity across service boundaries. Each service emits telemetry that is forwarded to the OpenTelemetry Collector. The collector processes this data and exports it to New Relic using standardized protocols such as OTLP. The result is a unified trace that represents the complete journey of the request.
Decoupling Observability from Application Logic
A key architectural principle in this design is the decoupling of observability concerns from business logic. By using OpenTelemetry agents and a centralized collector, application code remains focused on domain functionality while telemetry generation and processing are handled externally. This separation improves maintainability and allows observability strategies to evolve independently of application deployments. It also enables consistent instrumentation across heterogeneous services without requiring intrusive code changes.
Scalability and Resilience in Telemetry Pipelines
As systems scale, the volume of telemetry data increases significantly. The OpenTelemetry Collector plays a critical role in maintaining system resilience by implementing batching, retry mechanisms, and load balancing. It can also route data to multiple backends or apply sampling strategies to reduce data volume. These capabilities ensure that the observability pipeline remains performant and reliable, even under high load conditions.
From Debugging to System Understanding
The ultimate goal of this architecture is not merely to debug failures, but to enable a deeper understanding of system behavior. By correlating logs, traces, and metrics, engineers gain visibility into latency patterns, failure points, and service dependencies. Observability shifts the mindset from reactive troubleshooting to proactive system analysis, allowing teams to identify issues before they impact users and to continuously improve system performance.
Subscribe for more.