ES-
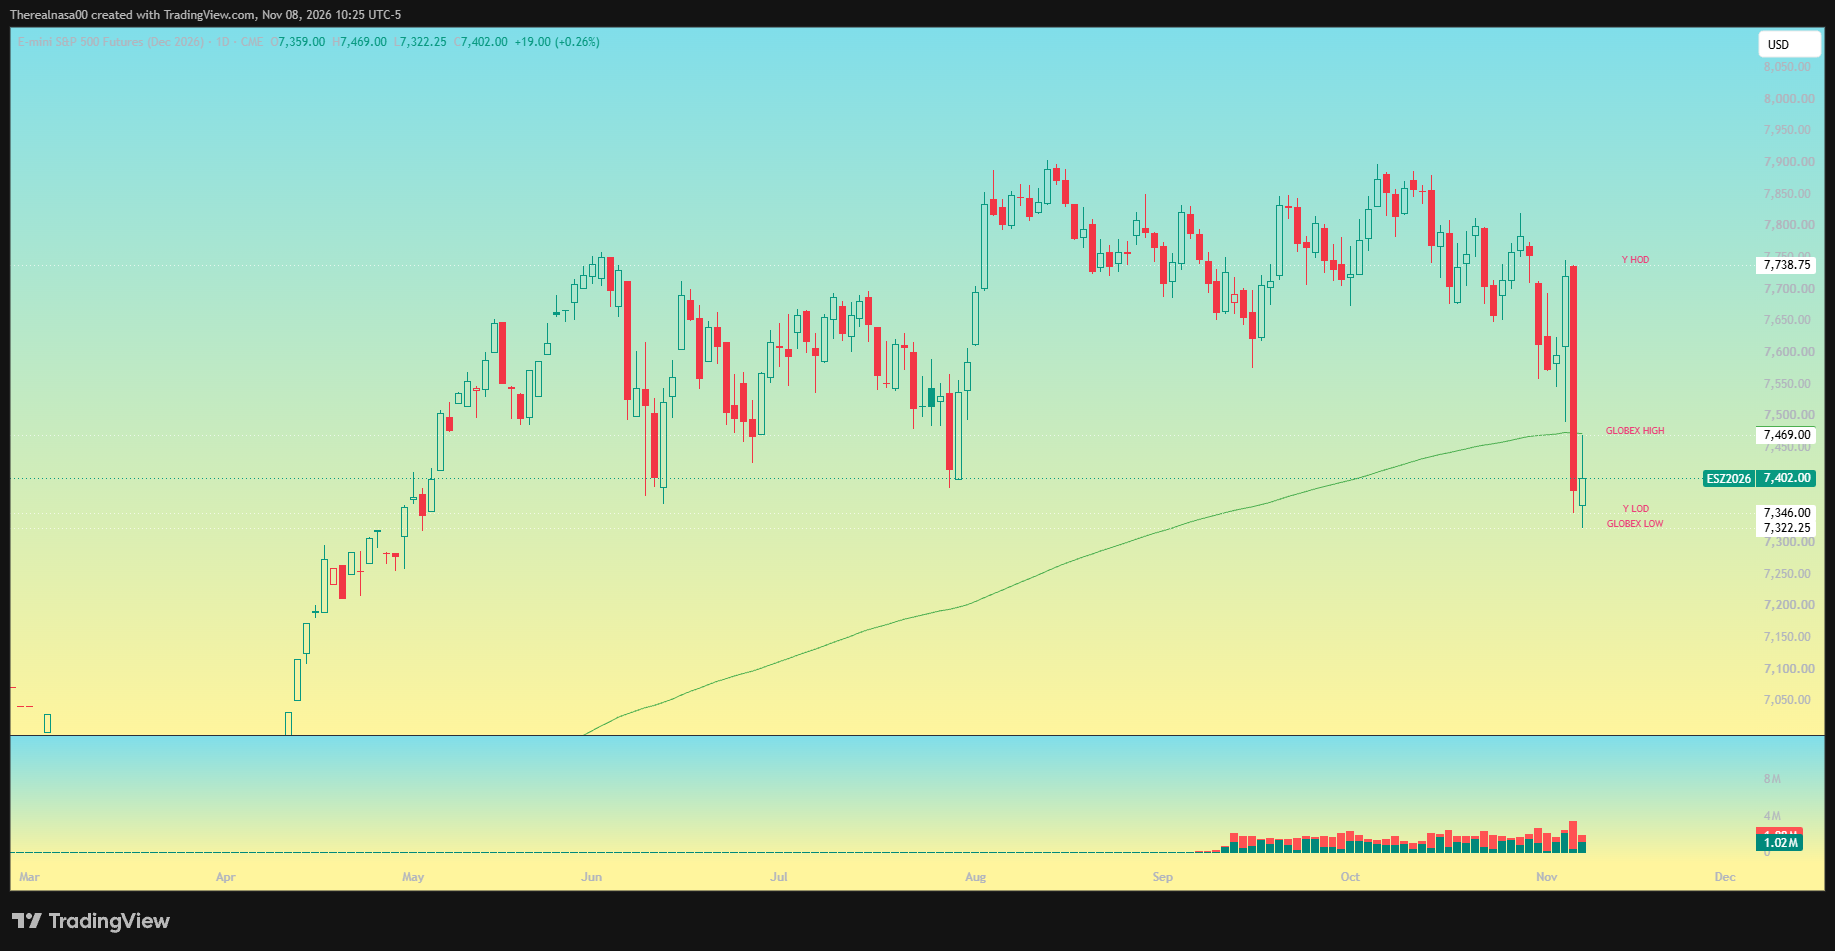
SUPPORTS= 7385(JULY LOW)-7360(JUNE LOW)-7346-7322
RES= 7426-7450-7470-7492(MIDTERM LOW)
NQ-
SUPPORTS= 27093-26944-26820-26730
RES= 27294-27425-27500
SPY(FOR THE WEEK)-
SUPPORTS= 733.50(200 DAY)-LWL-728.09-724.89(MAY GAP)-720
RES= 737.99-740-742.38-746.88-749.68
ASSUMPTIONS=
PIVOT 7426
BABA:
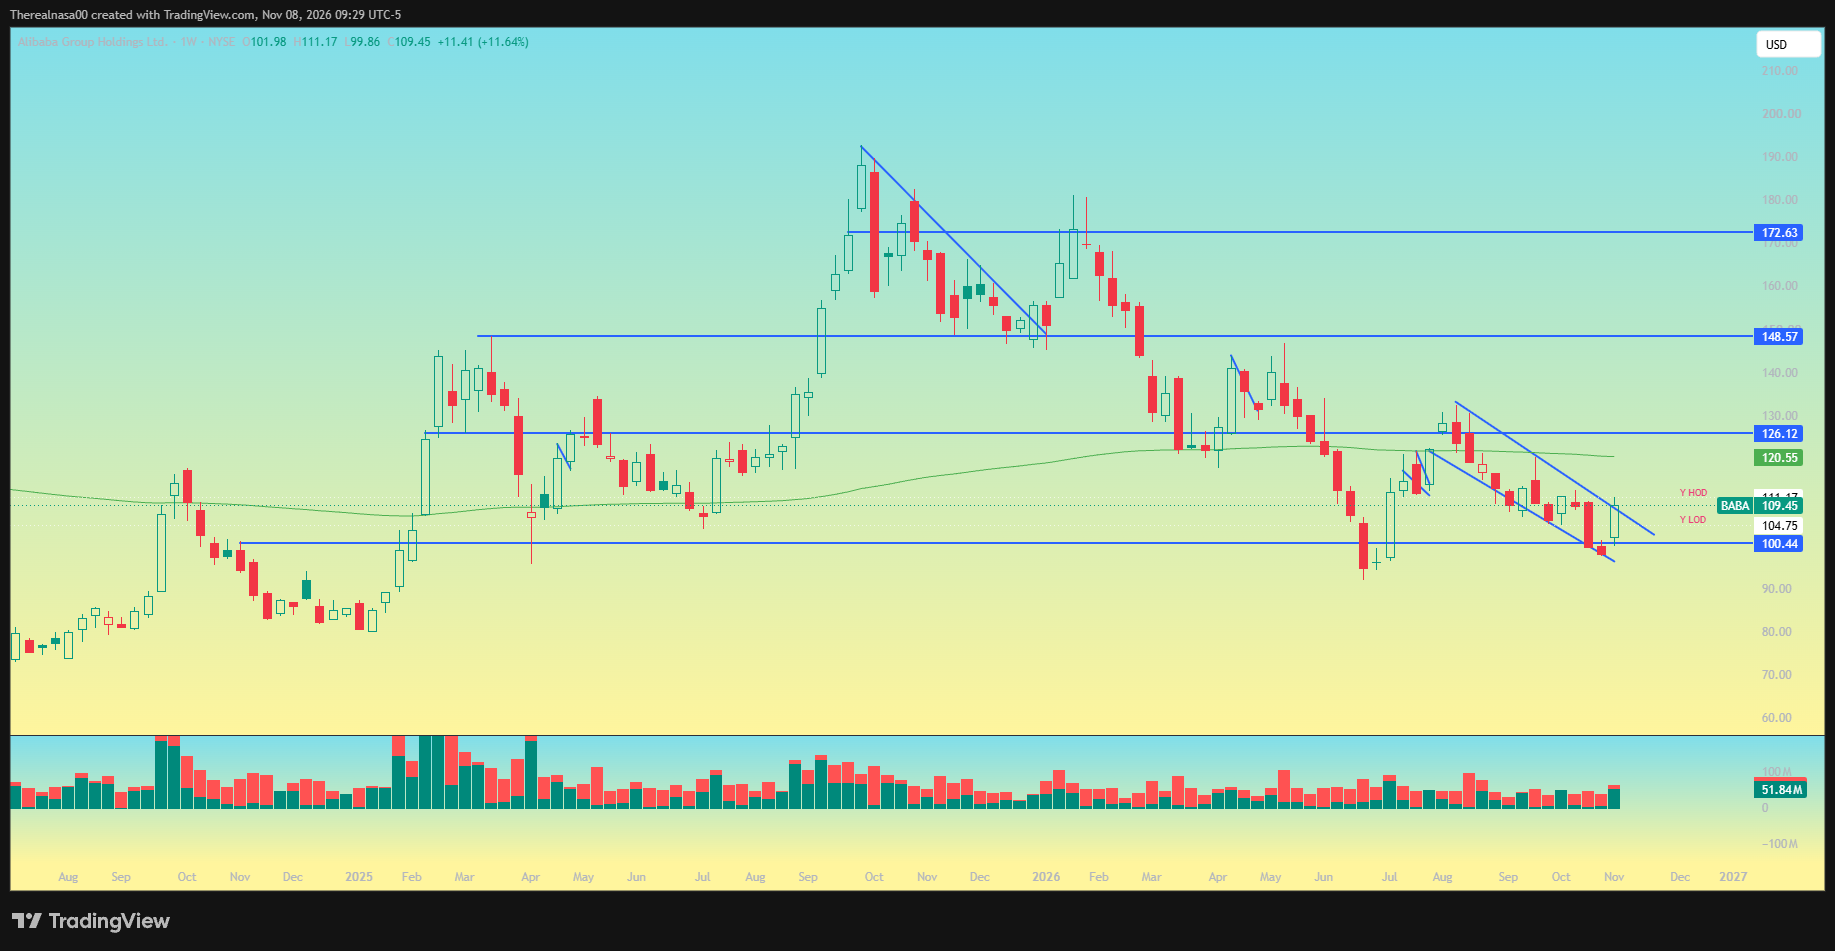
Still a top watch for me heading into this week. The weekly wedge remains valid, and although BABA closed Friday just below 110, it finished the week green while the rest of the market got smashed lower. That relative strength is what stands out to me here.
The thesis is that regulatory fears surrounding a potential Dem sweep and increased restrictions on data centers in the US could theoretically benefit China names. China may not face the same regulatory hurdles as US companies, potentially allowing its companies to capture more of the opportunity. If data center fears continue weighing on US names, I would assume BABA and other China stocks could continue to show relative strength.
110 is the key pivot. If we can break above it, I think there is room for a move back into 115 to 120, with the 200day sitting above.
If I do trade this, I would look at the November 20 OPEX 120C around $1.00 in premium, using 110 as the pivot and 104.75 as the line in the sand.
Again, China is always a difficult swing trade, but the thesis makes sense to me if US stocks continue dealing with regulatory uncertainty while China names potentially benefit from it.
RBLX:
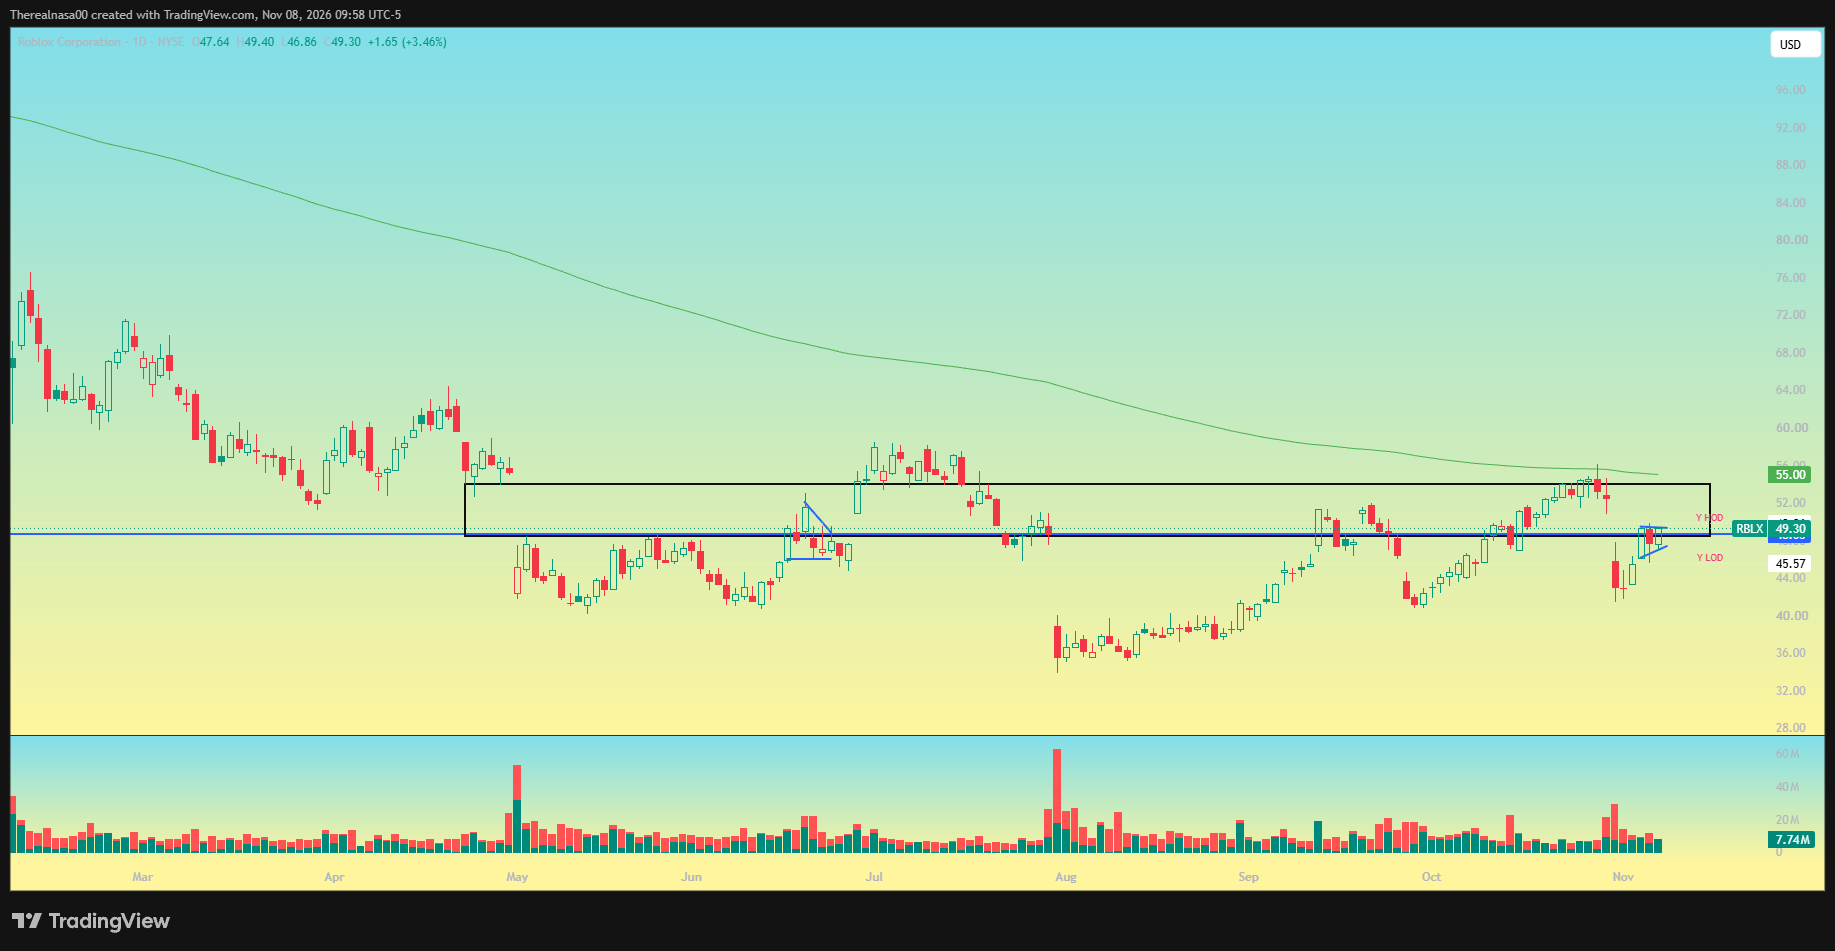
A name that has fallen from greatness for several reasons, but after last week's nasty earnings reaction, it managed to close green this week and push right back into the May gap.
The idea here is straightforward for a two way trade IMO: trade it against the 50 level.
This week's high was 50, making that the key pivot. If it can reclaim 50, there is not much resistance until 52 to 55, which would put the May gap fill into play. The call side is actually seeing some activity, with the 51C, 54C, and 56C all seeing over 1K volume on Friday. Meanwhile, the put side remains relatively quiet.
If it can reclaim 50, I think the 55C could come into play here personally.
However, if 50 rejects and the market continues to struggle, invalidating the bull flag, the 45P targeting a move back toward Thursday's lows could be a layup here.
NOTE=
WHAT A WEEK: THE MIDTERM SELLOFF
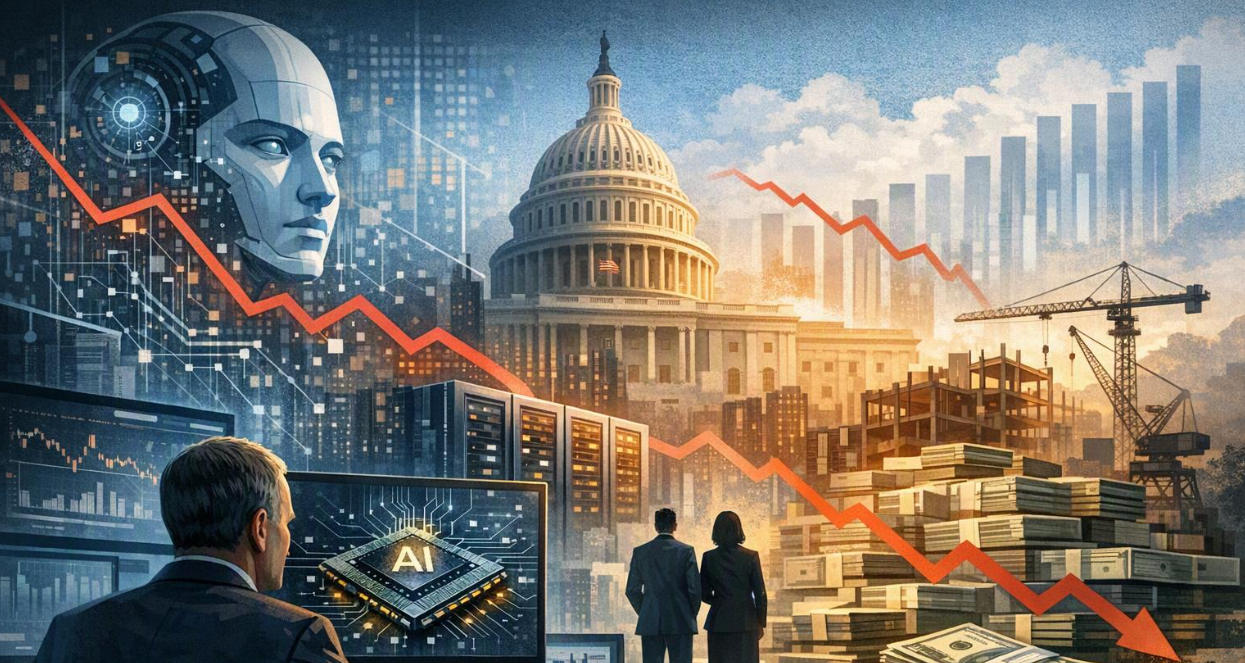
Well, what a week that was. The markets sold hard after the midterm results, and the main driver was the AI and tech trade unwinding. Many priced in the Democratic win as bad for data centers and everything tied to AI.
Truthfully, it makes sense. But the selloff was harsh. It looks like an exaggerated move on something that has not happened yet. No new bills have passed. The selling came from the idea that with Dems controlling the House and the Senate, they can now put harsher regulation in place on AI and data center buildouts.
The damage:
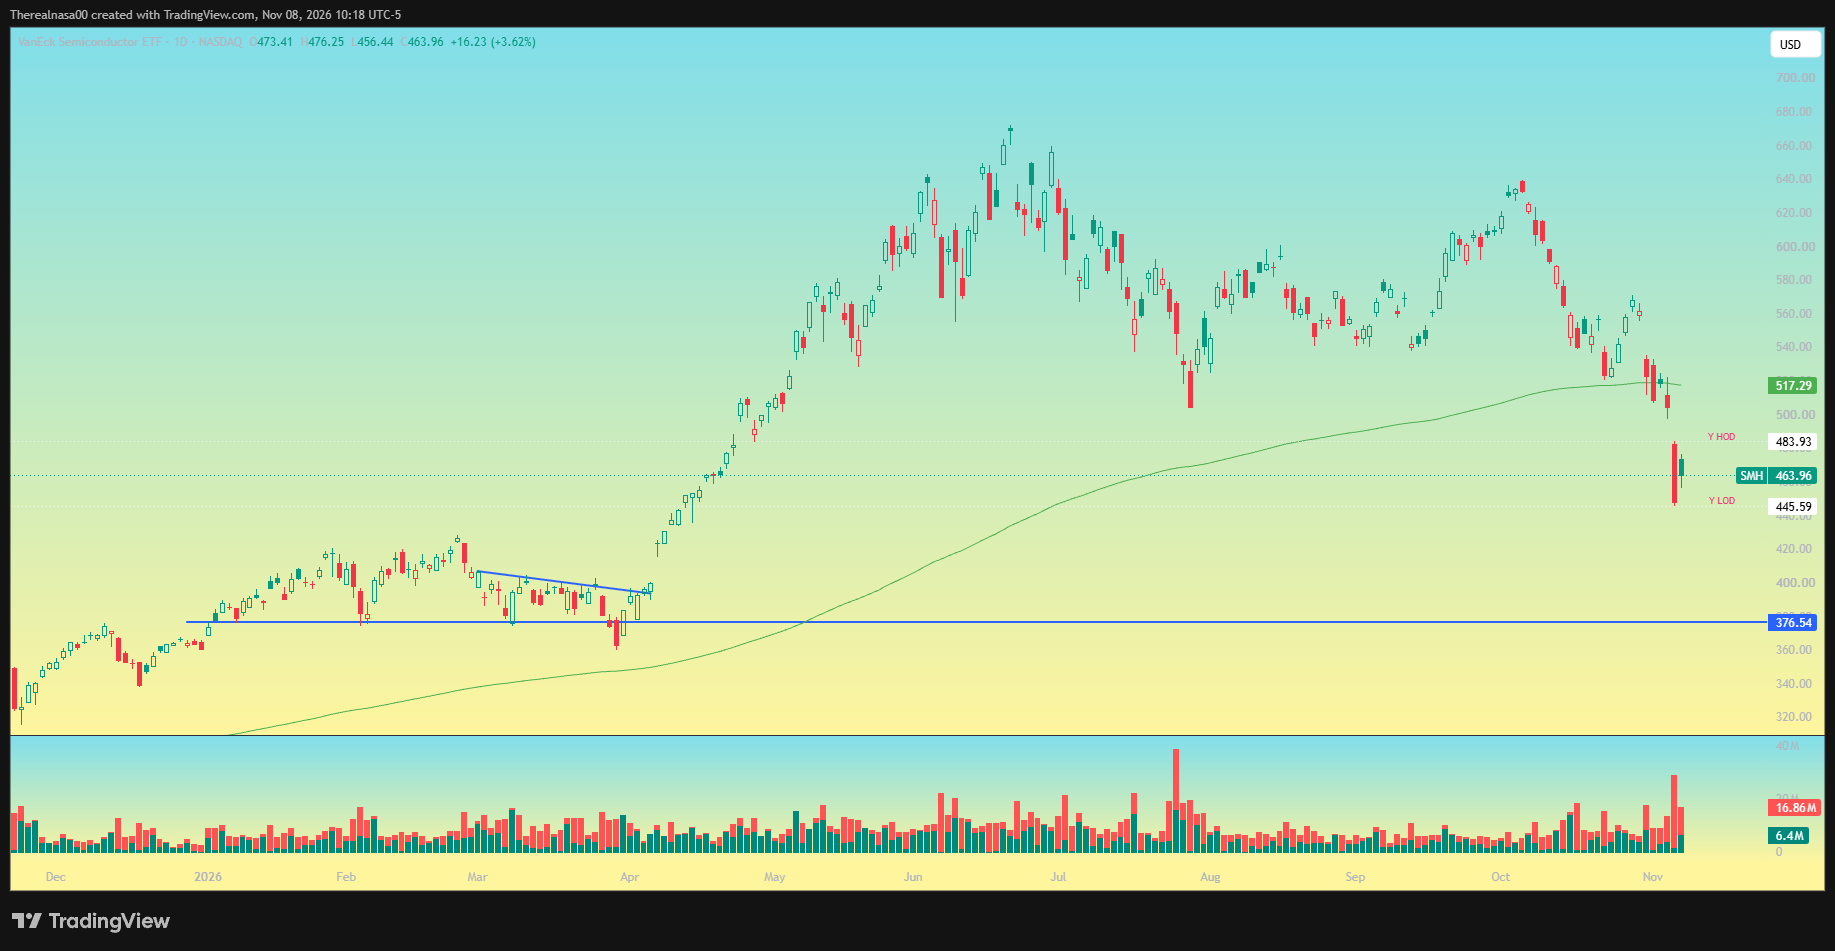
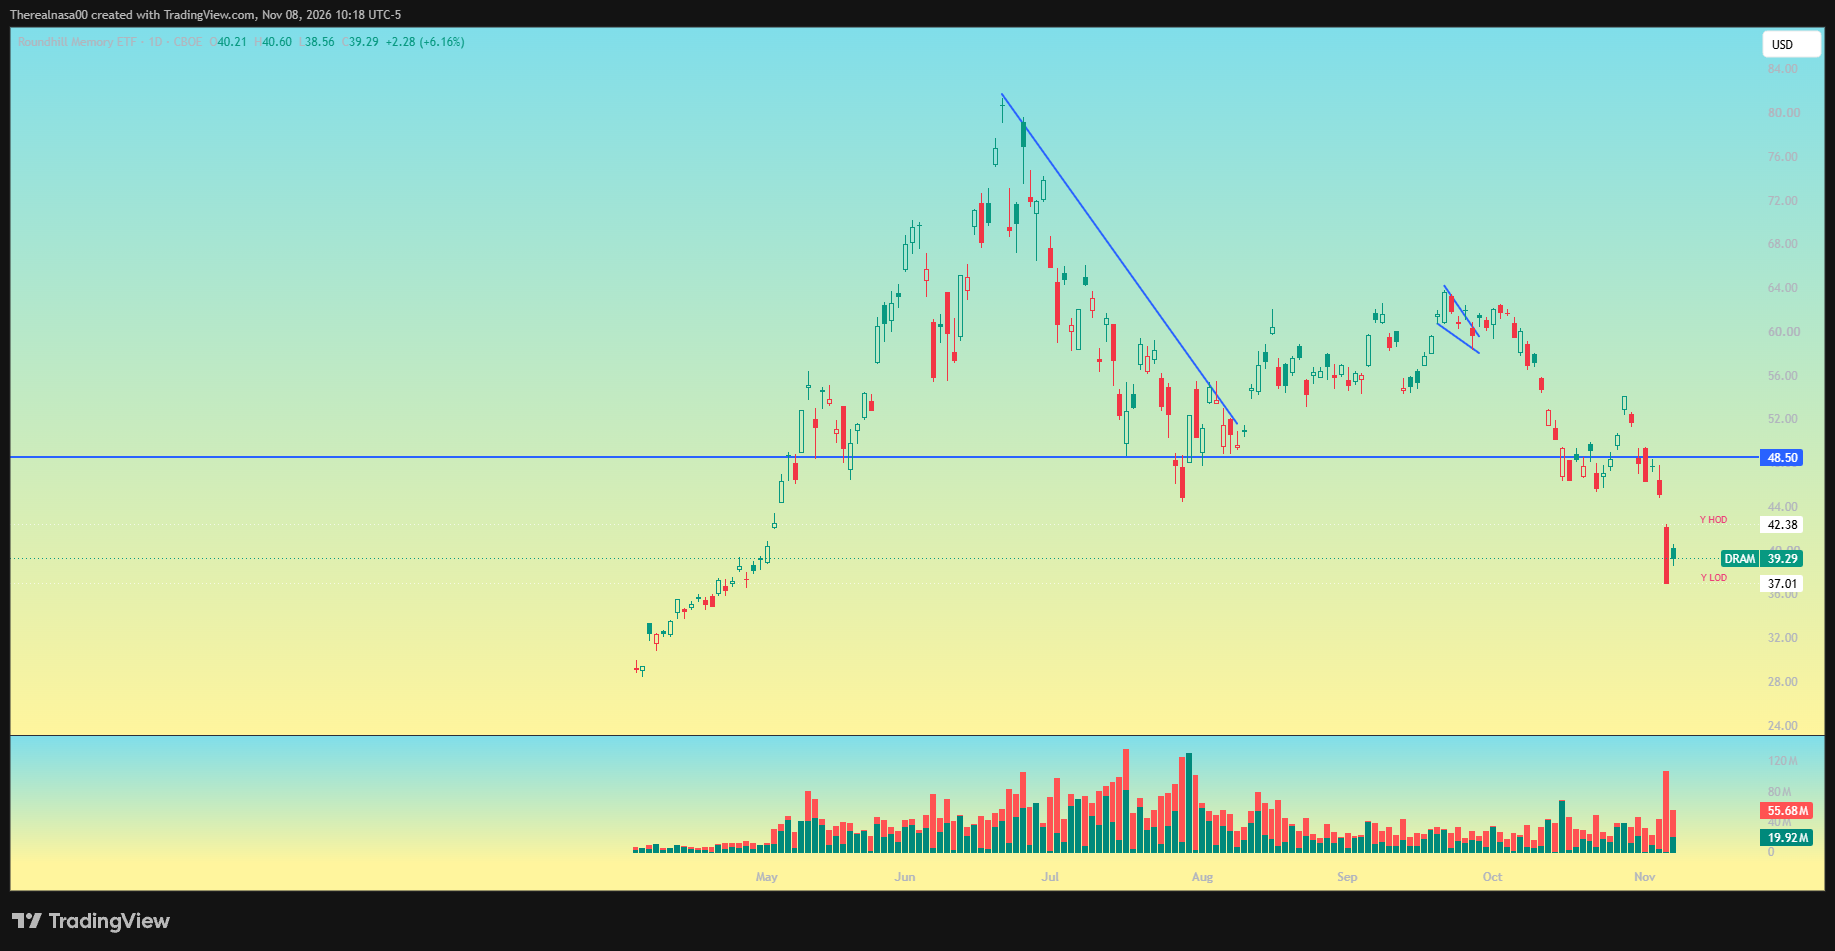
• Memory names sold 20%
• Chip names sold 10 to 20%
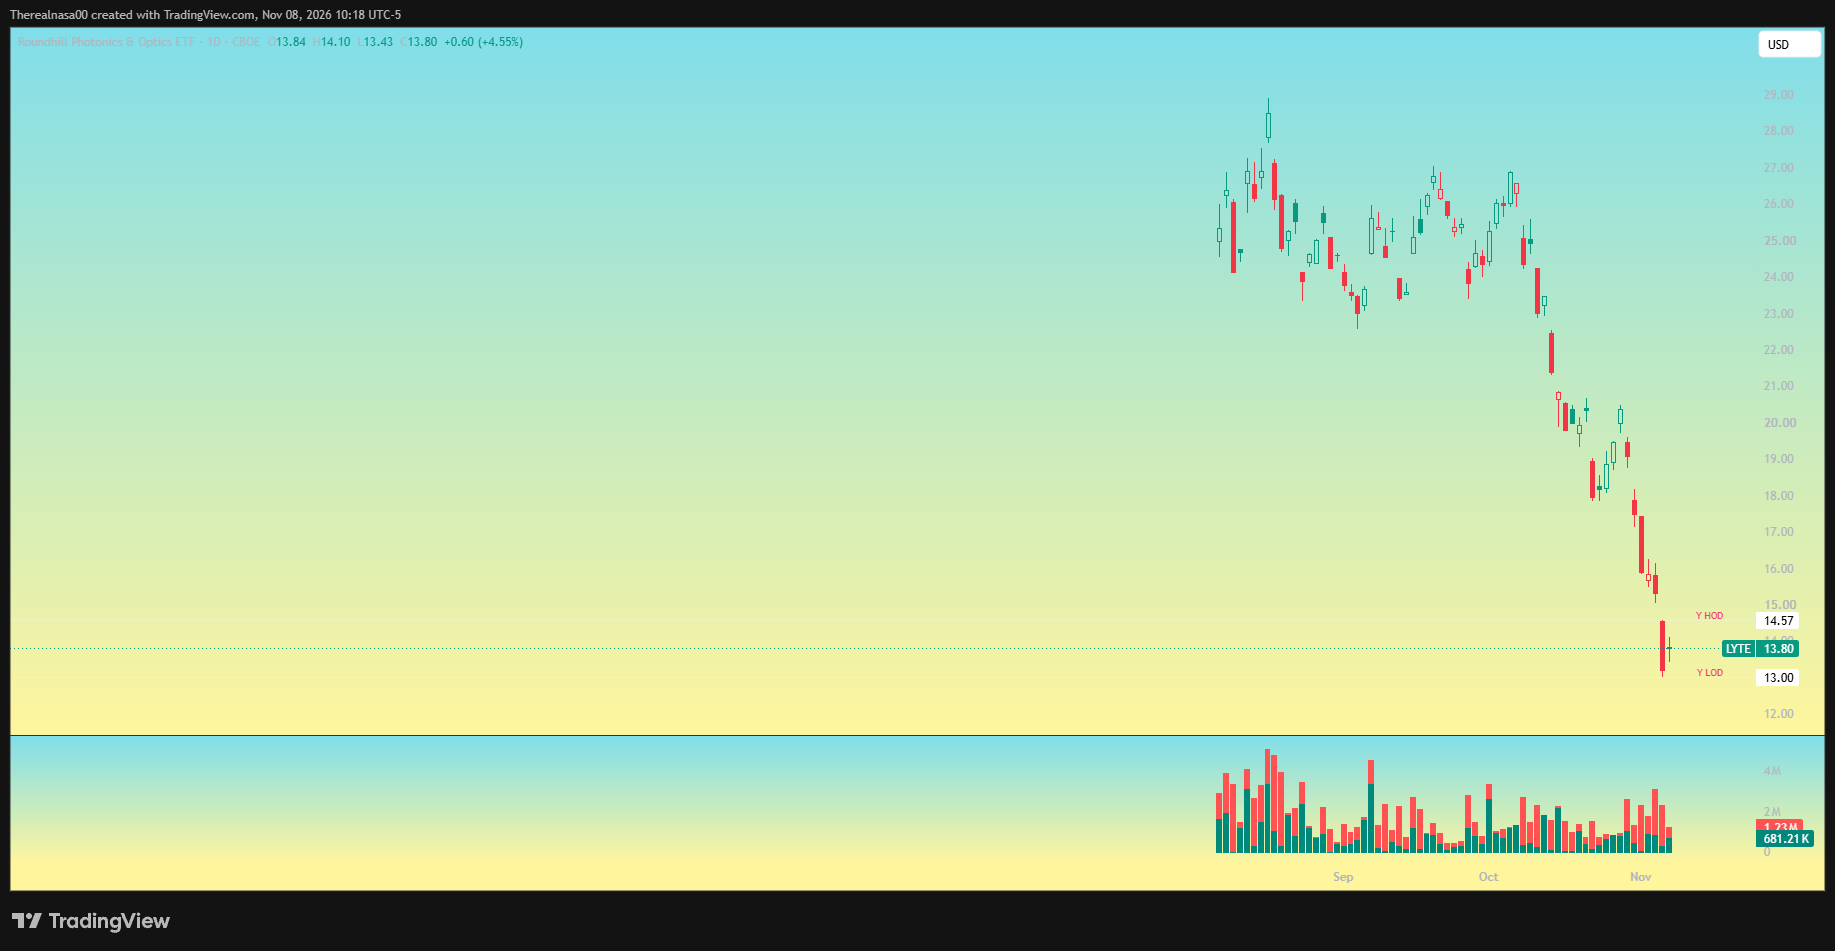
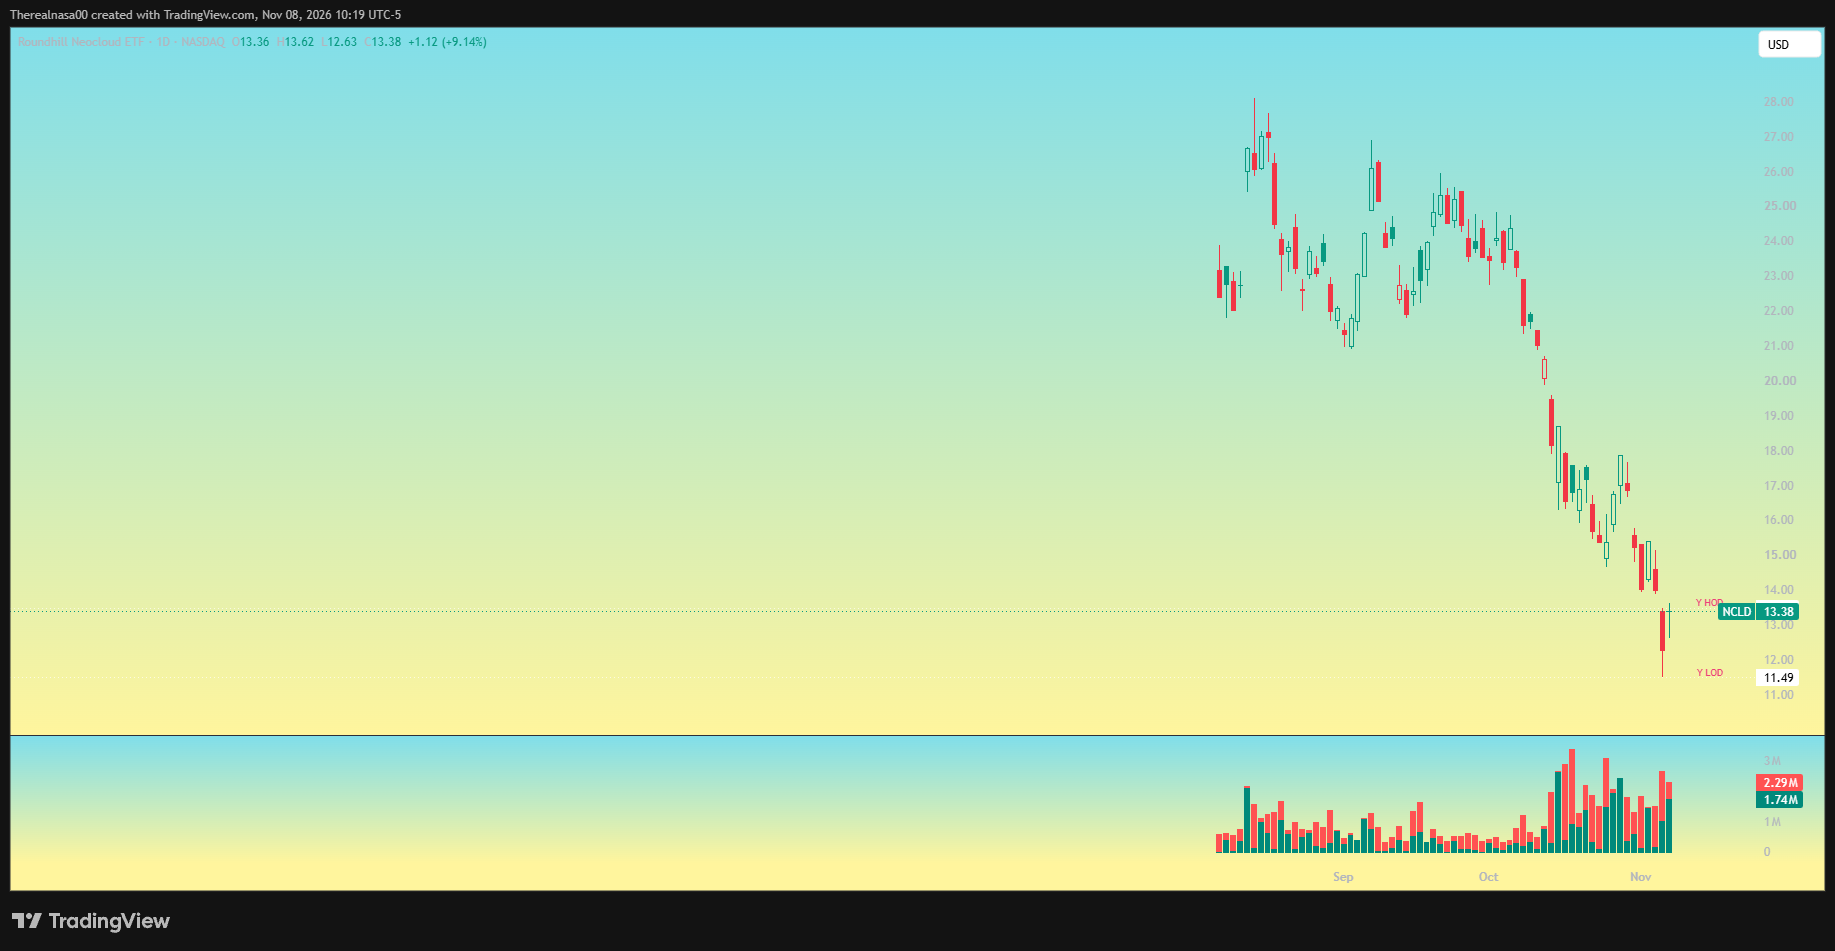
• Every bottleneck name, including power, sold 10 to 20%
Everything tied to the bottleneck and AI trade got slaughtered. The same trade that took you higher for the last 3 to 5 years is what took you down this week. One thing to note or ponder; in theory if regulation does occur is that good for power names like vst , ceg , and others as supply is now less but demand remains true ? Also how do SaaS names react if issues in ai buildout is it opposite of earlier Saaspocalypses this year , and does the pair trade of igv vs smh remain true ? One other note or interesting thing here ; if regulation does occur how does it effect the names already up and running or as supply is now down and demand remains unchanged ? In theory that would be good for the names already in the game and something to watch out for here with names like crwv , vst , dlr , eqix and others etc.
MY TAKE
My issue is that a lot of this prices in something that could happen but hasn't. Does it make sense that fear came in and we sold off on a Democratic sweep? Yes. The question now is whether these names have already taken their haircut or still have a lot more fat to trim.
In my mind, nothing has changed except that the House and Senate flipped. I somewhat disagree with the selling in some of these names. You're selling on policy that hasn't shifted, only the idea that it will. That idea is valid, and uncertainty is always hard on markets. That's a tale as old as time.
BY THE NUMBERS
SPX
• Thursday was the 36th worst SPX day of 9,280 trading days since 1990
• Only 46 days in 36 years have closed down 4% or more
• Worst day since Apr 4, 2025 (down 5.97%)
• The week ranks in the worst 7.4% of all weeks since 1990
QQQ
• Thursday down 6.49%, the 24th worst QQQ day ever (of 6,959 since 1999)
• 4th worst since 2020, worse than Apr 4, 2025 (down 6.21%). Only three days in March 2020 beat it
VIX (the wildest of the three)
• Thursday +69.7% (16.61 to 28.18), the 3rd biggest single day VIX jump in history
• Only Feb 5, 2018 Volmageddon (+115.6%) and Dec 18, 2024 (+74.0%) were bigger
• Ahead of Aug 5, 2024 (+64.9%)
These reactions were extreme. It looks like a lot of unwinding, and the net negative gamma environment helped push things lower as selling led to more selling and acceleration.
Was it a harsh reaction? Yes. Does some of it make sense? Yes. Do earnings still support a lot of these names and multiples? Yes. But it was a disgusting week.
THE 2023 ANALOG IS STILL IN PLAY
In 2023 you had a change in policy and you didn't sell off right away. After the FOMC meeting and policy change, you sold September through November, then got your December Santa rally. In my mind that thesis and analog is still live until November ends with no bids in sight.
Friday looked like a dead cat bounce across the board. But remember, every time this year we've had a massive 5 to 8% selloff in the indexes, it was followed by almost historic moves. Earlier this year QQQ sold 7 or 8%, it was "so over," and then the next 13 days were green and up and to the right, nearly matching the historical 14 day record. This market has been extreme in both directions: extreme bounces and extreme selloffs.
RATES AND THE FED
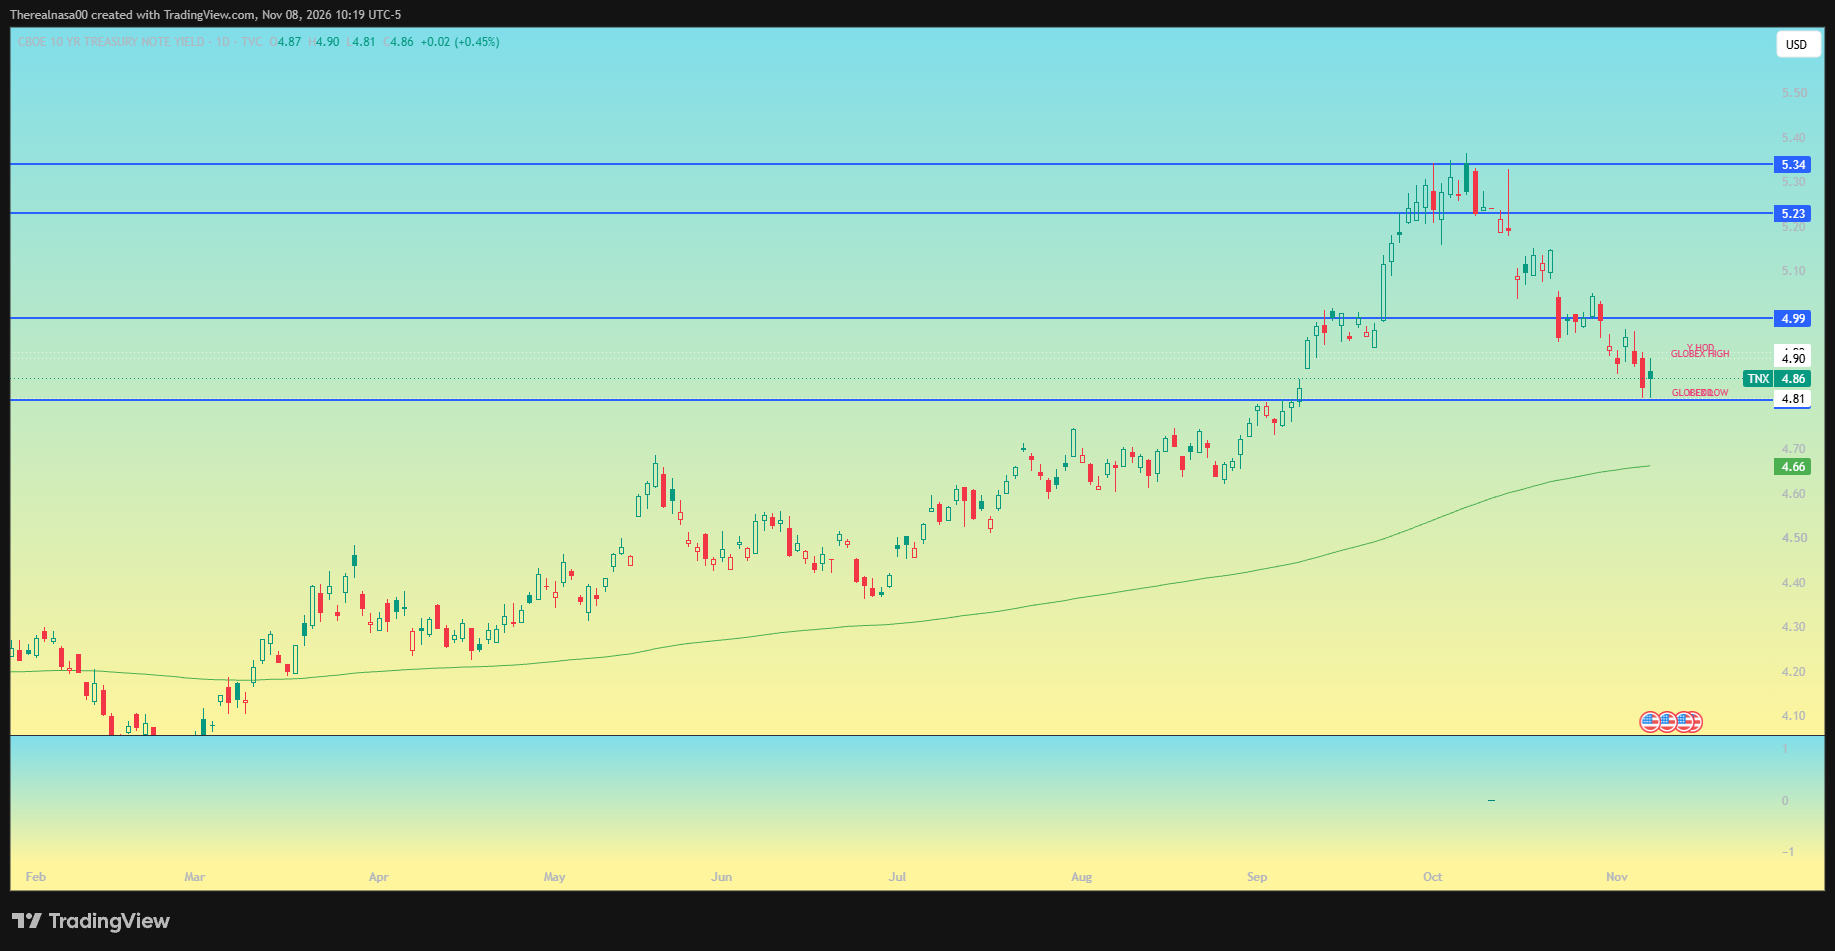
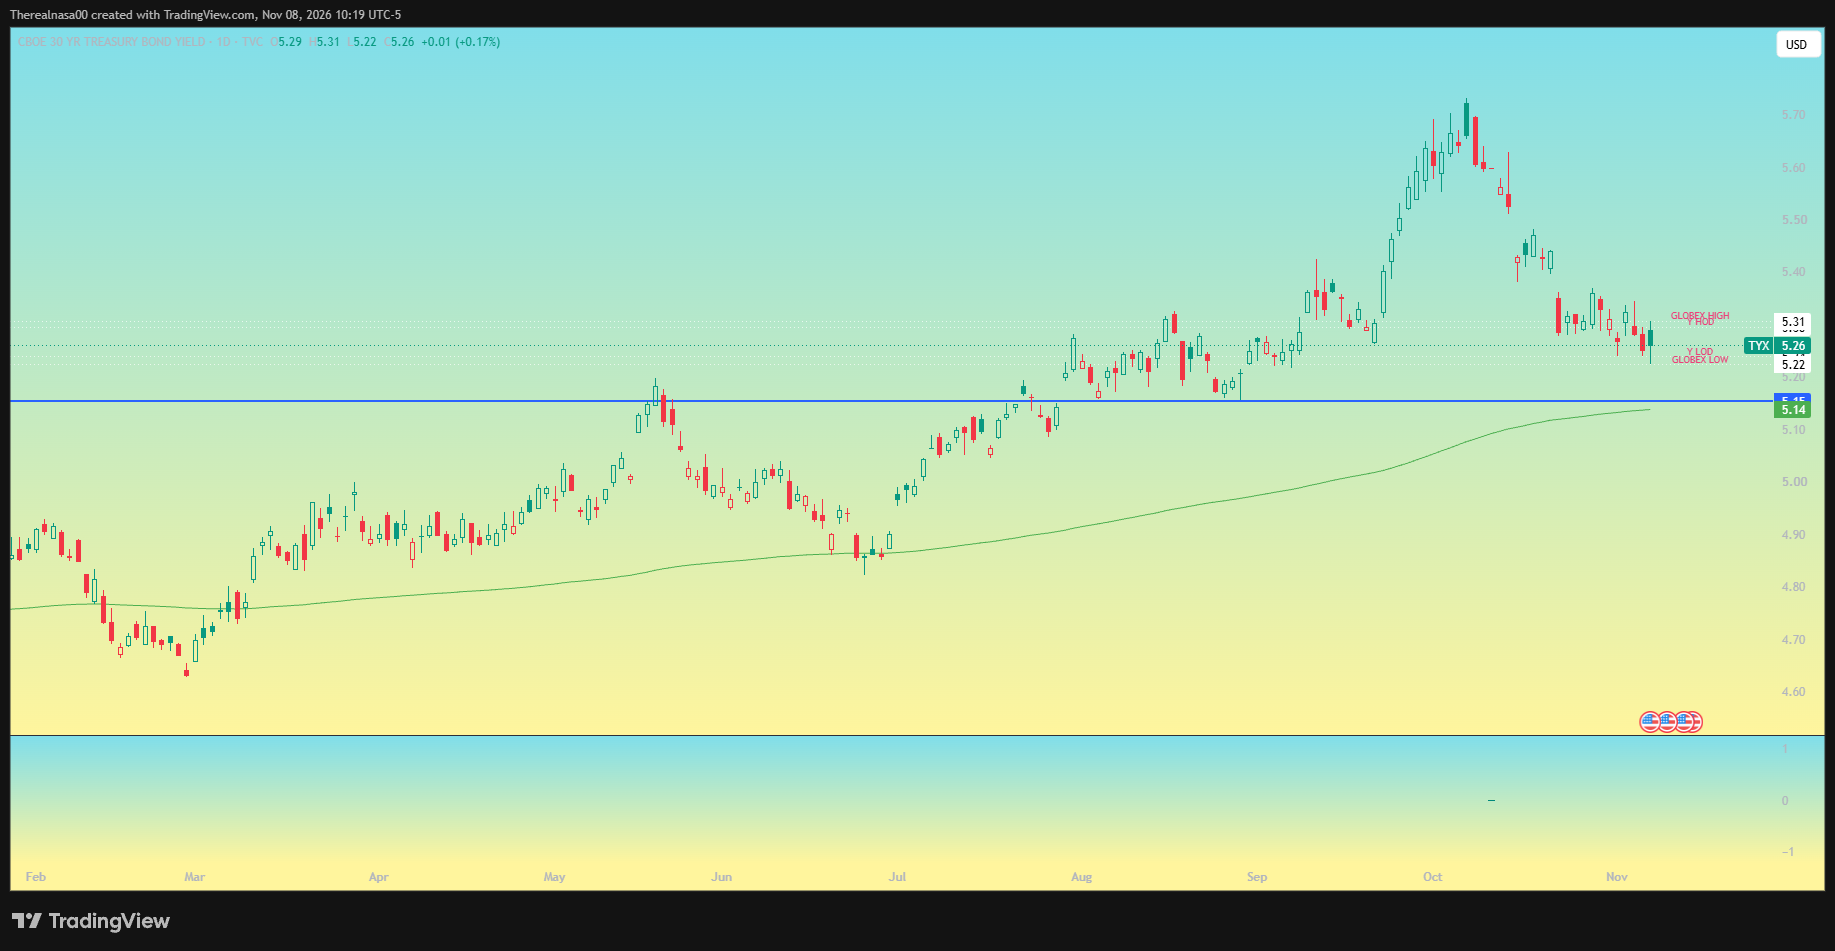
• The 10 year is down again. TLT closed around 82, TNX around 484. That's good. It's what we've been waiting for: the 10 year and rates coming down
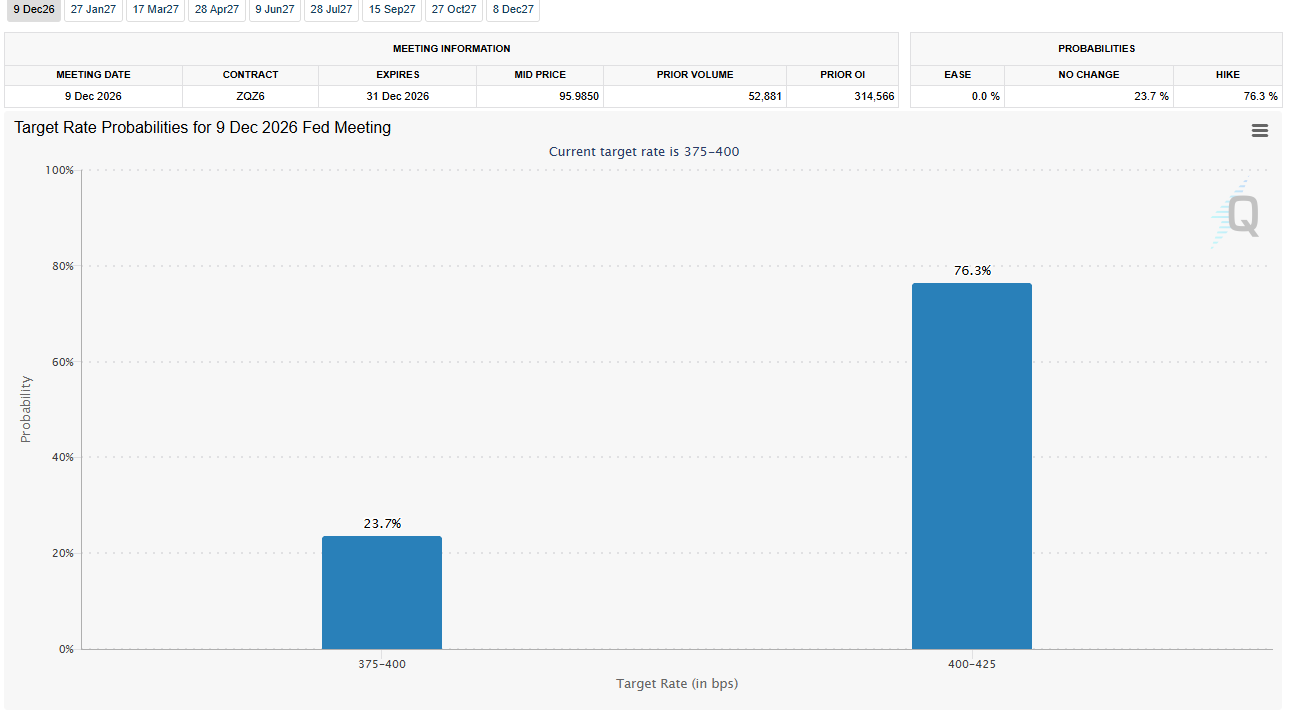
• December Fed hike odds fell from around 85% to the mid 60s , and closed at 76% chance on Friday. The market and FOMC participants now have a tough decision to make imo.
Overall, a bloodbath. A new mother bar has formed. But in my mind, the analog is still alive.
THE BIGGEST RISK THIS WEEK: NVDA AND JENSEN (NOT CPI)
Rumors are circulating that Jensen was honeypotted by a Chinese spy. That's not good.
If it comes out that he did give a Chinese spy secrets about NVIDIA chips and R&D, he could be removed as CEO, similar to Elon Musk years ago when he was relieved as CEO and had to take a new role in the company. I'm not saying that happens. But right now it's the biggest risk event IMO.
If true, it's a very serious thing. It's good for China, bad for America, and puts his position at the company in danger. Until any investigation is finished, NVDA could struggle. If NVDA struggles on fears of Jensen losing the CEO title, that's a heavy headwind for every chip name. And as this week showed, chips still lead the market.
What to watch: Does an investigation or any information come out, or is it all lies? Did he give out any information? Was she actually a spy? That is the biggest issue in the market right now, in my opinion.
https://www.nytimes.com/2026/10/29/us/politics/nvidia-china-jensen-huang-trump.html
ECONOMIC DATA
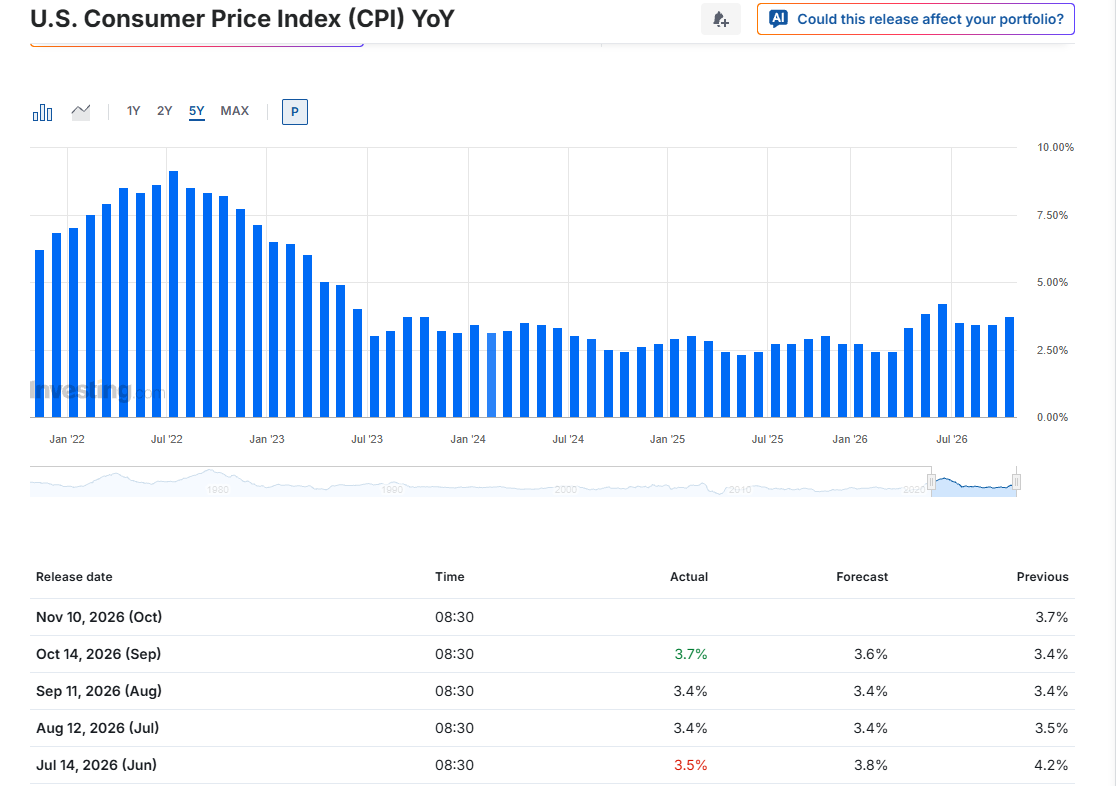
CPI: Tue Nov 10 (October data)
• Headline: +0.3% MoM (prior +0.6% Sep)
• Core: +0.2% MoM (prior +0.3% Sep)
• No YoY this time. BLS won't publish most 12 month rates since October 2025 prices were never collected during the shutdown. MoM is the number
• Cleveland Fed nowcast sits just under consensus: +0.24% headline, +0.21% core
• The tell is still the 0.25% rounding line on core. 0.21 to 0.22% prints 0.2%, 0.25% or higher prints 0.3%. ING is the hot outlier at +0.3% core
PPI: Fri Nov 13 (October data)
• Headline: +0.4% MoM (prior +1.3% Sep), consensus range 0.1 to 0.5%
• Headline YoY: +6.6% (prior 6.3%). Continuum expects 6.7%, the highest since Nov 2022
• Core (ex food & energy): +0.3% MoM (prior +0.7%)
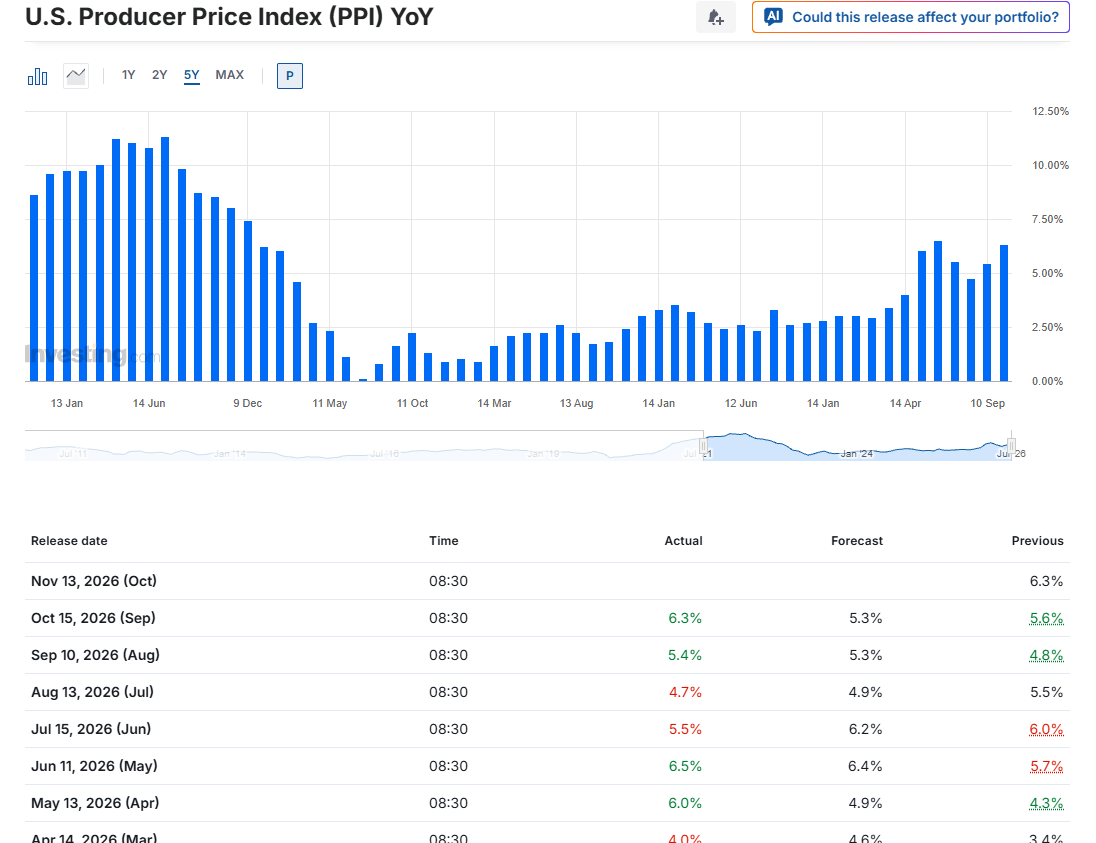
The bar is a cooler MoM on both after September's hot prints. CPI is the one that moves December hike pricing.
CLANKER GAMMA : MONDAY NOV 9 (0DTE)
• Net GEX negative $4.90B, no flip. Short gamma day, moves extend
• Call wall 7425 | Put wall 7350 | Max pain 7580 (203 pts up, too far to be a magnet Monday)
• Spot 7376.86 sits 27 above the put wall and 48 under the call wall
• Expected move ±1.28% (±94 pts), band 7283 to 7471
Read: 7350 is the day's line. Lose it with acceptance and it's short toward 7283, no catching. Reclaim and hold 7425 and it flips long toward 7471.
REST OF THE WEEK (AGGREGATE THRU FRI NOV 13)
• Net GEX negative $22.73B, no flip
• Every day is negative ($B): Mon 4.90 | Tue 3.59 | Wed 5.42 | Thu 1.85 | Fri 6.98
• Week call wall 7500 | Put wall 7350 (stacked with Monday's) | Max pain 7625 | Friday expiry max pain 7640
• Friday is the most short gamma day of the week (negative $6.98B)
• Tuesday's CPI chain is the second lightest (negative $3.59B). The event isn't in the gamma, it's in the straddle: ±2.57% for the week, band 7188 to 7566
Net: negative gamma all five days, no flip anywhere. Chop with extension risk.
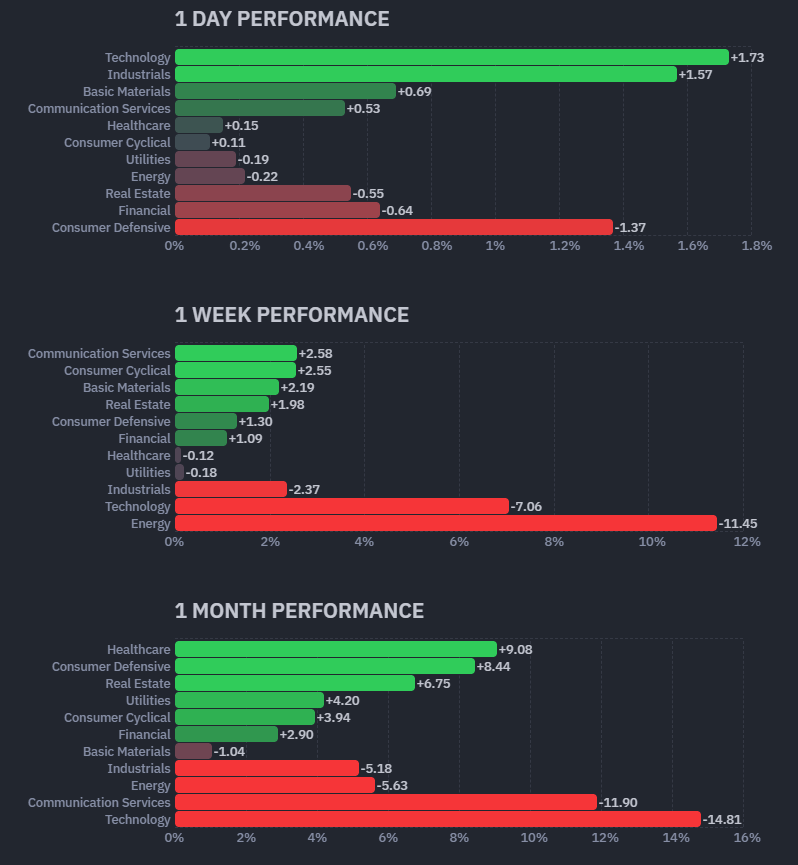
SECTORS (WEEK OCT 30 TO NOV 6 CLOSE)
Green
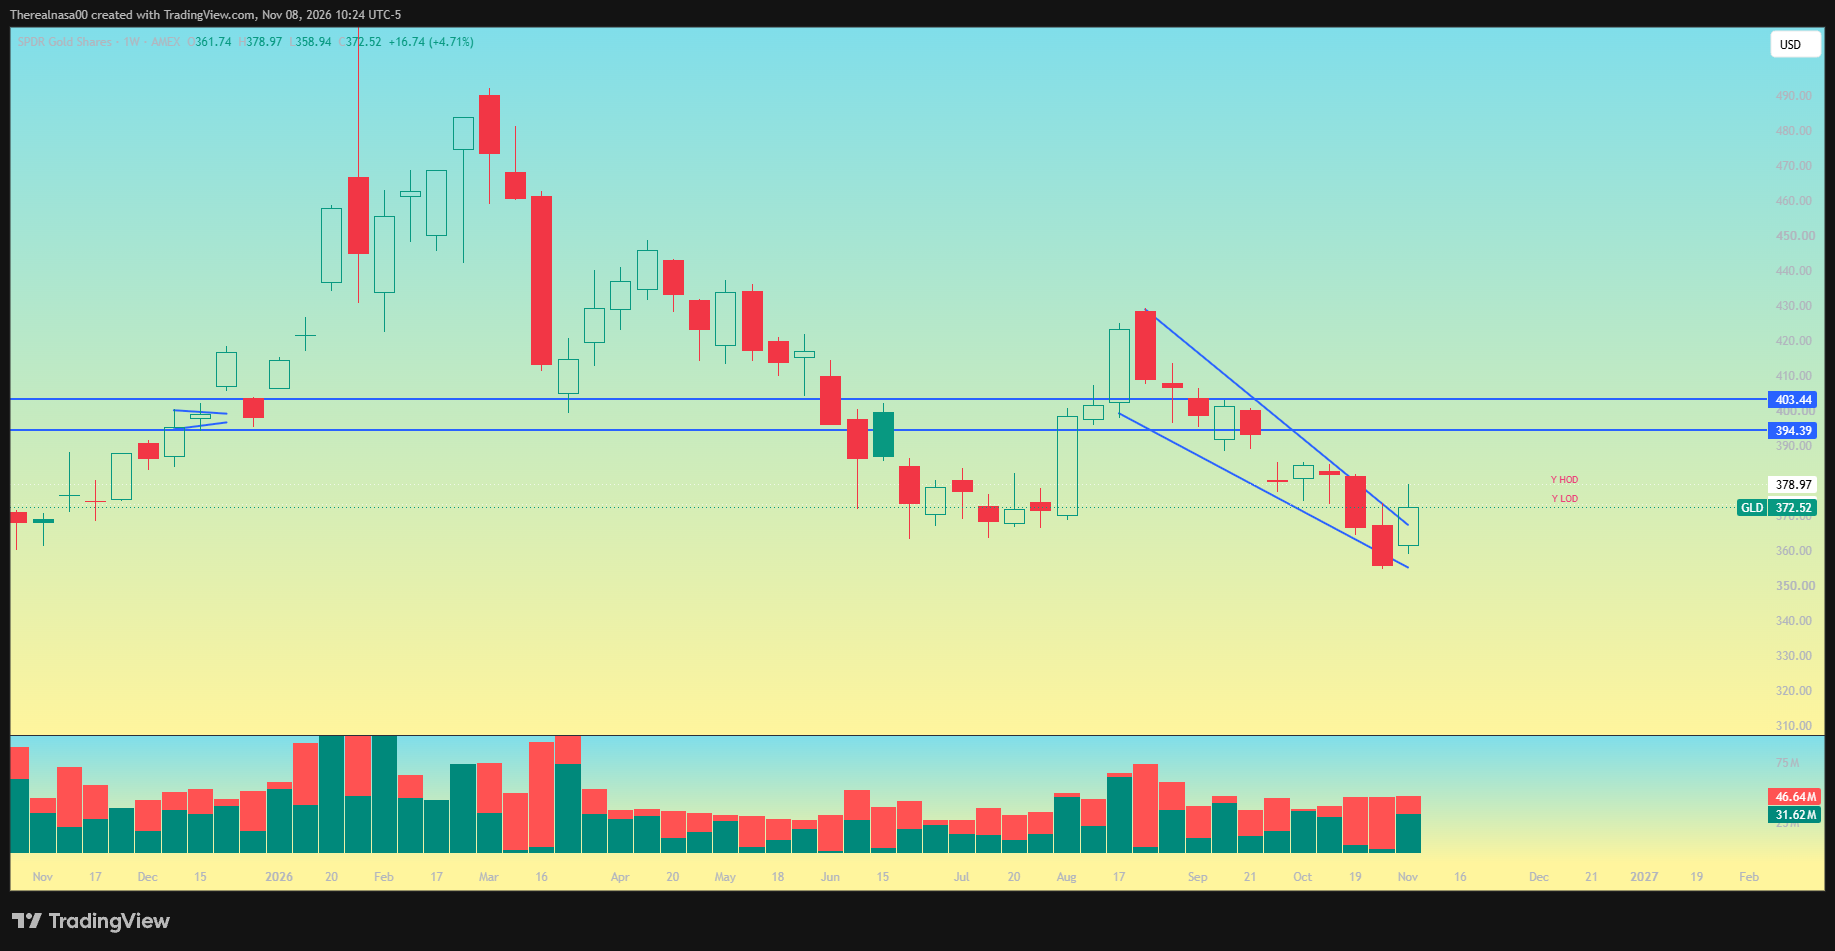
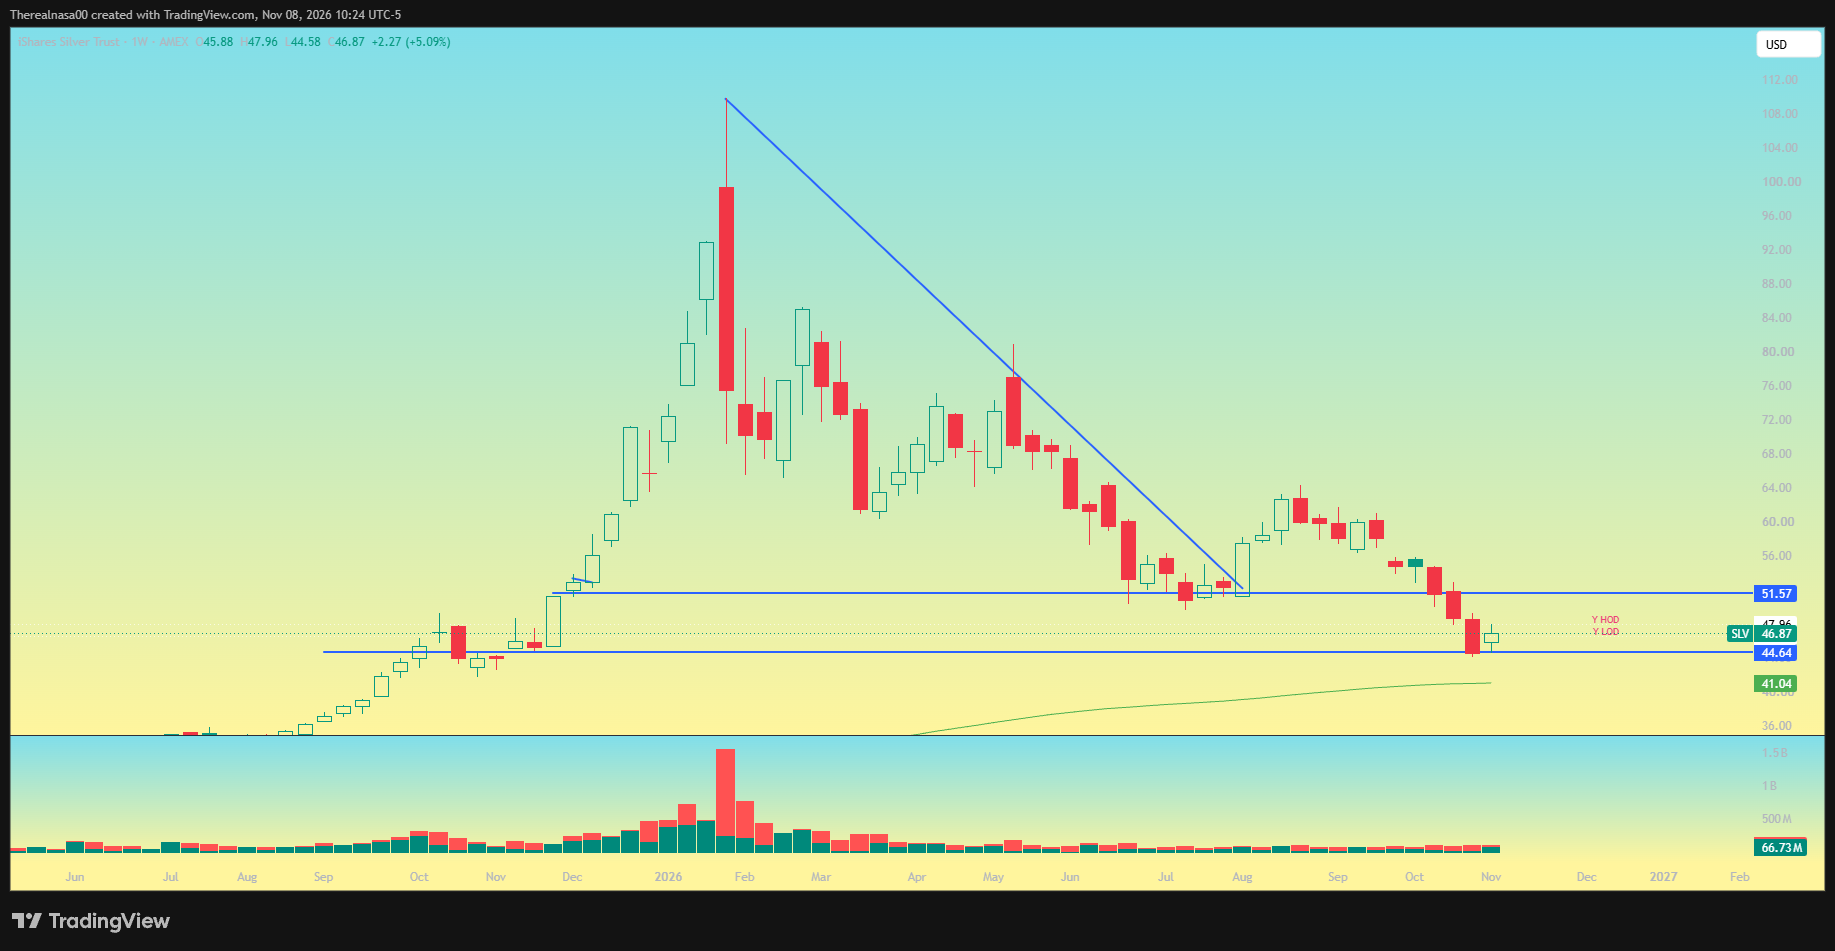
• GDX +13.6% (gold miners)
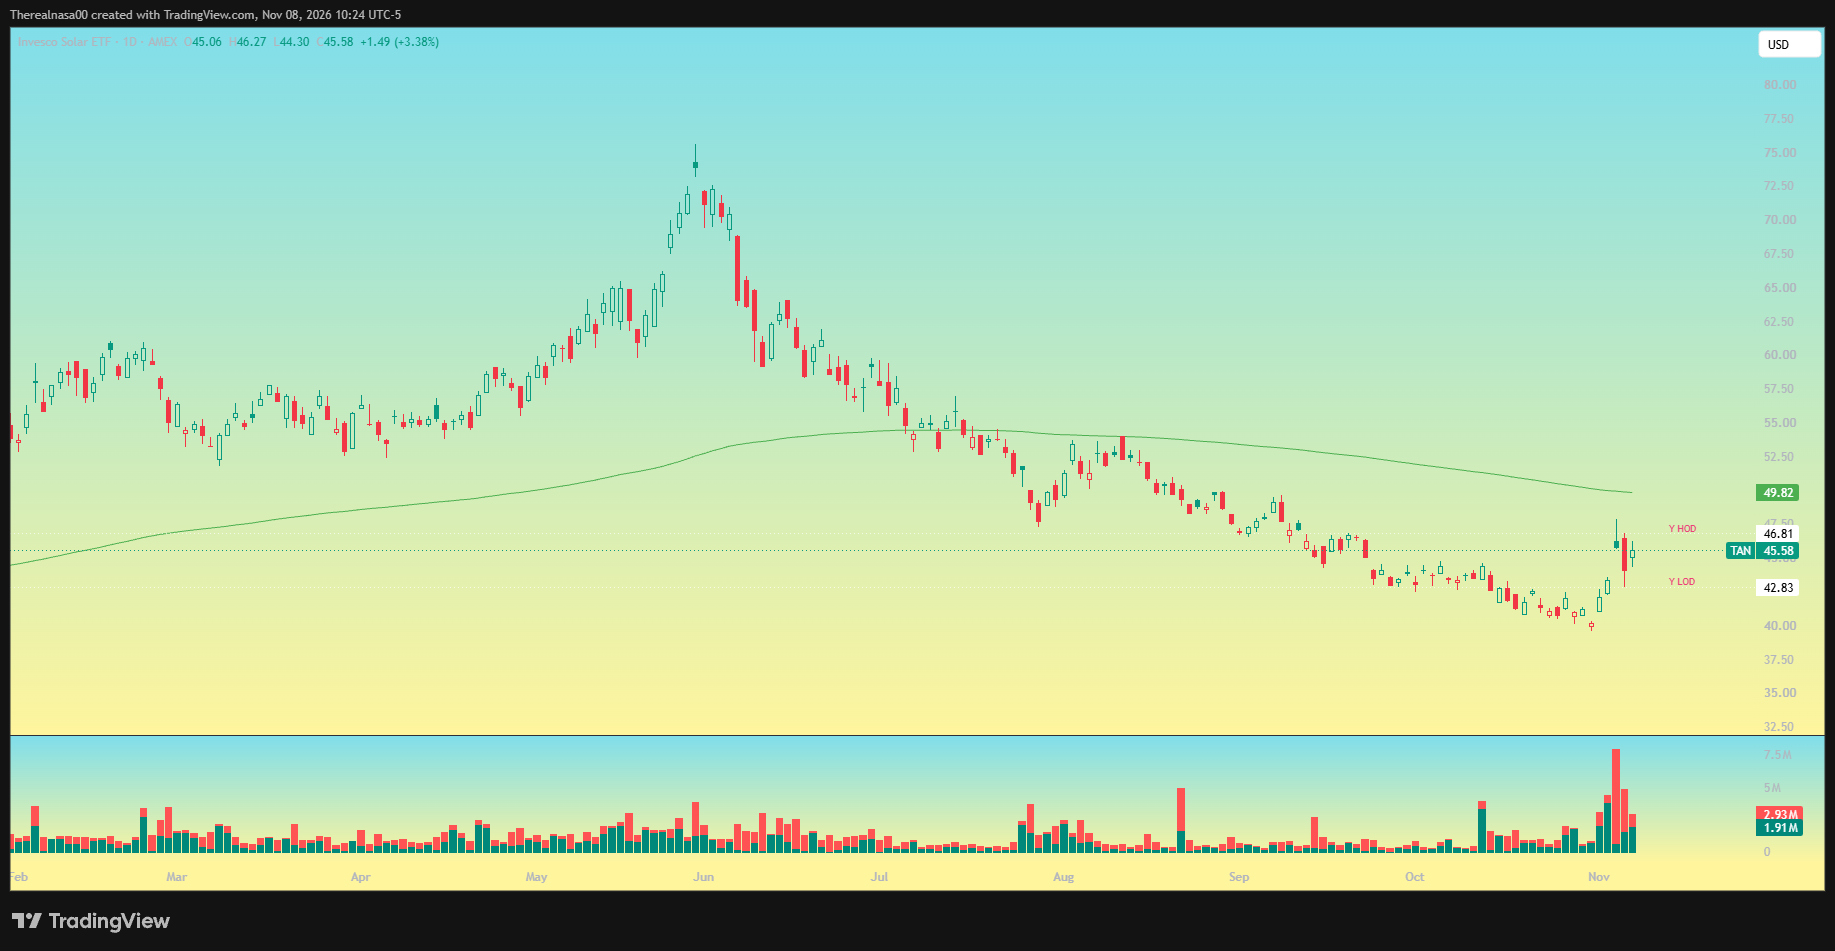
• TAN +13.4% (solar/policy)
• XLC +4.9%, the only big sector green by a real margin
• XLRE +1.9% | XLY +1.9% | XHB +1.3% | XLF +1.2% | XRT +0.9% | XLP +0.7% | KRE +0.3%
Red
• XOP down 14.7% (E&P)
• XLE down 12.0% (energy)
• SMH down 11.2% (semis)
• XLK down 8.2% (tech)
• XTL down 7.4% | XME down 4.5% | XSW down 3.3% | XLI down 2.8% | SPY down 2.7% | XBI down 2.4% | XLB down 1.5%
Rotation: Money came out of the AI buildout and energy (semis down 11%, tech down 8%, crude complex down 12 to 15%) and into gold miners and policy/solar names, with comm services the lone big sector winner. Wednesday was the sweep day (XLY/XLF/XLV up), Thursday flushed everything, and Friday's bounce was memory led (SMH +3.6%, XLK +1.5%) but didn't repair the week.
ADVANCERS VS DECLINERS
• Thu Nov 5: The most broad based selloff of 2026. 430 of 500 S&P names down. NYSE net advances negative 1,921 (vs +1,426 Wed). All exchanges: 625 up / 3,906 down, A/D 0.16. NYSE downside volume over 80%, the first time since Nov 17, 2025
• Wed Nov 4: 2,296 up / 873 down, A/D 2.63. Broad sweep rally
• Fri Nov 6: 2,426 up / 2,053 down, A/D 1.18 (S&P only: 1,592 / 1,543, A/D 1.03). The bounce was narrow, barely more winners than losers on a green tape
• Qualifier: Equal weight fell less than cap weight Thursday (RSP down 2.89% vs SPX down 4.36%). It was a tech led flush

BREADTH
• S&P 500 above 200 day: ~56% (279 of 500), down from 61.8% on Oct 27 and the 58.8% peak on Oct 22. The break line is under 54.4%. We're above it, but one more bad day takes it out
• SPX closed Friday at 7,377, less than 1% above its own 200 day near 7,325
• S&P above 50 day: ~62%, down from 71.8% Wednesday
• All US stocks above 200 day: 37.5%. The average stock is in much worse shape than the index
• Nasdaq 100 above 200 day: 42.4%
• McClellan oscillator fell from +48.8 Wednesday to +9.5 Thursday. Still positive, but sharply weaker
MY ES GAME PLAN FOR THE WEEK
Pivot: 7426 (June lows). This is what I'm trading off of right now.
Below the pivot
• If we can't reclaim 7426, 7346 to the 7320s (LWL) are back in play, with a flush under that
Above the pivot
• The real reclaim needed is 7470 (200 day on ES) to do anything constructive IMO. Until we're above it, upside is very limited
• If 7426 is reclaimed: 7470 is the first target, 7492 (election night lows) is PT2, and 7537 above that
The mother bar: 7340 to 7740 on ES, a 400 point mother bar candle. The least surprising thing here is violent chop inside this range for the next several days, possibly expanding into CPI. The downside is easier to break since it's only 80 points below. If it breaks, 7255 is in play fast IMO. Break the mother bar lows and we see more pain IMO.