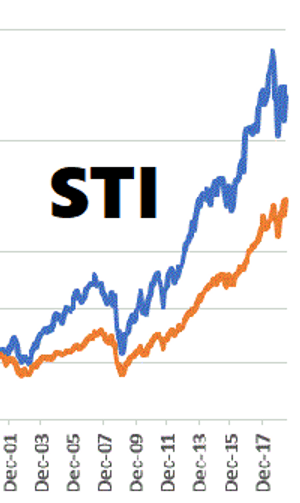


ACTUAL RESULTS - Current trading models
2026 (01/02/26 - xx/xx/26)
-SPUU x1 (weekly): +xx% (vs SPY: +xx%)
-Ultra x2 (monthly): +xx% (vs SPY: +xx%)
2025 (STI Start: 05/01/25 - 12/31/25)
-SPUU x1 (weekly): +30.35% (vs SPY: +23.96%)
-Ultra x2 (monthly): +47.59% (vs SPY: +23.96%)
*NOTE: performance data for STI models & SPY above = actual % returns for portfolios in STI-related M1 Finance accounts created for tracking "real-world" results.
____________________
BACKTEST RESULTS
Lookback period:
-ETF x1: 09/01/2014 - 10/31/2024 (= 10 years, 2 months)
-NSDQ x2: 01/01/2014 - 10/31/2024 (= 10 years, 10 months)
-Ultra x1: 01/01/2014 - 10/31/2024 (= 10 years, 10 months)
Yearly Win Rate (%) against SPY:
-ETF x1: 100%
-NSDQ x2: 100%
-Ultra x1: 100%
Monthly Win Rate (%) against SPY:
-ETF x1: 73.58%
-NSDQ x2: 68.46%
-Ultra x1: 58.06%
Compound Annual Growth Rate (CAGR):
-ETF x1: +36.79% (vs SPY: +12.79%)
-NSDQ x2: +65.52% (vs SPY: +12.91%)
-Ultra x1: +69.40% (vs SPY: +12.91%)
Best 1-Month return:
-ETF x1: +24.97% in 10/2022 (vs SPY same month: +8.13%)
-NSDQ x2: +30.72% in 02/2021 (vs SPY same month: +2.78%)
-Ultra x1: +50.69% in 10/2022 (vs SPY same month: +8.13%)
Worst 1-Month drawdown:
-ETF x1: -17.75% in 10/2018 (vs SPY same month: -6.91%)
-NSDQ x2: -26.97% in 06/2022 (vs SPY same month: -8.25%)
-Ultra x1: -31.80% in 06/2022 (vs SPY same month: -8.25%)
Best 1-Year return:
-ETF x1: +71.77% in 2021 (vs SPY same year: +28.75%)
-NSDQ x2: +170.96% in 2023 (vs SPY same year: +26.19%)
-Ultra x1: +148.39% in 2023 (vs SPY same year: +26.19%)
Worst 1-Year return:
-ETF x1: +7.48% in 2015 (vs SPY same year: +1.25%)
-NSDQ x2: +14.26% in 2022 (vs SPY same year: -18.17%)
-Ultra x1: +7.02% in 2018 (vs SPY same year: -4.56%)
Final Balance after an initial $10,000 investment (w/ no further contributions):
-ETF x1: $241,702 (vs SPY: $33,983) after 10 years, 2 months
-NSDQ x2: $2,349,518 (vs SPY: $37,272) after 10 years, 10 months
-Ultra x1: $3,018,452 (vs SPY: $37,272) after 10 years, 10 months
*NOTE: hypothetical final balances do NOT reflect potential trading costs, transaction fees, commissions, or actual taxes due.
Backtest Considerations
Although backtesting is an important preliminary component of constructing STI models, all backtests have limitations, thus should be viewed with a healthy degree of skepticism. When utilizing backtests to construct models, STI aims to mitigate the risks & flaws often associated with low-quality backtesting. However, certain limitations remain which is why STI backtest results, while useful, should not be considered proxies for "real-world" results. For example, while STI backtests include some prior black swan events (e.g., COVID-19 Market Crash of 2020) & market declines (e.g., year 2022) with the models showing strong and/or relative outperformance during those years, there is no guarantee re: how well the models will ultimately perform during future black swan events or market declines (***see disclaimer below).
In the context of STI models, STI holds the position that more weight should be given to "real-world" results of a given model once the strategy has actually been implemented in a trading account. STI shares actual results at the top of the home page here. Note: performance results are updated at least quarterly, but more often monthly or weekly so members can compare & track over time.
____________________
***DISCLAIMER: Systematic Trade-Invest (STI) does not provide financial/ investment/ tax advice, services or recommendations. Any information shared by STI is presented without consideration (and thus, may not be suitable) for any specific member/investor/supporter's individual investment objective(s), risk tolerance, or financial circumstances. Past performance is not a guarantee of future returns. While the primary performance goal for each STI model is to outperform the market over time, there is no guarantee they can continue to do so. STI model trade signals shared with monthly members are for illustrative purposes only and are in NO way a recommendation to buy, sell, hold, or otherwise transact in any of the products/ ETFs/ stocks mentioned. While STI aims to post model trade signals on the first trading day of each month prior to US Stock Market open during most months, STI makes NO guarantee this target can/ will be met every month. Trading/investing involves risk, including possible loss of principal capital. Trade/invest at your own risk. STI encourages all members/supporters to get personal financial advice from a professional investment advisor, qualified tax professional and to make independent investigations before acting on any information shared or posted by STI.
____________________
===> Continue to: FAQs
-Last updated: 11/01/24