
It is not enough to do your best; you must know what to do, and then do your best. William Edwards Deming
This is one of my favourite quotes about quality, simplicity, optimisation and value stream. It's coming from a man universally acclaimed as one of the founding fathers of Total Quality Management, if not THE founding father. I keep it at the back of my mind when designing software. I also remember that preparing a design, documenting it, sharing it with your team is itself an optimisation exercise.
Understanding what NOT to do is equally, if not more important as understanding what to do.
How do you achieve the most with the least effort? How do you ensure your teams understood what is required? How do you ensure you understand the needs of the customer? How do you help the customer understand what you're doing so you can continuously align?
Primary focus when designing software is to conceptualise the flow of data through an application. After all, this is what ALL programs are about, the flow and the transformations of data. It doesn't matter what kind of software your are writing, what style, what language, which of the xDD paradigms you use. Take a step back and you'll recognise you are dealing with data sources, data transformations, and data sinks, and thats it.
Inputs for your application can be REST requests, Kafka events, files, databases, user events, the UI, hardware interrupts etc. Same for outputs. The important thing is that we are dealing with pure data each time we read an input or write to output. And what do we do inside the application? We transform the data into a format we need, and direct it where it needs to go. The entire application can be viewed as a process of transforming inputs into outputs.
If you can’t describe what you’re doing as a process, you don’t know what you’re doing. William Edwards Deming
Some characteristics of poor architectural diagrams:
You cannot understand the general idea without an explanation of what you're looking at.
The diagram is overcrowded or almost empty.
Diagram has too many shapes, colours, arrow types.
Arrows go everywhere and nowhere, and you cannot figure out what they mean. Is it a reference, a message queue, a REST request, a function call...?
The diagram is too large, larger than a single slide and shows items disconnected from the idea being sharing.
Diagram doesn't use any axis to apply a gradient of some helpful characteristic to aid explanation e.g. sequence diagrams use time in the Y axis.
The information you are looking for is buried in the noise.
You cannot figure out what questions you should be asking.
The diagram assumes the knowledge of the thing it is attempting to explain.
Diagram focuses on the structure without explaining what the structure is there to accomplish; what is the purpose, the goal?
Many of these points apply not only to diagrams but to documentation in general, in any format you encounter. Walls of text? Do you read them? The problem is deeper.
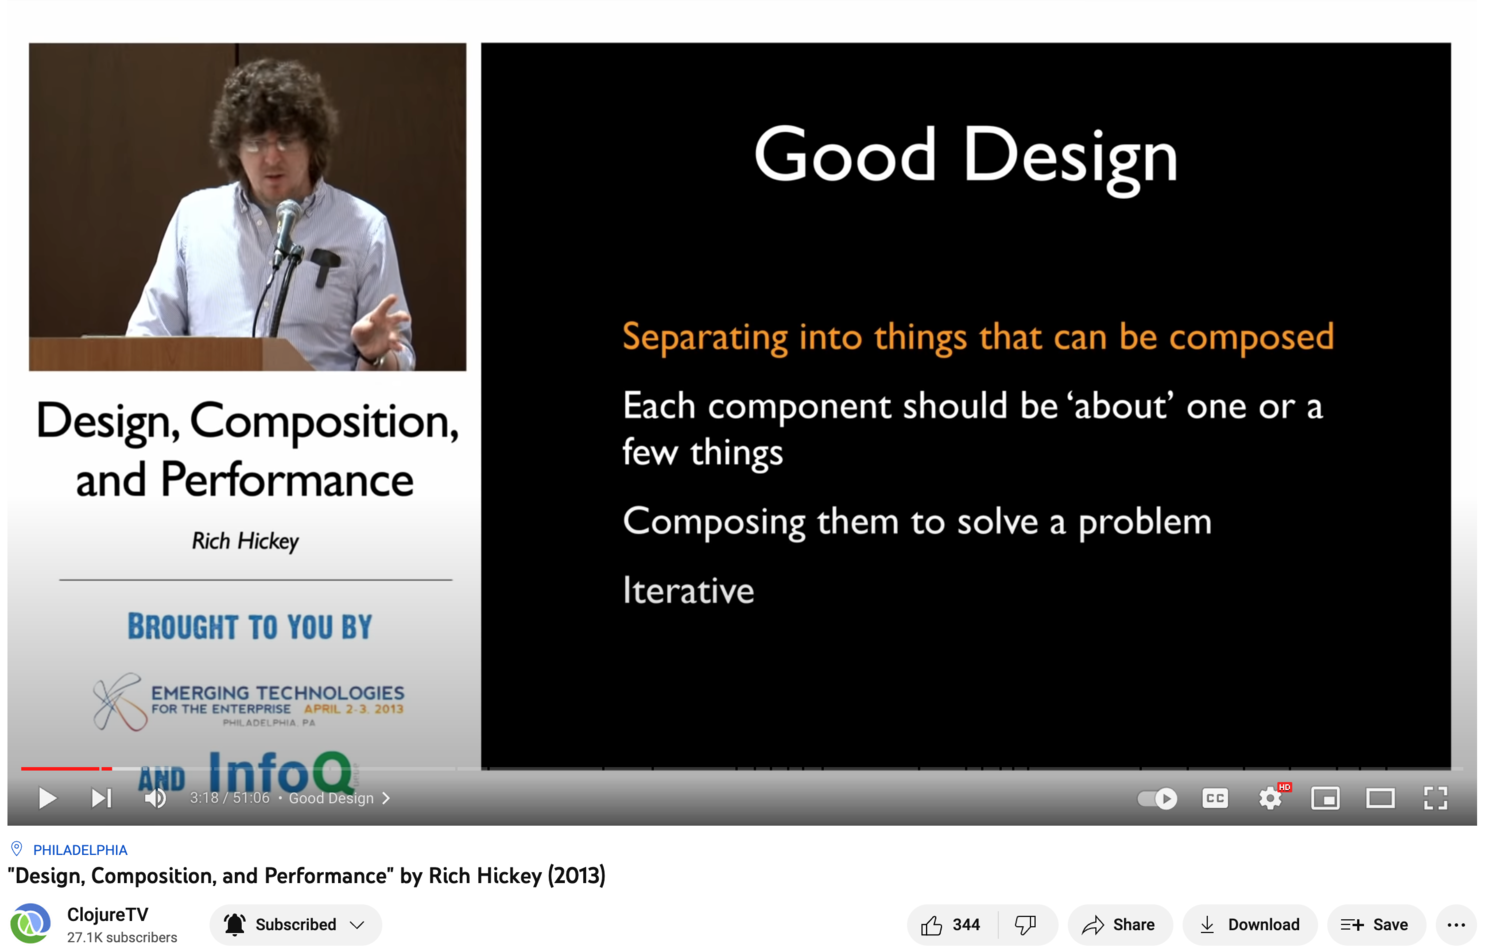
First of all, what does it mean to design? I like the definition used by the creator of Clojure language, Rich Hickey, in one of his recent talks.
Design - to prepare plans for a work to be executed, especially to plan the form and structure of.
We see the word structure in there and thus our focus could be structure, but that is only the second part of the definition. The first part is more important because it reveals we need to know what it is we are designing, otherwise we cannot set the boundaries or limits and plan work. How is it supposed to work? What is it supposed to achieve?
Unfortunately, due to the history* of computer science, software is rarely decomposed in such a way and imagined as a flow and transformations of data. Often this way of thinking is limited to some small parts of software, or a niche application dealing with throughput limitations. That is a mistake.
The noise and the number of types of diagrams also don't help. Most diagrams you see in the wild deal with the structure of your code, and rarely with the purpose of your code.
In software design it is the purpose you want to communicate, rarely the structure. If the structure is not "obvious" you probably already overcomplicated the design.
Imagine how many times you looked on a class diagram of some application. The application was not even big, yet the diagram listed hundreds of classes, took many pages and didn't increase understanding... what is this software supposed to do?
You need to visualise the data flowing through a vertical slice of a solution. You need the documentation to help you understand, increase clarity, simplify. You do NOT need documentation to provide more noise than signal, or be so verbose and difficult to maintain it becomes outdated.
* because first computers were machines with limited computing power and memory, the first languages focused on efficiently manipulating resources. These were assemblers, C, C++ etc. where all data is passed by reference. This resulted in languages designed around references, where overly complicated and brittle structures, with inheritance, encapsulation and a myriad of other inventions made it increasingly difficult to understand the convoluted design of software. Thus structural diagrams became very important to wrangle the complexity. Unfortunately they did not address the underlying problem of references and mutability of data. Fortunately today we are moving in the right direction, with more architects embracing microservices which exchange data by-value while sending messages, and even more importantly using functional languages where pure functions pass data by-value. Building a functional program is like building with LEGO blocks. Read more about this idea here.
Is your design big, brittle, overcomplicated, hard to change?
Are you limited by legacy systems nobody can understand?
Does your organisation understand the cost of maintaining mountains of documentation?
Does your documentation add value or is it an afterthought?
What do you achieve with your documentation?
Do you produce walls of text nobody reads?
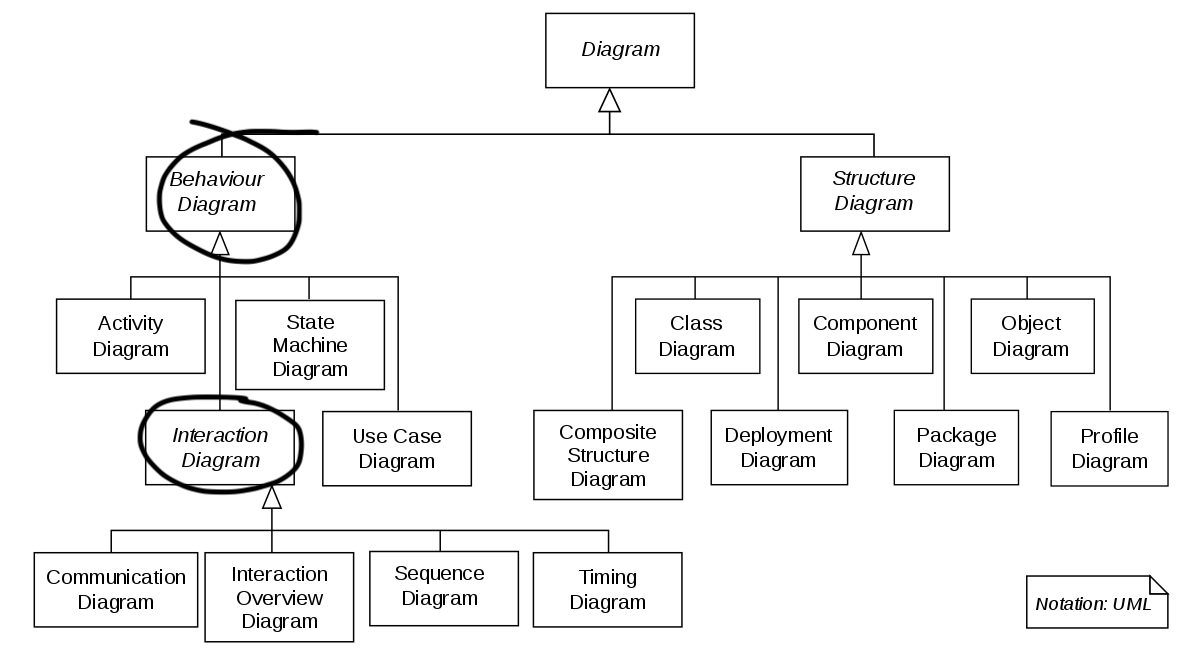
The less documentation you have, while still communicating the purpose of your design, the better. I don't know the exact proportions, and they change depending on the specific cases, but I always recommend to have about 5 times more behavioural (interaction diagrams) than structural diagrams. Translated into UML this would mean 80% of your documentation should fall one the left side of the tree shown below, and only 20% on the right. I frequently experienced the ratio to be inverted, hence this article.
Fortunately focusing on the flow of data, and the purpose of your software can put you back on the right track, and help you achieve simplicity in your design. Applying the below rule to each microservice, actor, module for an entire solution produces a clear, complete and useful documentation.
For a single microservice to be understood, the team needs one stack diagram, less than five entity diagrams, and between five and ten sequence diagrams per use case - visualising all the positive and negative test flows.
How many use cases should be handled by a single microservice, actor, module? The simple answer is one. The more realistic answer is below three.
When you are dealing with monolithic applications, as long as they are implemented using a functional language with pure functions and by-value data flow, you can replace sequence diagrams with data flow diagrams. And if you are not using a functional language... why not? What are you waiting for? Sequence diagrams are a special case of data flow diagrams... or maybe it's the other way around.
The cool thing about data flow diagrams is that they work both for the insides of monoliths and for the insides of microservices, because there is actually no difference. With a monolithic application only the numbers will change, simply because monoliths are bigger, but even big services can be understood with data flow... You actually have a chance to understand them better and make them smaller, decoupled and asynchronous / actor oriented.
The above rule of thumb provides, at least for me, and additional value in easily explaining what is "micro" in a microservice. It is the idea of doing one thing and doing it well.
Until now I have not explained the most important reason why designing, visualising and documenting the flow in your application is important - it enables you to instantly gage how well your design is aligned with the value stream of your organisation or your customers needs. What good is a beautifully structured application, which does not achieve the goals of the customer? What's the point of the most ambitious and perfectly architected game if nobody wants to play it? Architecture for architectures sake is useless.
All of the design work you are doing, and you better be doing it in parallel with development and testing, is intended to give you the quickest understanding if you are on the right track. It's there so you can understand quickly what NOT to do.
I have witnessed many times how a deep explanation of the data flowing through a design, provided to the team or to the customer, enabled instantaneous clarification of wrong assumptions. This put the team on the right track not a week, a month, a quarter later, but during a demo. Design and prototype the flow of data, and demo it to the customer... What an extreme concept, I know.
I have seen it, I have done the presentations, and I even had a situation where a CTO of an organisation was helping guide the development, because he understood the design. If we demonstrated a class hierarchy, we would get nowhere... because we would have lost everyone now familiar with the internal workings of our architecture. "Nobody" cares how an engine is made. They care that it drives the car forward.
Below I have listed the five most important diagrams enabling a good and simple design. Start using them today, and I guarantee you will see improvement in collaboration within and outside your teams.
Software / solution stack diagram (SSD)
Because you want to visualise data flowing through a vertical slice of the solution, it is critical to understand what are the layers of the slice. A good starting point here, as in all other cases is to ask what inputs and outputs is your application supposed to work with. This gives you a place to start at the top of the diagram, from where you go down with your decomposition.
You will also probably know the technologies you have access to at the bottom, which enables attacking the problem from two directions. The vertical slice you cut will cover the functionality required to implement a minimum viable product, build an integration pipeline and enable continuous testing. What are you cutting into? If you don't know entirely, you should know where the question marks should be. This kind of diagram is the basis of a tracer software approach recommended in The Pragmatic Programmer: Your Journey To Mastery.
Entity relationship diagram (ERD)
An entity–relationship diagram describes interrelated things of interest in a specific domain of knowledge. A basic ERD is composed of entity types (which classify the things of interest), specifies relationships that can exist between entities (instances of those entity types) and some properties of the entities.
ERD is commonly formed to represent things from a business perspective, what the software is supposed to achieve. Representing relationships from the perspective of the business goal is important, especially in contrast to the other most closely related type of diagram i.e. class relationship diagram. ERD is focused on the value, relationships aligned with the purpose of the software, while class diagram visualises the architecture of the software. As I explained already architecture and value are orthogonal problems.
To say it a different way - there is no guarantee you will understand what the application is doing while looking at a class diagram, whereas looking at an entity relationship diagram will instantly tell you the purpose of the software.
Sequence diagram (SD)
⚠ I said it once, I'll say it again and I'll never stop 😁 - Sequence diagrams are the single most important tool to visualise your software, your dependencies between teams and departments, the collaboration within your organisation, dependencies between software packages, your production and manufacturing flow etc.
⚠ If you cannot represent a feature with a sequence diagram, you just don't understand it enough yet. The inverse is also true - if you CAN represent your feature, architecture, organisation, ... with a sequence diagram, that means you have it figured out pretty well.
✅ And don't think for a second that sequence diagrams are only for parallel software services talking with messages. They can be used to visualise any set of asynchronously dependent entities exchanging any information, data, documents, physical artefacts. You can use them to visualise entire manufacturing operations and supply chains.
Value stream mapping is just a specialised version of a sequence diagram!
✅ Oh and here's the kicker - when you are working on an agile team and want to prepare a good breakdown of work "how to deliver a software product", focus on creating sequence diagrams for all features, and translate the sequence diagrams into user stories in a backlog. Done! Now you can implement the flows, test them, package and deploy them independently. ❗
✅ Understanding sequence diagrams and using them for work breakdown will give you superpowers and turn your team into laser falcon tiger dragons!
A sequence diagram shows, as parallel vertical lines (lifelines), different processes or objects that live simultaneously, and as horizontal arrows, the messages exchanged between them. Each message and activity appears the order in which they occur. This allows the specification of simple runtime scenarios in a graphical manner.
A sequence diagram should visualise the following:
Actors in the system and their lifetime
When actors are doing work
Messages (methods) sent by these actors
Return values (if any) associated with messages
Indication of any loops or iteration area
Sequence diagram is designed to demonstrate the interactions and message exchanges between asynchronous processes, microservices or actors. The communication between processes and the activity of individual processes is graphed over time. Sequence diagram helps to understand how triggering an event e.g. generating some input into a complex system, propagates through the system with cascades of messages and activity.
We use sequence diagrams to understand and simplify communication protocols between actors, understand the flow of messages, notice or uncover potentially dangerous situations such as race conditions etc. I probably spend the most time designing an architecture drawing, redrawing, analysing, sharing, and brainstorming about sequence diagrams.
An important design consideration while designing actor oriented systems - Synchronous messaging is dangerous as it can lead to race conditions and deadlocks, in general weird bugs which only manifest randomly, due to indeterministic jitter, latency, speed etc. It is much safer to base actor oriented systems on asynchronous messages which do not require an immediate response. Asynchronous messaging is always high on the list of design recommendations for microservice architectures.
Data flow diagram (DFD)
Sequence diagram together with data flow diagram can be viewed as complimentary, or maybe two sides of the same coin. Where sequence diagram deals with asynchronous actors, a data flow diagrams assumes all data passing is happening synchronously, and only between pure functions. Sequence diagrams and data flow diagrams are able to cover together what happens between actors and what happens inside actors.
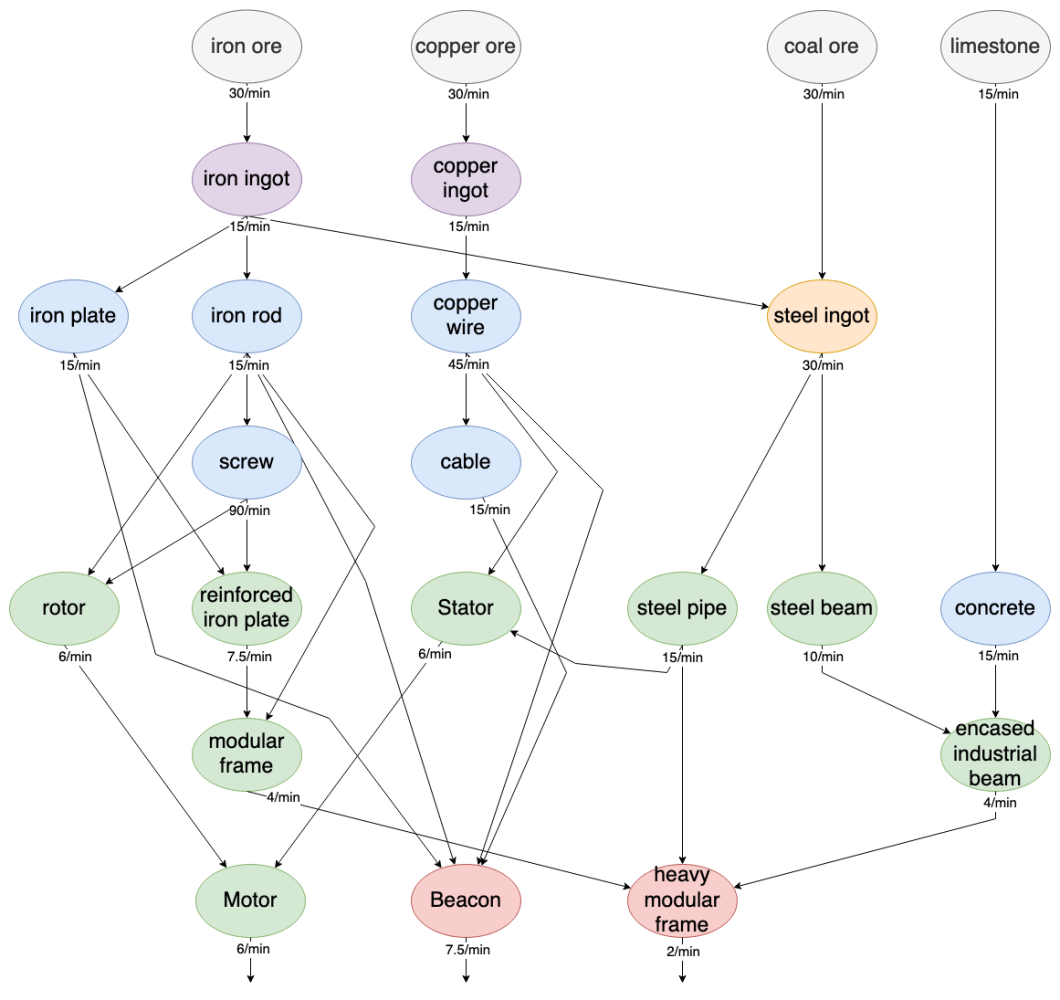
You can also imagine a data flow diagram as a sequence diagram laid on its side, as it is typically depicted with the time axis going from left to right. If you then replace messages between actors with data passed from one function to the next, you have a data flow diagram. A data flow diagram is focused on following the data as it is passing between and through functions, rather than following the system as a whole, as the sequence diagram does.
In computer programming, a pure function is a function that has the following properties:
the function return values are identical for identical arguments (no variation with local static variables, non-local variables, mutable reference arguments or input streams), and
the function has no side effects (no mutation of local static variables, non-local variables, mutable reference arguments or input/output streams).
Thus a pure function is a computational analogue of a mathematical function, and a synchronous analog of asynchronous actor.
The DFDs you see in the wild are typically just a little too complicated because they do not use a time axis. They typically demonstrate the flow of data in all directions between multiple functions or entities. My recommendation is to always use a time axis and draw the flow of data only in one direction, either left to right or top to bottom. Like this you will make your DFD much more readable and will also see how strongly it is related to sequence diagrams. You will also see the arrows which go "against the flow" of data, which will help you understand that they most probably contain data from a previous iteration, and need to be initialised i.e. you need to make an assumption.
Data flow diagrams can also be nested. You can represent the whole system as a collection of high level functions transforming inputs to outputs. Then you can zoom into these functions and explain them in more detail on the inside. And then zoom in even more. Pure functions all the way down.
Data flow diagrams can be directly translated into code if you are using a functional programming language, because functional languages are all about the data flowing between pure functions.
Value stream map (VSM)
Where the previous visualisation techniques I mentioned were designed to simplify and increase understanding of a software architecture, I must mention here about applying the idea of value stream and flow to managing an entire organisation. As it turns out creating software which can be continuously integrated, tested and deployed is very much like building a factory and a manufacturing operation. I am not the first person to notice this. There is a whole field of study... check out the books I listed at the end.
It is important for software engineers and architects and critical for engineering managers, directors and CTOs to understand what a value stream map is, and how it arms you to truly manage what is happening inside your organisation.
Value-stream mapping, also known as "material- and information-flow mapping", is a lean-management method for analysing the current state and designing a future state for the series of events that take a product or service from the beginning of the specific process until it reaches the customer.
A value stream map is a visual tool that displays all critical steps in a specific process and easily quantifies the time and volume taken at each stage. In the world of engineering we can thing of "volume taken at each stage" as work in progress (WIP). Value stream maps show the flow of both materials and information as they progress through the process.
The purpose of value-stream mapping is to identify and remove or reduce "waste" in value streams, thereby increasing the efficiency of a given value stream. Waste removal is intended to increase productivity by creating leaner operations which in turn make waste and quality problems easier to identify.
With all these types of diagrams I hope you noticed the pattern... If you are a software engineer, architect, project manager, line manager, technical manager, director, CTO, CEO, the flow of value through your design and your organisation can and should be visualised to help your teams align, and achieve the desired goals together. Say no to noise, embrace flow. This is what I ask from my teams.
After reading this article you might come to the conclusion that I am a advocate of Behavior Driven Development (BDD), which is a great observation, because I am. Do you know why I advocate BDD? Because it reinforces the idea that understanding the value stream from begging to the end is important, which translates into designing software from inputs, through transformations, into outputs. Because of this I am an even bigger advocate of the theory of constraints, and the books explaining it:
The Goal by Eli Goldratt
Critical Chain by Eli Goldratt
The Phoenix Project by Gene Kim
The Unicorn Project by Gene Kim
Besides these core books there are also others showing how to apply these ideas in practice:
The Pragmatic Programmer by Dave Thomas and Andrew Hunt
Continuous Delivery by Dave Farley and Jez Humble
Accelerate by Nicole Forsgren PhD and Jez Humble
The clean series by Uncle Bob - Clean Agile, Clean Architecture, Clean Developer
I recommend reading them all. And we have come full circle.
The key to designing good software is understanding how the data is flowing through your application. Inputs, transformations, outputs - this is what functional languages enable. We get good design through the application of the theory of constraints to software engineering.
Thanks
Comment, join and follow for more articles and videos. Thank you for all your support and see you next time!
If you enjoy this or my other articles, you can show your support by buying me a coffee, becoming a member or with YouTube Super Thanks.