

ULTY DRIP
$15
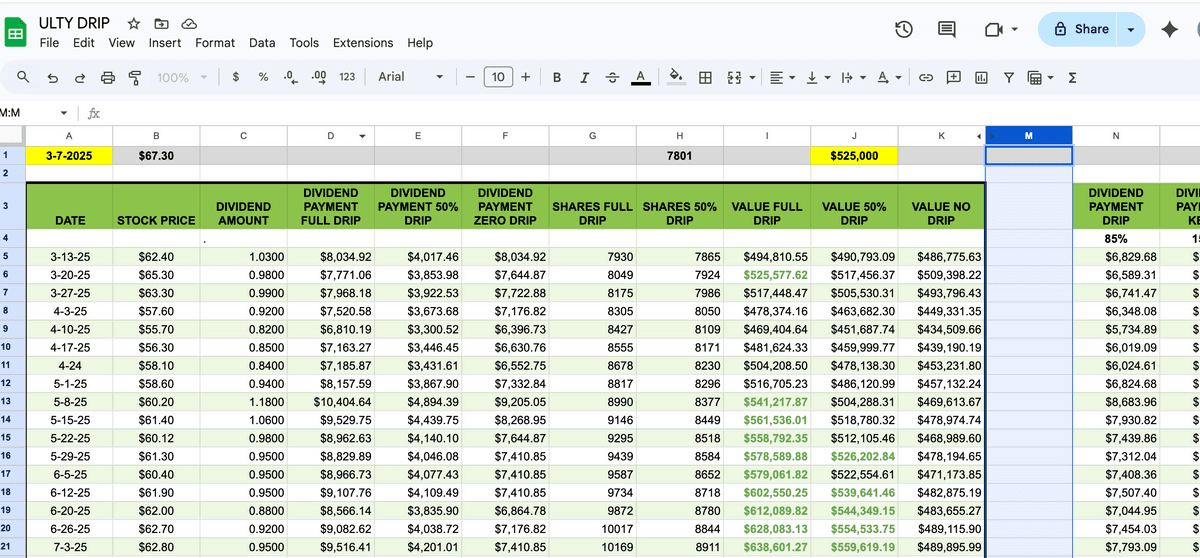
This detailed Google Sheet models a $525,000 investment in ULTY, tracking weekly dividend payouts, share price changes, and portfolio value over time. It includes multiple scenarios for dividend reinvestment (full drip, partial drip, and no drip) so you can see how different strategies impact income and portfolio sustainability.
Use this spreadsheet to:
Understand real income potential from ULTY
Explore how dividend reinvestment affects growth
Visualize portfolio balance and income fluctuations
Plan your own income strategy based on data-driven scenarios
This is the exact model used in the Simply Money video, designed for investors who want to dig deeper into ULTY's income performance. the art of note-taking with this extensive guide. Available in PDF format.
$15
Inserisci un prezzo equo
$
$15