
How participation and duration reveal the real structure behind every move.
🧩 Introduction
Price tells you where something traded.
Volume tells you how much traded.
Time tells you how long the market accepted it.
Only when you combine all three do you see the full picture.
Auction Market Theory (AMT) emphasizes that structure emerges not from price itself, but from how time and volume interact around price.
By merging Volume Profile and Time-Price Opportunity (TPO) Profile, traders gain what every professional seeks - true market context.
"Price is motion. Volume and time are meaning."
🏛️ The Core Idea
Markets discover value through two dimensions of acceptance:
Time Acceptance - how long the market stays at a price.
Volume Acceptance - how much activity occurs there.
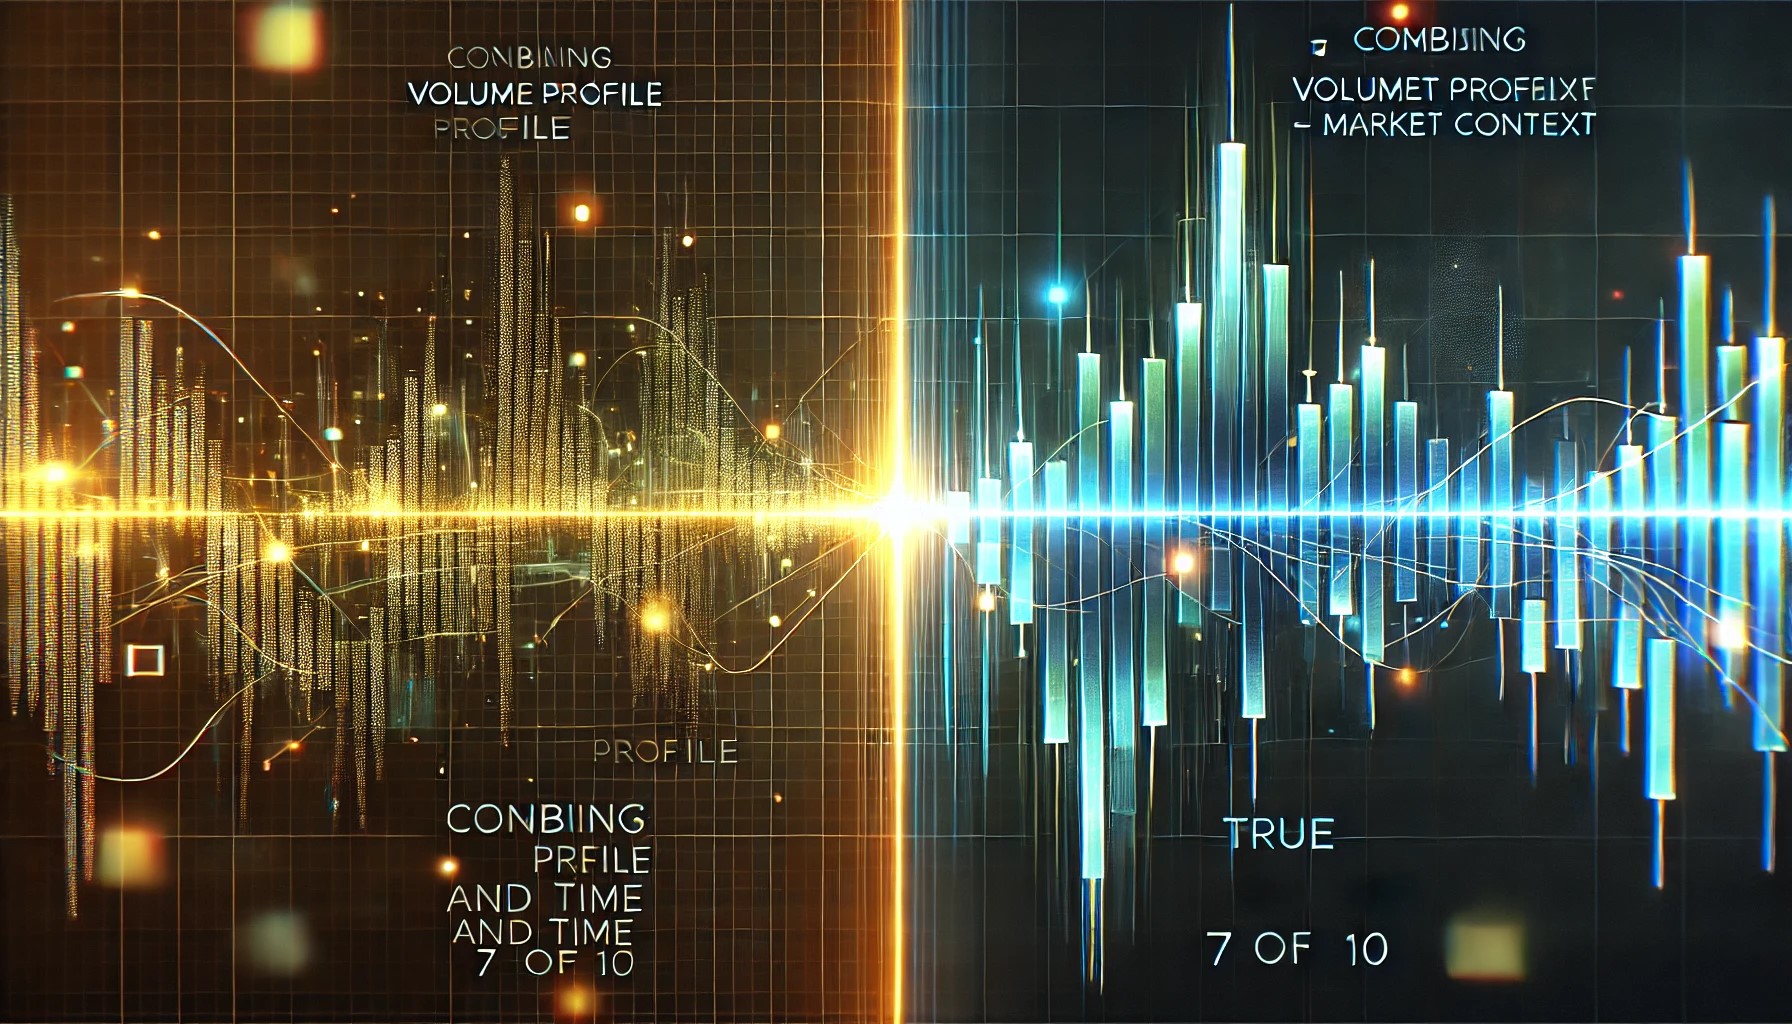
When both align - long time and high volume at the same level - value is confirmed.
When they diverge - short time but heavy volume - it signals an imbalance or fast reprice.
Understanding that difference is the foundation of structural interpretation.
📊 Volume Profile vs. Time Profile
Let’s clarify the two tools and their unique insights.
Tool Focus What It Reveals Volume Profile Participation Where transactions occurred most Time Profile (TPO) Duration Where price spent most time Combined View Agreement Where the market accepted value and built structure
In many modern platforms, Volume Profile is more common - but TPO remains invaluable because time acceptance often leads volume acceptance.
The auction first spends time testing, then builds participation once fairness is found.
⚙️ Reading Context Through Interaction
When Volume and Time agree, structure is stable.
When they disagree, something is changing.
1. Convergent Structure (Balance)
High volume and long time at same levels
Bell-shaped distribution
Indicates agreement and equilibrium
2. Divergent Structure (Transition)
Heavy volume but short duration (fast trading)
Indicates rejection, imbalance, or forced discovery
Often precedes directional move
This simple observation tells you whether the market is comfortable or searching.
📈 Example - Reading True Context
Imagine two sessions at the same price range (4200–4220):
Session A (Balanced):
Price trades all day within range.
Volume evenly distributed.
Time spent across all prices.
Session B (Imbalanced):
Price spikes from 4200 to 4220 quickly.
High volume transacts in seconds.
Little time spent before breakout continues.
In Session A, the auction accepted the range (balance).
In Session B, it rejected the range (discovery).
Same prices - completely different context.
Only visible when you combine volume and time.
🧭 The Power of Time Acceptance
Time is a filter for truth.
When price remains at a level without being rejected, it’s not random - it’s evidence of market comfort.
Use time as your early indicator of:
Emerging balance
Developing value zones
Potential absorption before continuation
If time builds but volume lags, value is forming quietly.
When volume then joins, structure is confirmed.
⚖️ Volume as Confirmation
Volume is the vote of participation.
When it aligns with time, acceptance is complete.
When it spikes abruptly, the auction is exploring.
Traders often react to volume spikes emotionally.
Professionals interpret them structurally:
High volume with short time = aggressive discovery
High volume with long time = stable acceptance
Volume is the evidence. Time is the reasoning.
💡 Using Both for Market Context
To build professional context:
Track Time Acceptance - where price lingers and consolidates.
Track Volume Concentration - where participation confirms value.
Overlay Both - the intersection defines structure.
Use this combined view to:
Identify true value (overlap of time and volume)
Recognize false acceptance (volume without duration)
Anticipate shifts (new volume outside time clusters)
This is how professional context replaces surface-level analysis.
📊 The Three Context States
When combining volume and time, markets show three clear states:
Context Type Volume Behavior Time Behavior Interpretation Accepted Value High Long Balance / Comfort Zone Rejection Zone Low Short Unfair Price / Reversal Potential Discovery Phase Rising Short Transition / Breakout Development
These three structures rotate endlessly - forming the living rhythm of the auction.
💬 Final Thoughts
Volume shows where traders participated.
Time shows where the market cared.
Together, they reveal the heartbeat of the auction - the interaction between motion and meaning.
By merging these profiles, you gain clarity that pure price analysis can never offer.
"Volume tells the story. Time tells why the story mattered."
🌐 About This Series
This article is part of the SharpWick Auction Market Theory Series, teaching the professional framework behind value, balance, and discovery.
👉 Next in the series (8 of 10): “Trader Psychology in the Auction - Emotional Balance vs Structural Logic.”
💡 Support This Work
If this research helps you see market structure through a clearer lens, support independent trading education:
☕ Support SharpWick on Buy Me a Coffee
Your contribution helps keep SharpWick free of noise - focused only on truth, structure, and professional development.
Every contribution adds time, volume, and value to this process.
SharpWick - Tools. Logic. Precision.
🚨 Risk Disclosures
⚠️ Risk Disclosure
Futures and forex trading involve substantial risk and are not suitable for every investor. An investor could potentially lose all or more than their initial investment. Only risk capital should be used for trading, meaning money that can be lost without jeopardizing one’s financial security or lifestyle. Past performance is not necessarily indicative of future results.
📊 Hypothetical Performance Disclosure
Hypothetical performance results have many inherent limitations. No representation is being made that any account will or is likely to achieve similar profits or losses as those shown. Hypothetical trading does not involve financial risk, and it cannot fully reflect the emotional and psychological factors of real trading.
Additional factors, such as market conditions, liquidity, and execution delays, may adversely affect trading results. It is important to understand that all trading involves risk, and no trading strategy or indicator can guarantee profits.
Trade responsibly!