

How markets alternate between agreement and discovery to define opportunity.
🧩 Introduction
Every market breathes.
It expands, pauses, and contracts - searching for value, then resting when value is found.
This pattern isn’t random. It’s structural.
In Auction Market Theory, this rhythm is defined by two core states:
Balance - when price is accepted.
Imbalance - when price is rejected.
Understanding how to recognize these states is one of the most powerful insights a trader can develop.
It reveals whether the market is in discovery or acceptance - and that changes everything about how you trade.
🏛️ What Is Market Balance?
A balanced market is a state of agreement between buyers and sellers.
It’s where both sides find value and transact efficiently.
In balance:
Price rotates within a defined range.
Volume accumulates near the center.
Volatility contracts.
Structure forms symmetrically.
Balance is the market’s home base - a zone of fairness and efficiency.
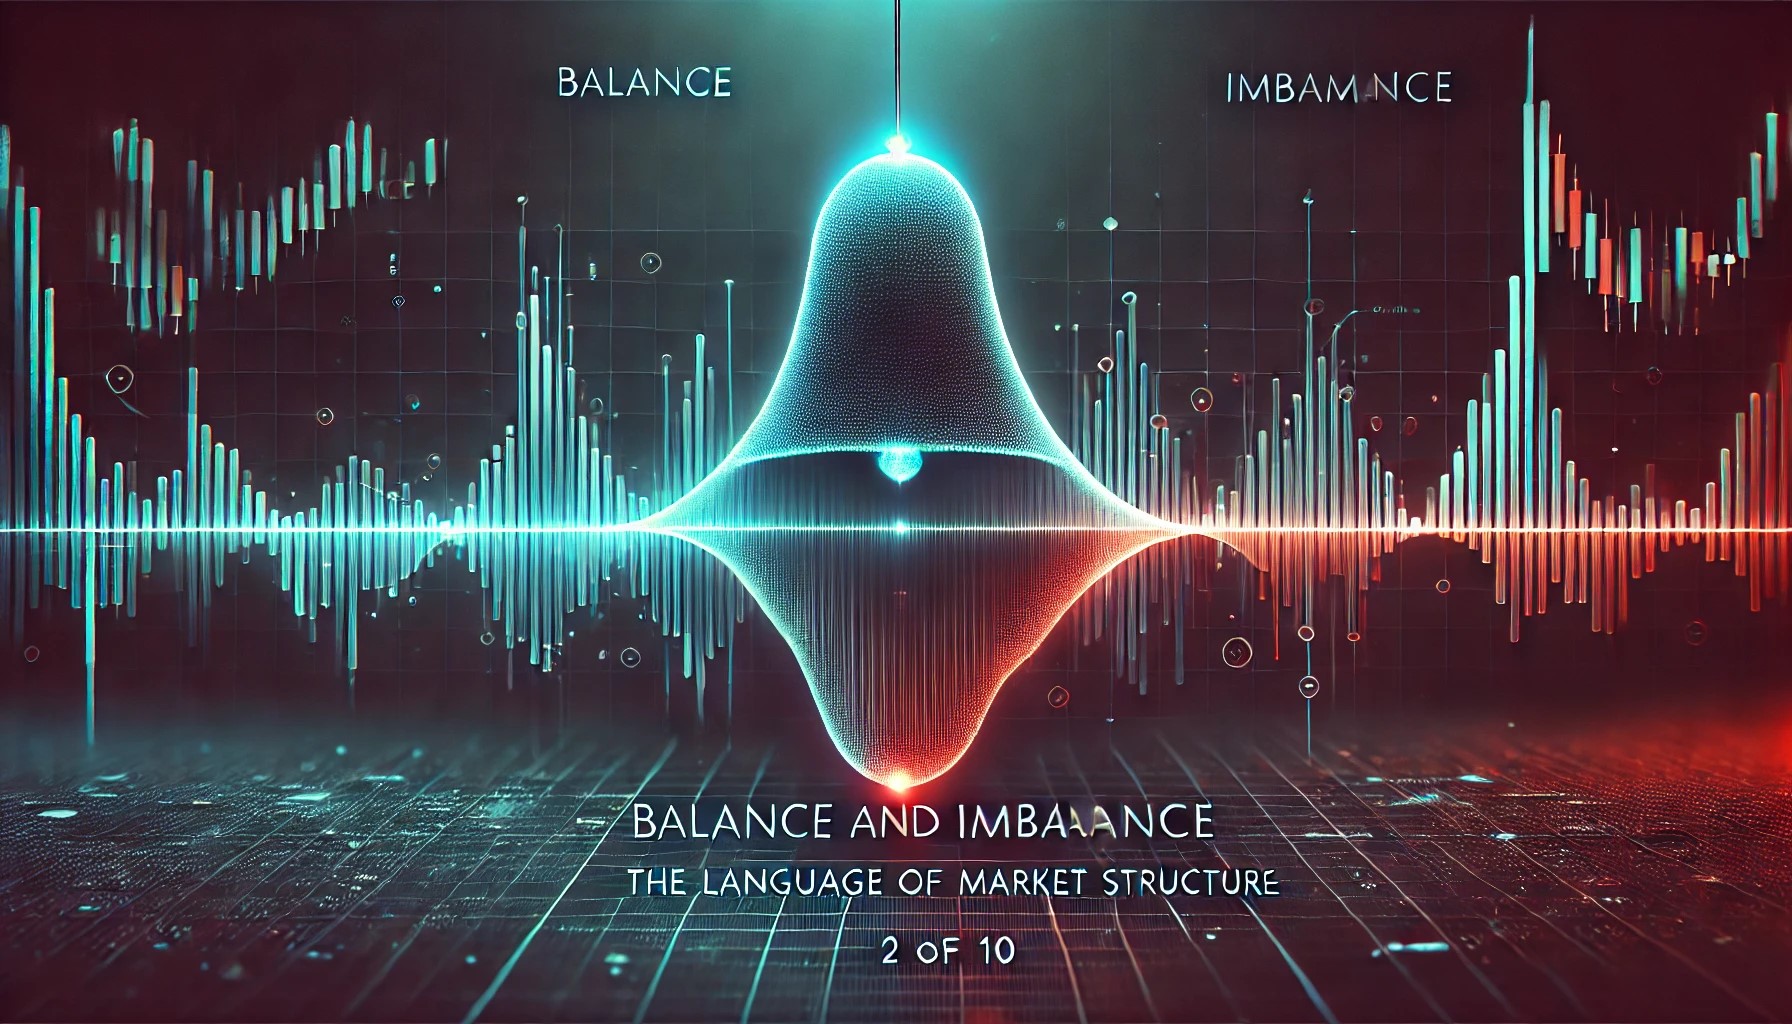
Visually, this appears on a volume profile as a bell-shaped curve - most volume in the middle, tapering toward the edges.
This structure represents value acceptance: the market is content with current prices.
📊 What Is Market Imbalance?
An imbalanced market occurs when agreement breaks down.
One side overpowers the other, pushing price away from the established value area.
In imbalance:
Price moves quickly.
Volume shifts to new areas.
The profile elongates instead of forming a bell.
Volatility expands.
Imbalance is price discovery in action - the market searching for a new fair value zone.
It doesn’t mean “trend” in the traditional sense.
It means the market has left balance to explore where new acceptance may form.
"Balance shows where price belongs. Imbalance shows where price is trying to go."
⚙️ The Cycle of Market Structure
The auction always alternates between these two states.
This constant expansion and contraction create the cycle of market structure:
Balance → Imbalance → New Balance → New ImbalanceEach transition tells you something about intent:
Balance → Imbalance = breakout or discovery
Imbalance → Balance = exhaustion or acceptance
Repeated balances = market building structure
Sustained imbalance = market repricing value
Recognizing these transitions in real time allows traders to anticipate opportunity instead of chasing movement.
📈 Example - From Balance to Imbalance
Consider a futures market trading within a tight range between 4200 and 4220.
Volume profile shows a strong POC at 4210 - value accepted.
Suddenly, aggressive buyers lift offers beyond 4220, and price expands to 4240 with rising delta and expanding range.
What just happened?
The auction broke balance.
Buyers initiated discovery.
The market entered imbalance.
If the new area attracts sustained volume near 4240, that becomes the next balance zone.
If volume fades and rejection occurs, price returns to the prior range - failed discovery.
This is the language of structure - clear, logical, and observable.
🔍 Identifying Balance and Imbalance on a Chart
You can visually identify these states through:
Volume Distribution
Bell-shaped = balance
Elongated or directional = imbalance
Price Rotation
Rotational swings = balance
Directional extension = imbalance
Volatility
Compression = balance
Expansion = imbalance
Time at Price
Longer dwell time = acceptance (balance)
Short dwell time = rejection (imbalance)
When multiple signals align, the structural phase becomes clear.
🧭 Trading Implications
Your trading tactics should always align with the structural phase.
Market Phase Behavior Trading Approach Balance Price rotates within value Favor mean reversion setups - fade extremes, target POC Imbalance Price moves directionally Favor continuation or pullback entries aligned with expansion Transition Structure breaking or forming Trade smaller, confirm acceptance before committing
The goal is not to predict which phase will appear next - it’s to recognize the current one and adapt accordingly.
💡 Practical Framework
Here’s a simple 3-step framework for applying this concept:
Identify whether the market is balanced or imbalanced using profile shape, range, and time.
Observe which side is initiating control (buyers or sellers).
React by trading with structure, not against it.
In practice:
In balance: fade extremes, manage risk tightly.
In imbalance: follow expansion, hold through continuation zones.
In transition: reduce exposure and wait for clarity.
💬 Final Thoughts
Balance and imbalance are the heartbeat of the auction.
They tell you whether the market is at rest or in motion - accepting or rejecting price.
Once you learn to read this rhythm, the market stops looking chaotic and starts making structural sense.
"Balance builds structure. Imbalance builds opportunity. Knowing the difference builds discipline."
🌐 About This Series
This article is part of the SharpWick Auction Market Theory Series, dedicated to explaining how markets organize, discover value, and transition between structure and opportunity.
👉 Next in the series (3 of 10): “The Role of Value - How and Where Price Accepts.”
💡 Support This Work
If this content helps you see structure more clearly and trade more confidently, consider supporting continued SharpWick research:
☕ Support SharpWick on Buy Me a Coffee
Your support allows SharpWick to continue producing independent, logic-driven content for professional traders.
Every act of support adds balance to the process - and precision to the craft.
🚨 Risk Disclosures
⚠️ Risk Disclosure
Futures and forex trading involve substantial risk and are not suitable for every investor. An investor could potentially lose all or more than their initial investment. Only risk capital should be used for trading, meaning money that can be lost without jeopardizing one’s financial security or lifestyle. Past performance is not necessarily indicative of future results.
📊 Hypothetical Performance Disclosure
Hypothetical performance results have many inherent limitations. No representation is being made that any account will or is likely to achieve similar profits or losses as those shown. Hypothetical trading does not involve financial risk, and it cannot fully reflect the emotional and psychological factors of real trading.
Additional factors, such as market conditions, liquidity, and execution delays, may adversely affect trading results. It is important to understand that all trading involves risk, and no trading strategy or indicator can guarantee profits.
Trade responsibly!