Disclaimer: This is not financial advice. I create charts for educational purposes, aiming to enhance my understanding. I frequently utilize existing materials and adapt them to suit my requirements. These charts are not intended for financial gain. Credit is always attributed to the original authors in the source scripts. I am simply sharing my perspective on the data.
Smart Momentum Indicator has been updated. In this update, I have included MCDX Plus indicator. A small description of the different indicators are as below.
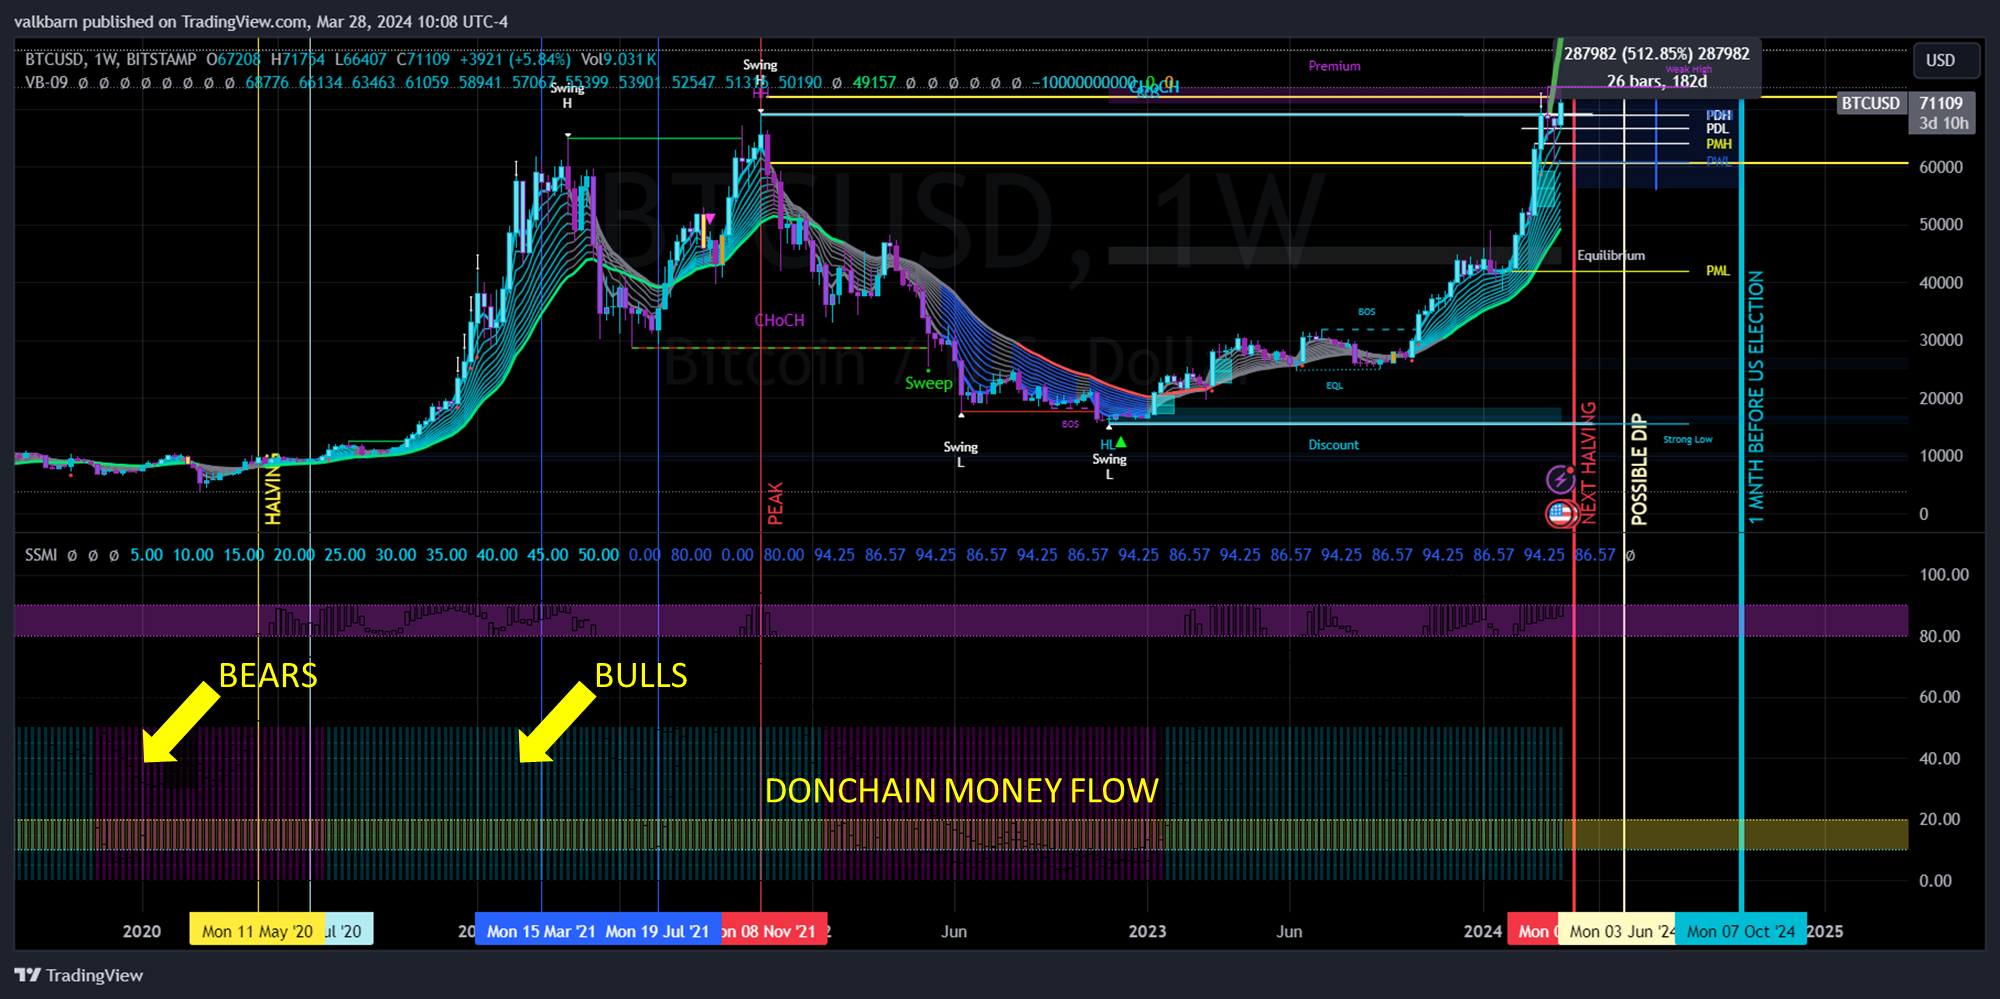
Donchain Money Flow: Donchain Money Flow is a technical indicator used in financial analysis to measure the inflow and outflow of money into a security or market. It helps traders and investors assess the strength of buying and selling pressure by analyzing the relationship between a security's price and its trading volume over a specific period.

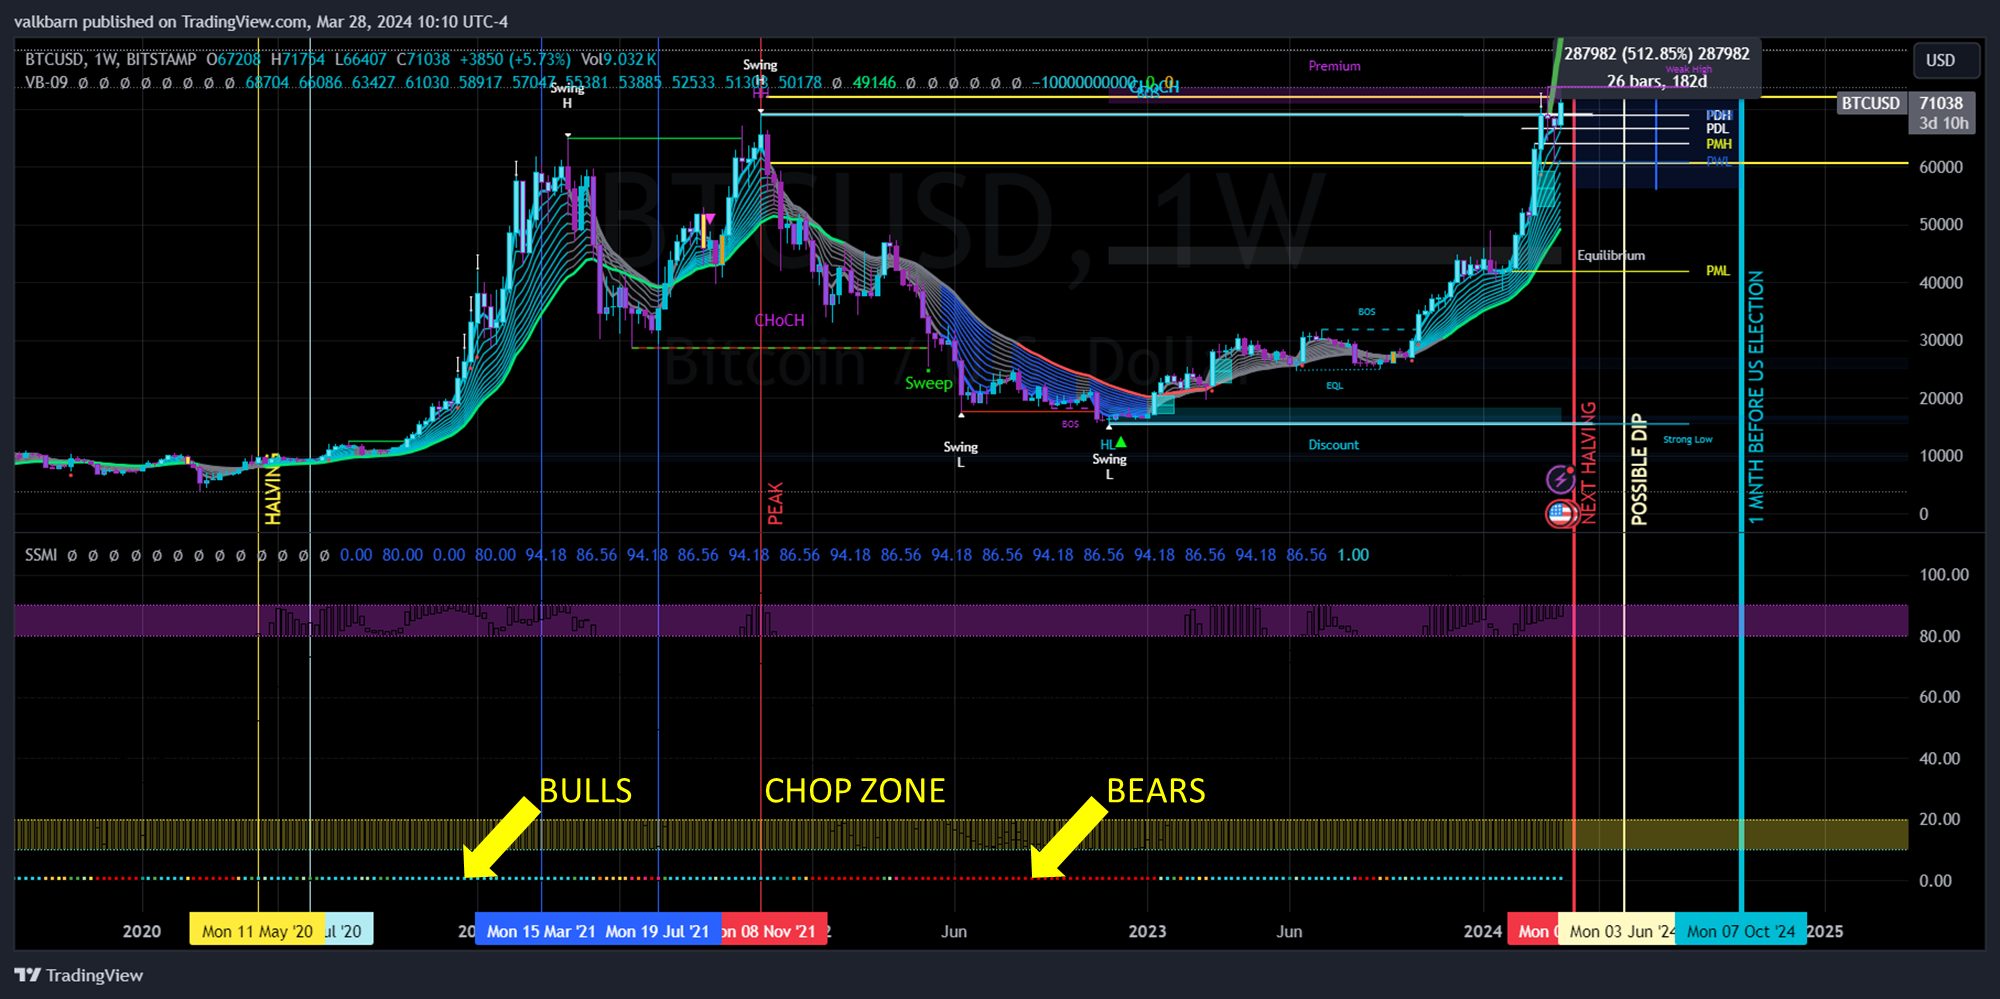
Chop Zone: Chop Zone refers to a market condition characterized by erratic price movements within a narrow range, making it difficult for traders to establish clear trends or make decisive trading decisions. It often occurs during periods of low liquidity or indecision among market participants.

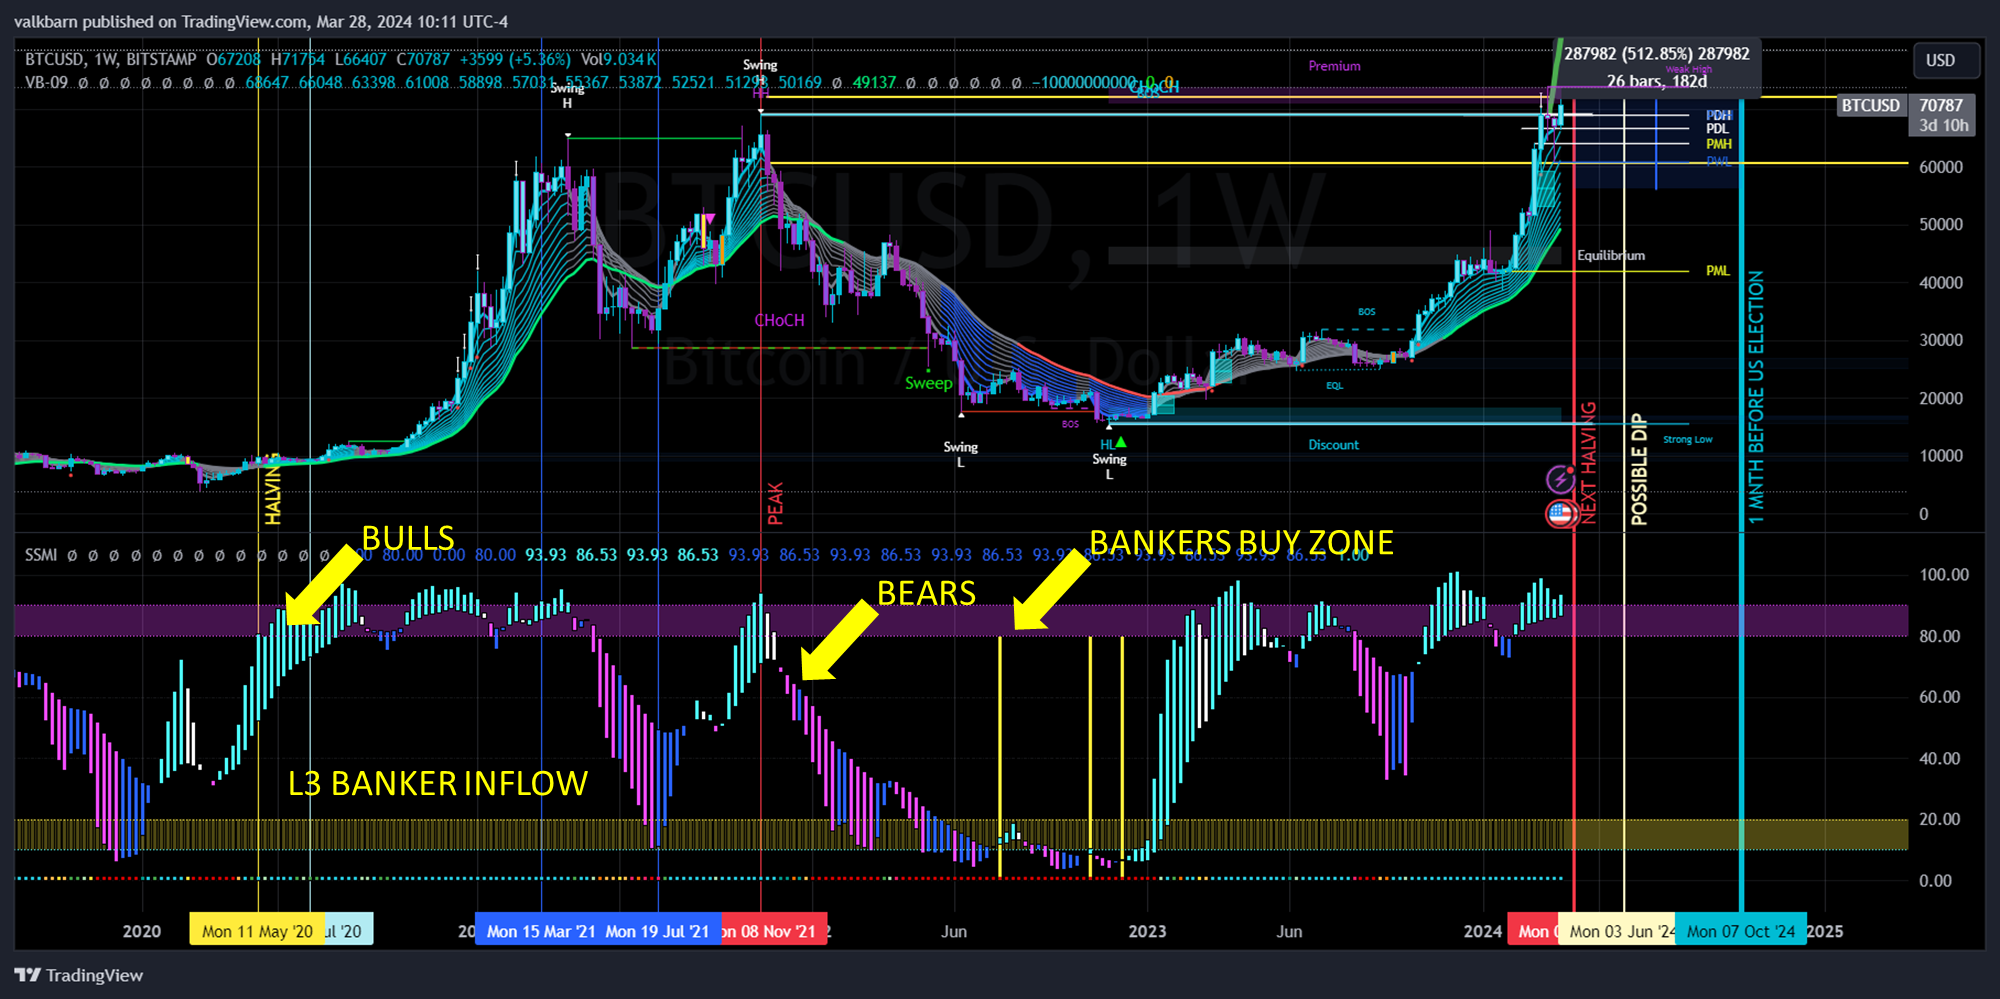
Bankers Inflow: Bankers Inflow typically refers to the movement of funds or investments into a market or financial institution by institutional investors, such as banks or large investment firms. This influx of capital can influence market dynamics, liquidity, and asset prices.

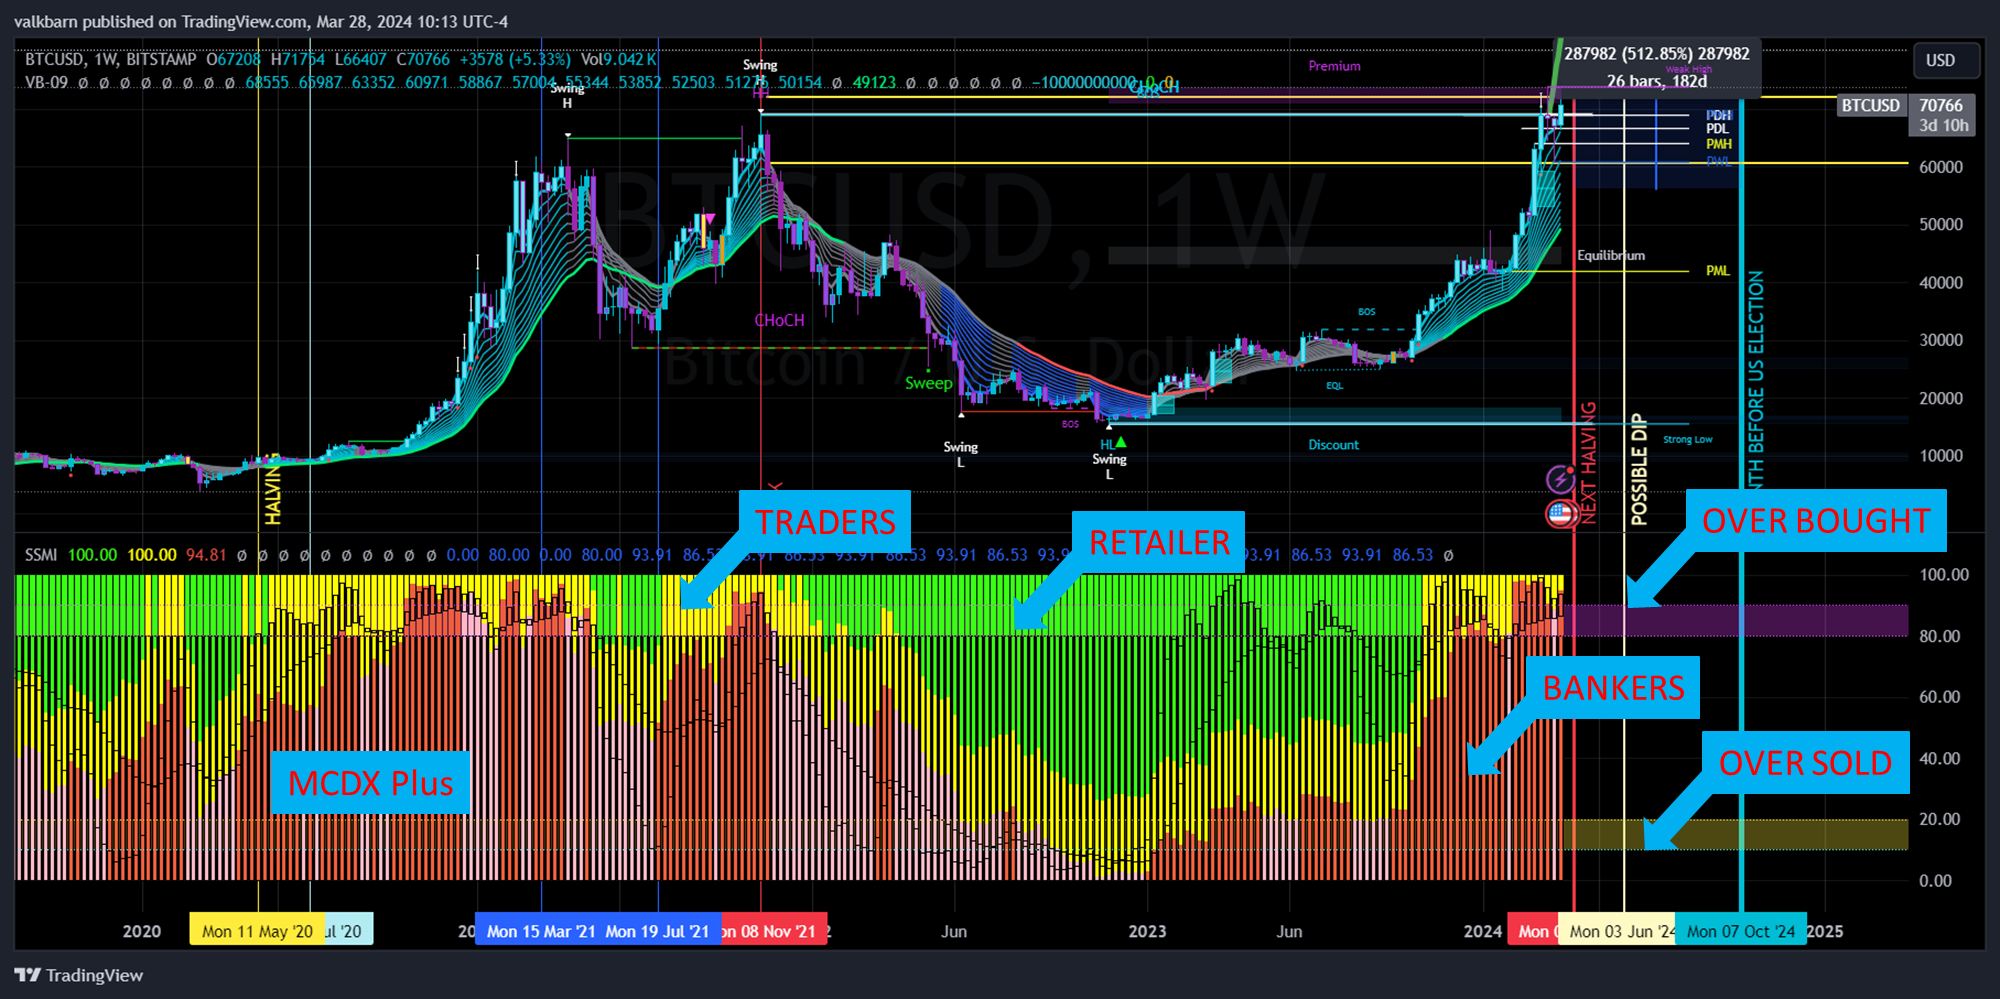
MCDX Plus: MCDX Plus is a financial instrument or index that combines components of credit default swaps (CDS) and other derivatives to provide investors with exposure to credit risk in specific markets or sectors. It allows investors to hedge against the risk of default on debt obligations or speculate on credit market movements.

