

Hey everyone! Quick one from this week's PowerLib build.
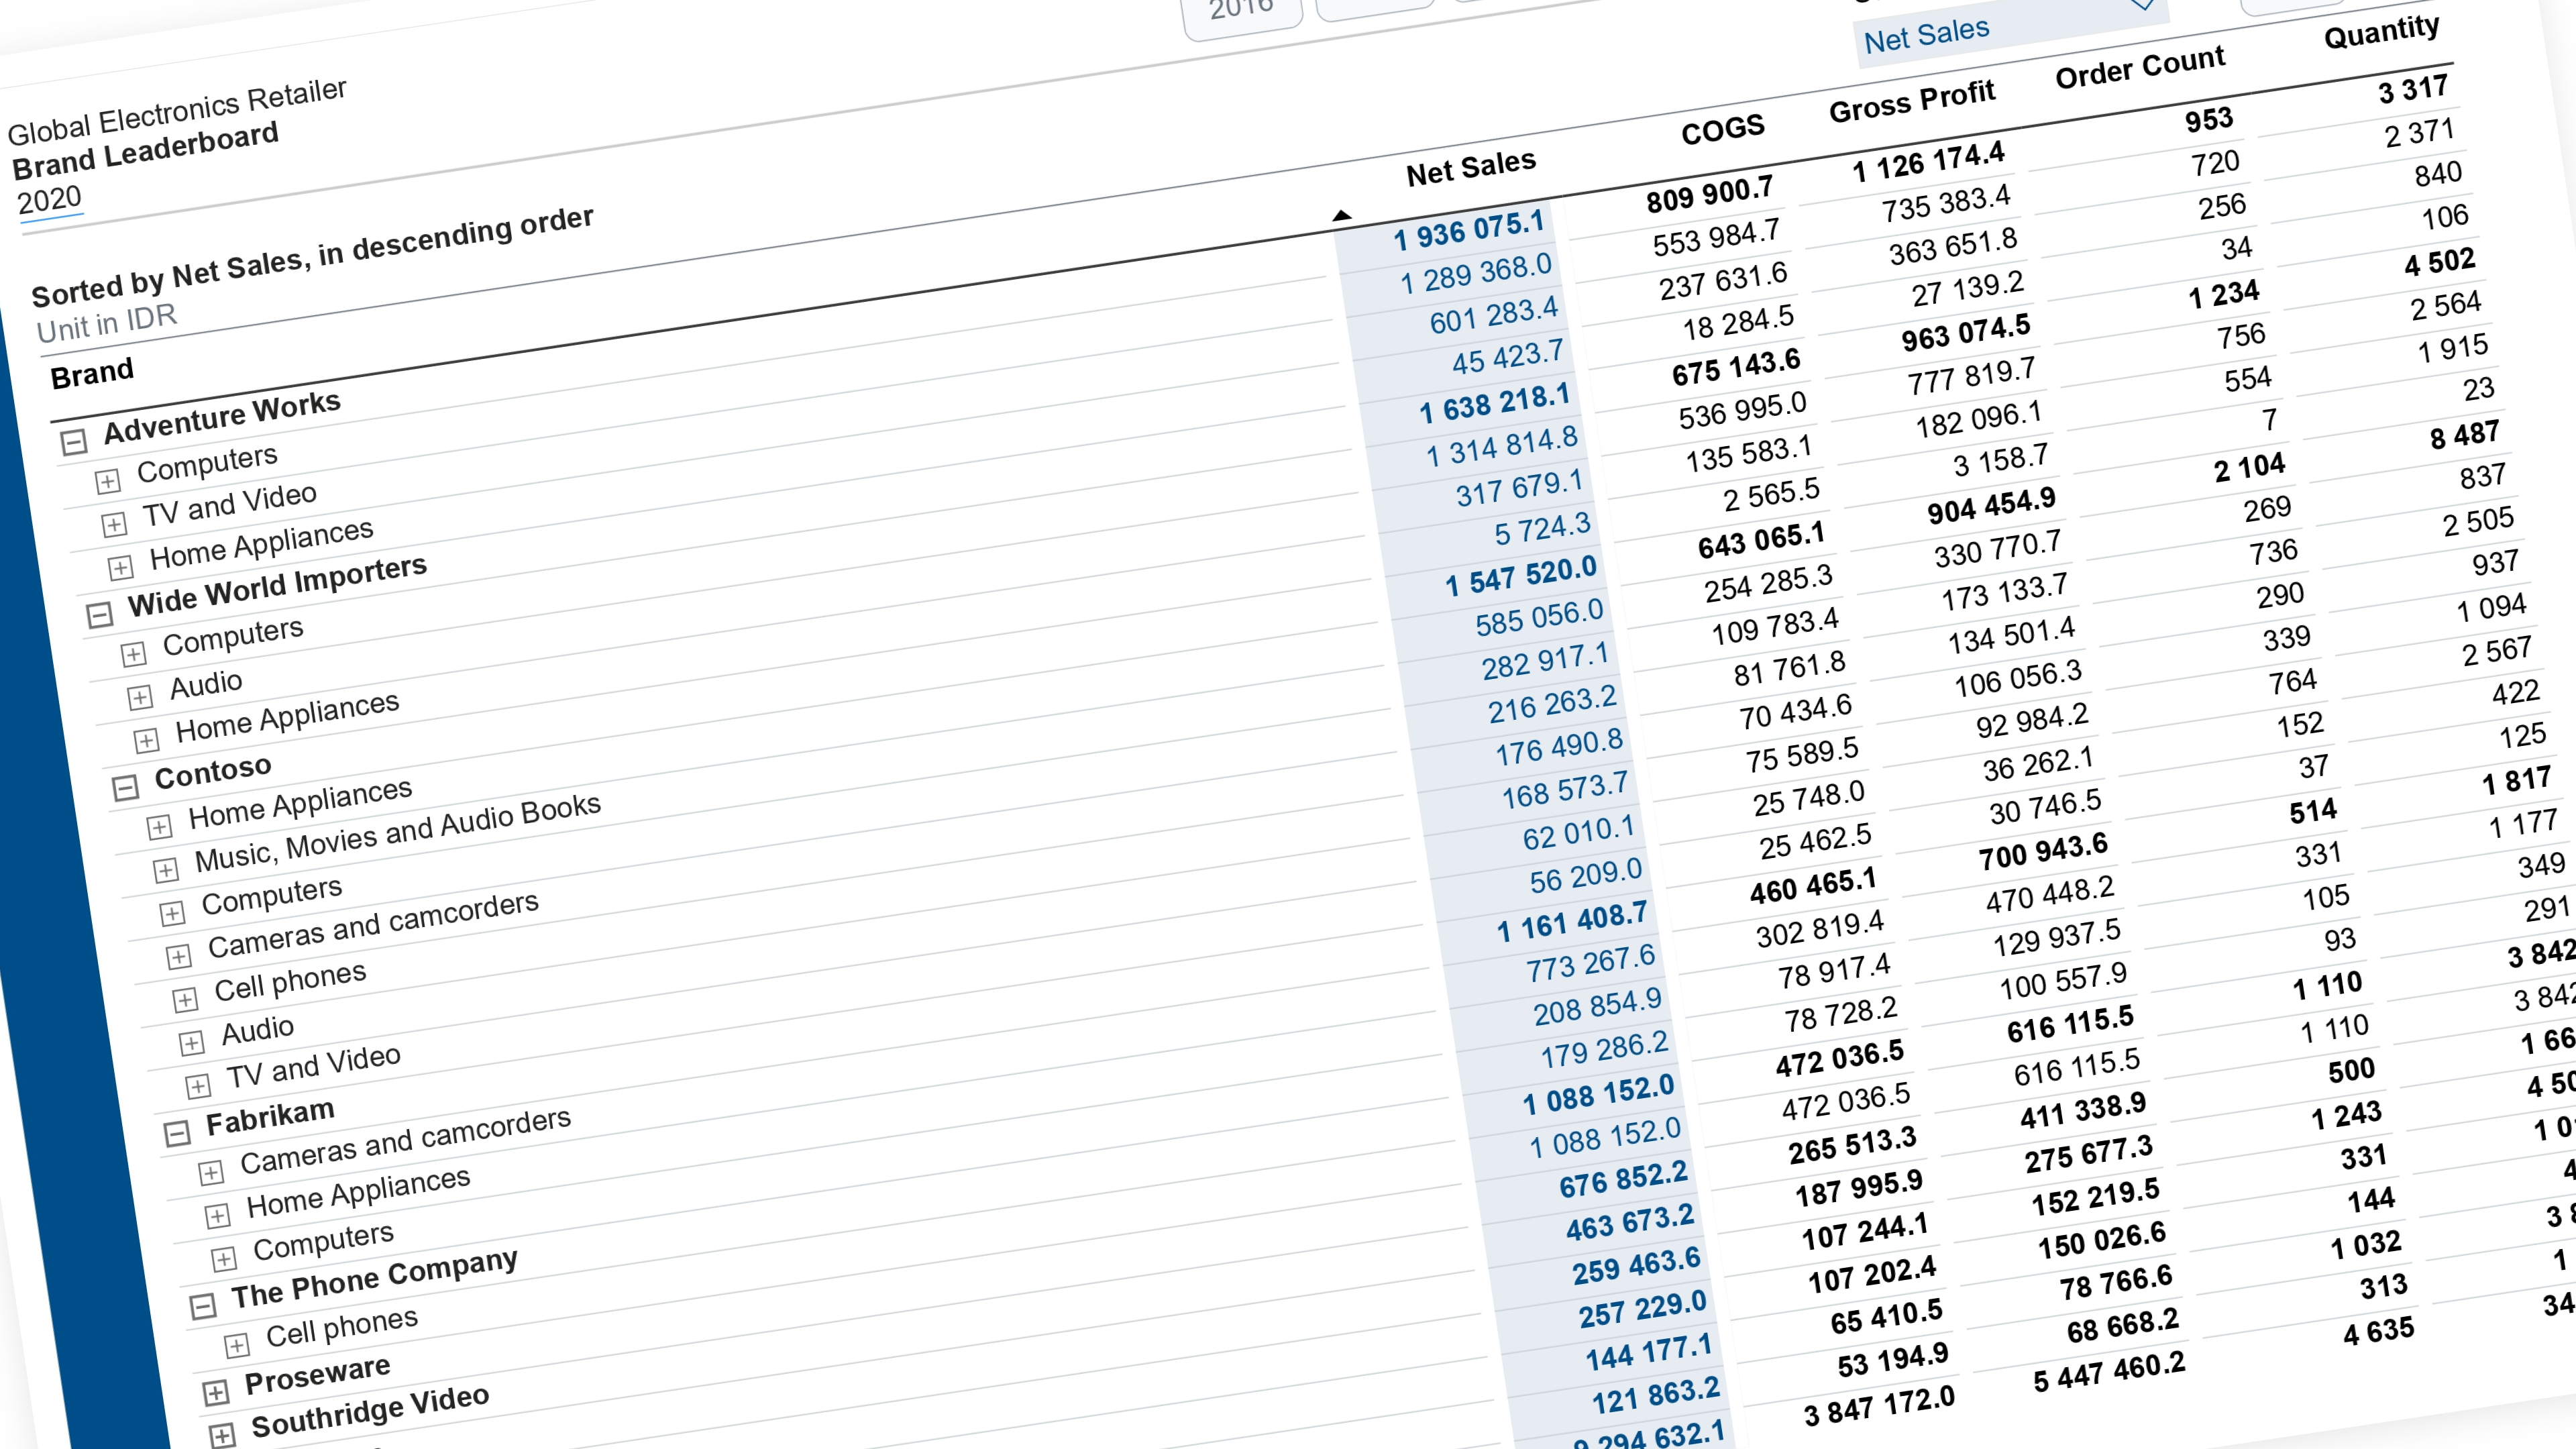
I've been chasing a stakeholder request I bet a lot of you have heard before: "can this matrix sort by whichever number I care about right now?" So I built it, and while I was at it, made the sorted column light up in colour too.
Here's the problem I kept running into: a Power BI matrix can sort by one column, once. The moment someone cares about a different metric than the one you sorted by, or drills one level deeper into the hierarchy, that sort just... doesn't follow them anymore. You'd have to keep rebuilding it by hand.
So I built a slicer that lets you pick a metric, in this case Net Sales, COGS, Gross Profit, Order Count, or Quantity, on a Products matrix (Brand to Category to Subcategory to Product Name), and whichever one you pick highlights its whole column in colour and sorts the matrix by it, highest first. Drill from Brand into Category, and it keeps sorting by that same metric, now within Category, with no rebuild needed.
The fun part technically: this isn't really about the sort itself. A matrix can already sort by any measure you throw in Values. The actual trap is that "rank within Brand" and "rank within Category" are two completely different groups of rows, and if your rank measure doesn't know which group it's currently looking at, it just compares against the wrong crowd. I hit this myself: every single row came back ranked #1 because the measure was comparing Brand totals against individual product rows. Fixed it by having one measure ask "which level am I even looking at right now" before it ranks anything.
Also ran into a properly sneaky one: the metric names typed into the slicer table have to match, letter for letter, everywhere else that measure checks for them. Miss one, and it doesn't error. It just silently ranks everything #1 for that one metric. Nothing tells you it's wrong until you actually click through every option in the slicer yourself.
Full writeup with all the DAX, plus both of those gotchas, is linked below if you want to build this yourself. It's not tied to any one dataset, so it drops into whatever hierarchy you're working with (products, stores, accounts, whatever you're drilling into).
As always, thank you for supporting PowerLib. This kind of deep dive content is only possible because of you.