


Fill-in-the-Blank Market Analysis
безкоштовно
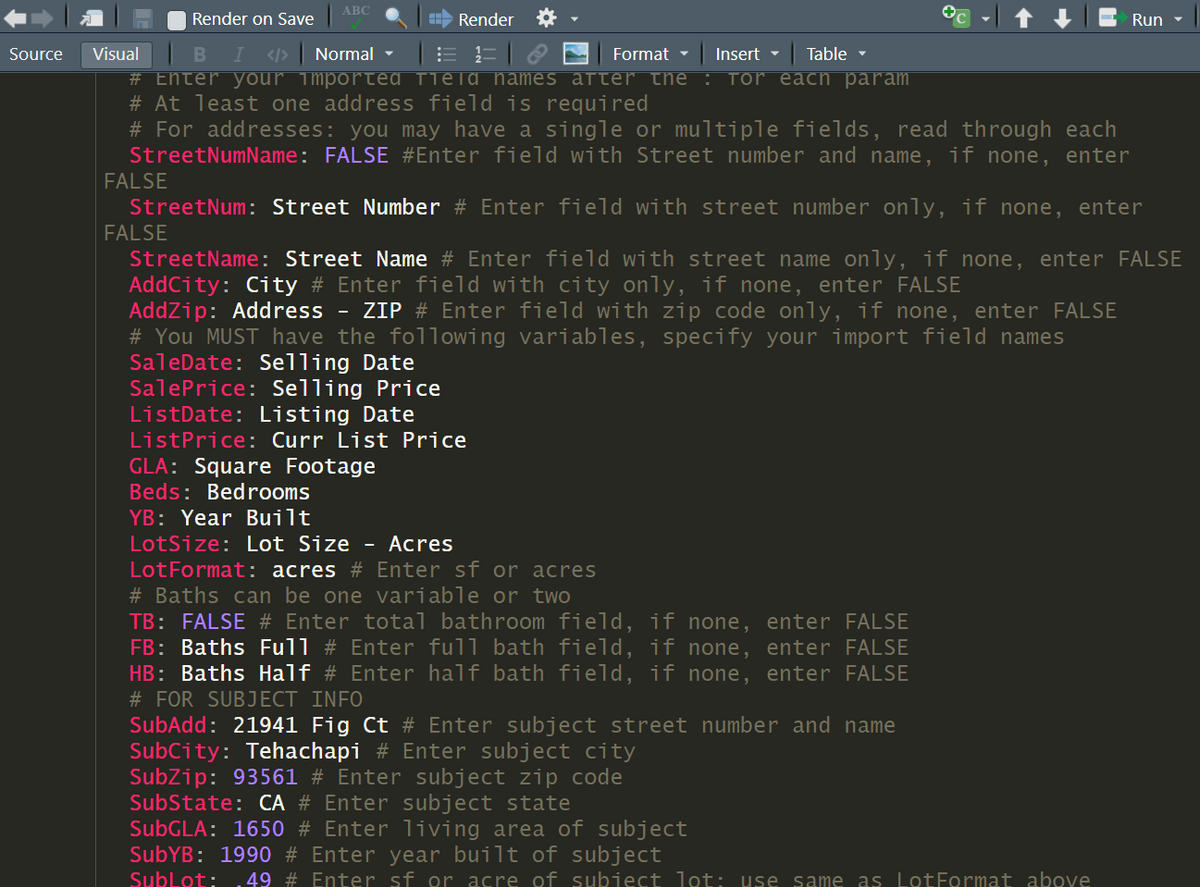
Get started learning how to develop a real estate market analysis in RStudio. This quarto document enables you to map the field names in your data to work with the code and render an HTML document with histograms, scatter plots, box plots, bar plots, time adjustments and maps.
Here is the accompanying video: FITB Market Analysis
* Note: the newest version of the document is slightly different than the one used in the video, but essentially works the same way.
безкоштовно
Введіть справедливу ціну
$
безкоштовно