

I made a visualisation website that explores the behaviour of all fractions of the Dutch Parliament -- specifically, how they correlate over the years. This visualisation is available as Python code, or simply the interactive website!
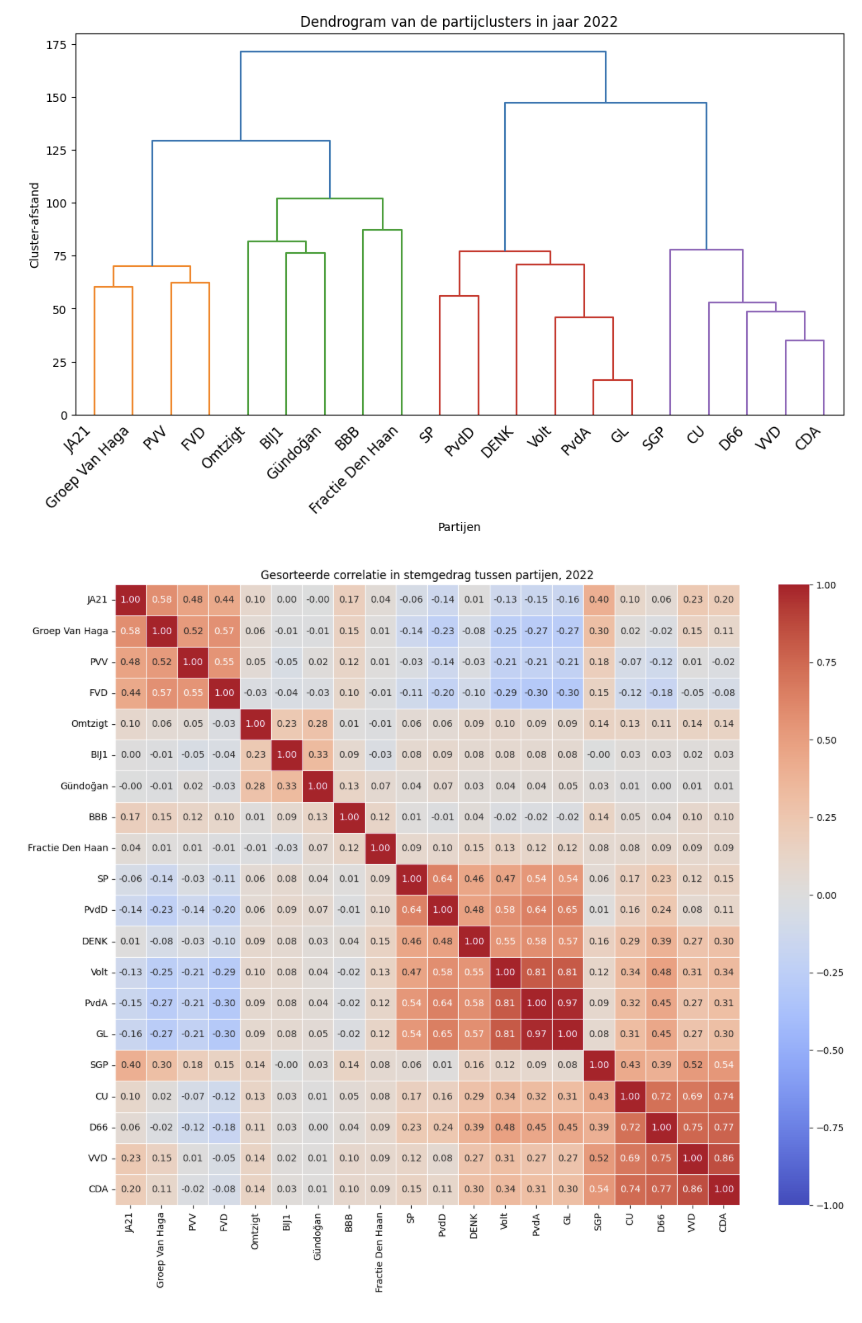
Note that of course this wouldn't be possible without the permissive dataset (CC BY 4.0) from Louwerse et al.!