
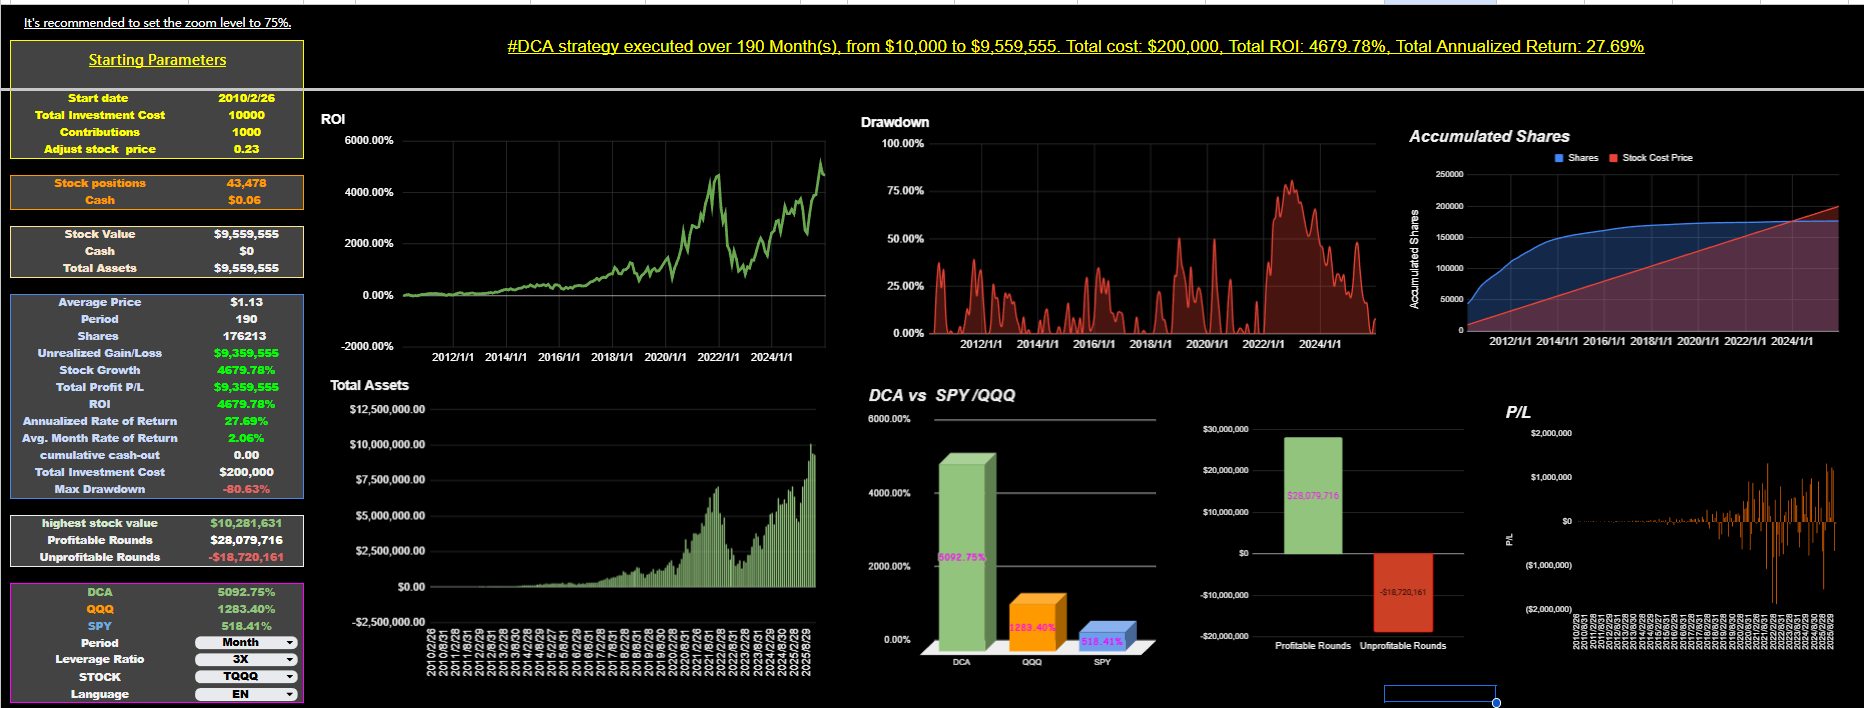
 I Just wanted to say thanks for all the support! Ever since I put out the simulated signal strategy sheet, a bunch of Reddit folks have been reaching out, and I really appreciate it.
But Reddit recently warned me for replying to too many DMs, so I need to chill a bit for now. Hope you can understand!
https://docs.google.com/spreadsheets/d/1GptVwLSyHpc1MZzB0DKaj9wv3ckgyLv0Q_kFceooRYc/edit?usp=sharing
First of all, I know there are probably many DCA google sheets out there that are way better than mine. It’s nothing fancy — honestly, it’s pretty rough.
It’s just a small Christmas gift from me to everyone (Available until January 1, 2026, then reserved for subscribers only), hoping it makes it a bit easier for you to follow your strategy.
For example, if you’ve already set up monthly auto‑investing with your broker, then whenever you get the SMS notification, all you need to do is enter the buy price and the number of shares in the “Action” column. The sheet will automatically pull everything into the data section and generate charts, returns, annualized returns, total cost, average price, and more.
You might say that using your broker’s website or mobile app is already enough for buying and selling — and that’s totally fair. But DCA is a long‑term strategy, and using Sheets lets you keep a full history of every trade and analyze your performance over time.
Of course, mobile apps are great for quick price alerts or placing trades on the spot. But if your main goal is to track and manage your DCA records, Google Sheets is definitely more convenient and flexible.
Broker websites and mobile apps are great for executing trades and quickly checking real‑time prices or alerts — that’s what they’re built for.
But DCA is a long‑term, disciplined strategy, and the focus isn’t on watching the market every day. It’s about:
Accurately recording each purchase — date, amount, price, and shares/units
Calculating your true average cost (including fees, taxes, etc.)
Tracking your long‑term performance — total contributions, current value, returns, volatility, and more
Creating separate tabs for different assets so you can compare strategies, frequencies, or performance across multiple investments
A lot of experienced investors export their trade history from their broker or exchange and run their own analysis in Sheets. That alone says everything.
=========================================================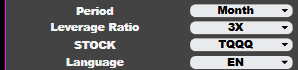 First, choose your preferred language, the leveraged ETF you’re tracking, and the time period you want to display (this affects how the returns are shown).
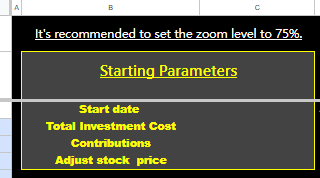 Step 1:
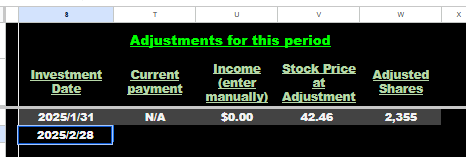
Start by entering your initial investment date, your starting capital, your monthly DCA amount, and the price at which you bought.
In this example, I’m assuming you start on January 31, 2025 and track until December 22. You put in $100,000 upfront, and then add $1,000 every month as your DCA — basically a one‑shot + DCA setup.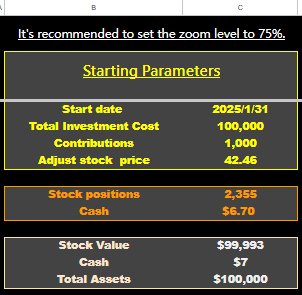 The screenshot shows that once you enter the numbers, the sheet automatically calculates the first purchase — in this case, buying 2,355 shares of TQQQ at the opening price of 42.46, with $6.7 left in cash.
It then displays the value of your TQQQ position plus your remaining cash, so your total assets line up with your initial investment amount (one shot portion).
 Both the Action section and the Data section will automatically show the first entry for your starting investment period. Super simple.
 Step 2:
After you enter the date, Google Sheets will automatically pull the closest available trading price based on that date. The sheet will automatically fill in the default $1,000 contribution based on your initial settings. If you want to increase or decrease the amount for that month, you can just change it manually. The sheet will then calculate the corresponding number of shares for you.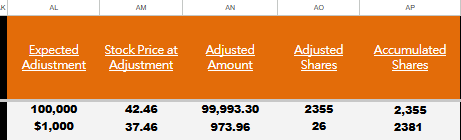
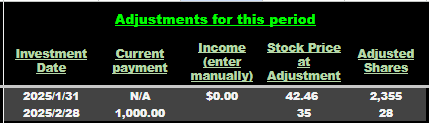 The sheet first calculates the purchase using the closest available trading price — in this example, that comes out to 26 shares of TQQQ.
But once you enter the actual execution price from your broker’s SMS (say your broker filled the order at $35), you just type $35 into the Action column. The sheet will automatically update the calculation and adjust the position to 28 shares instead of the original 26.
 In other words, the Action column is where you make any adjustments — things like correcting the execution price, entering dividends you received, or changing your contribution amount. Once you update it there, the sheet will automatically pull everything into the main data table.
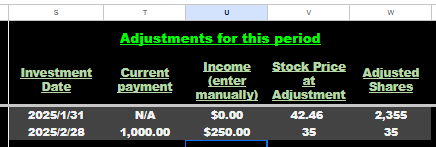 For example, if you receive $250 in dividends and decide to combine it with your monthly contribution to buy more TQQQ, you just enter the dividend amount and the actual execution price into the sheet after you complete the purchase. The sheet will automatically recalculate the number of shares and update the data section for you.
-------------------------------------------------------------------------------------------------------- If the market dropped a lot last month and you decide to increase your contribution, you can simply change this month’s amount from $1,000 to $5,000. Once you update it, the sheet will automatically recalculate the position — for example, increasing the purchase from 36 shares to 175 shares.
 But since there’s no dividend this month and the actual execution price for TQQQ is $29, the share count will be adjusted to 173 shares.
 ----------------------------------------------------------------------------------------------------------
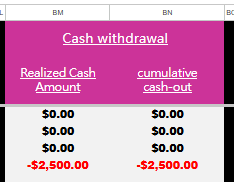 If it’s April (or any day) and you need to withdraw some money, no problem. Just enter the amount you want to take out as a negative number in the BM column. Then type the sell price into the Action column, and the sheet will automatically calculate how many shares need to be sold.
As shown in the example, if you want to withdraw $2,500, just enter “-2500” in the BM column. Then type the actual TQQQ sell price into the Action column (let’s say $30). The sheet will automatically calculate the sale and adjust it to 50 shares.
=============================================================
In this release, we have finally resolved the stock split problem. TQQQ tends to undergo a split every few years, and each time a split occurs, our signal strategy — which relies on Google to fetch stock prices — was affected because Google provides the post‑split adjusted price.
After the split date, the fetched price becomes smaller, which previously caused data inconsistencies in the system. Users had to manually correct the affected data columns to fix the issue. To prevent future confusion, we have redesigned the table logic.
Now, users only need to enter the split date, ratio, and default value in the “Split Ratio” column, and the system will automatically adjust all calculations after the split.
Columns Affected by Stock Splits
1. MoM (Month‑on‑Month Comparison)
• Because the price suddenly becomes smaller after a split, the comparison with the previous (pre‑split) price incorrectly shows a sharp drop.
2. Pre‑Adjustment Price
• After a split, the settlement price is already “split‑adjusted,” but the share count from the previous period remains pre‑split. This mismatch makes the overall value appear smaller.
3. Cumulative Shares
• The cumulative share count does not increase after the split, which previously created confusion in the calculations.
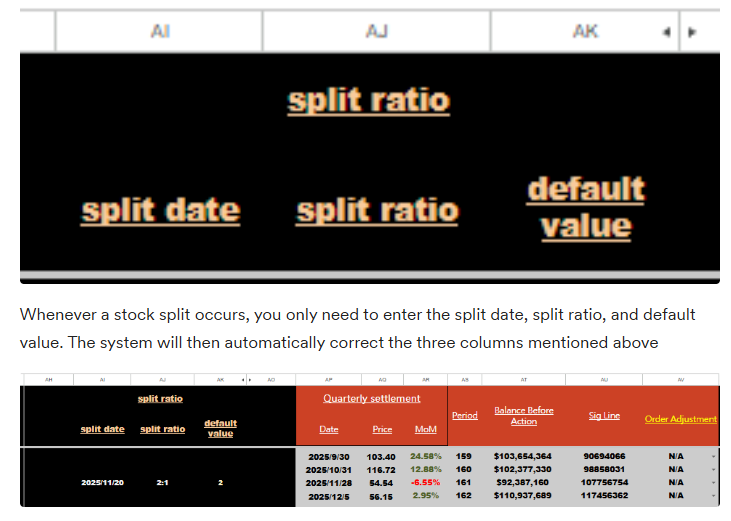 At the October 31 settlement, the closing price remained USD 116.72. On November 20, 2025, a 2‑for‑1 stock split was announced. The system initially shows the split ratio as 1, but this must be corrected to 2, since each share is doubled after the split. In other words, 1 share becomes 2 shares, so the ratio is 2/1 = 2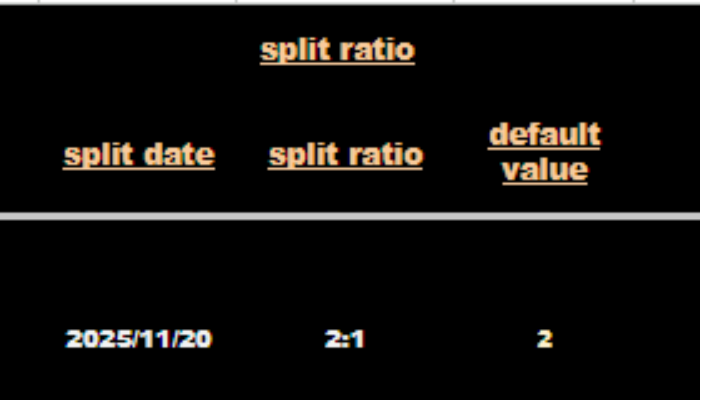
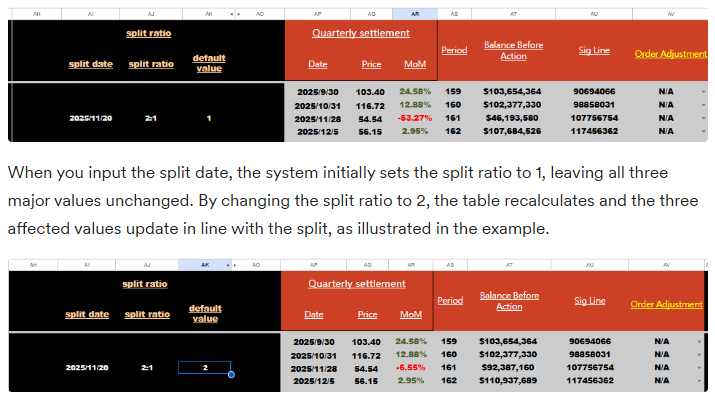 Actions to Take When TQQQ Announces a Stock Split
When a stock split announcement is received, you should first prepare the table by completing the following two steps:
- Replace Google‑fetched prices with pasted values
- Convert the prices normally fetched from Google into fixed numeric entries.
- This prevents Google’s post‑split adjusted prices from overwriting or disrupting your previously entered manual data.
- Create a backup copy
- Make a duplicate of the table before applying changes.
- If data becomes inconsistent after the split, you can restore your manually corrected values from the backup
==============================================================