

<5 min read.
Trading is a very particular job and skill in more than one way.
To begin with, as a job, which other career can provide you with a uncapped income while being able to work wherever you want right from the palm of your hand (phone, although not recommended)?
And not only that, but also, allow you to balance how much work you want to do?
A job like this could only come after mastering a very particular set of skills.
Although the markets are the same for everyone, the way each trader develops it's skill is very different.
On this post, I'll reveal some of the things I find useful to mark on my charts so it can serve you as a starting point or, even if you have an established method, perhaps, add or test new ideas. Which to me, is probably the most rewarding part of the job.
First of all, because I like to understand things from the core, let's describe the main components of what's behind chart markings on a chart. These are related to three main variables:
Price.
Time.
Volume.
Starting from this, there are different markings I like to do on each category (although some are related to more than one).
Let's take a look at each of them by category.
Before, let me suggest you bookmark any post you could find useful (oh! retweets are very welcomed by the way). Sharing the entry on X will also be greatly appreciated.
Price:
-Structure: having this on the first place is not by chance. The biggest return on time invested to learn about a topic in trading was with structure.
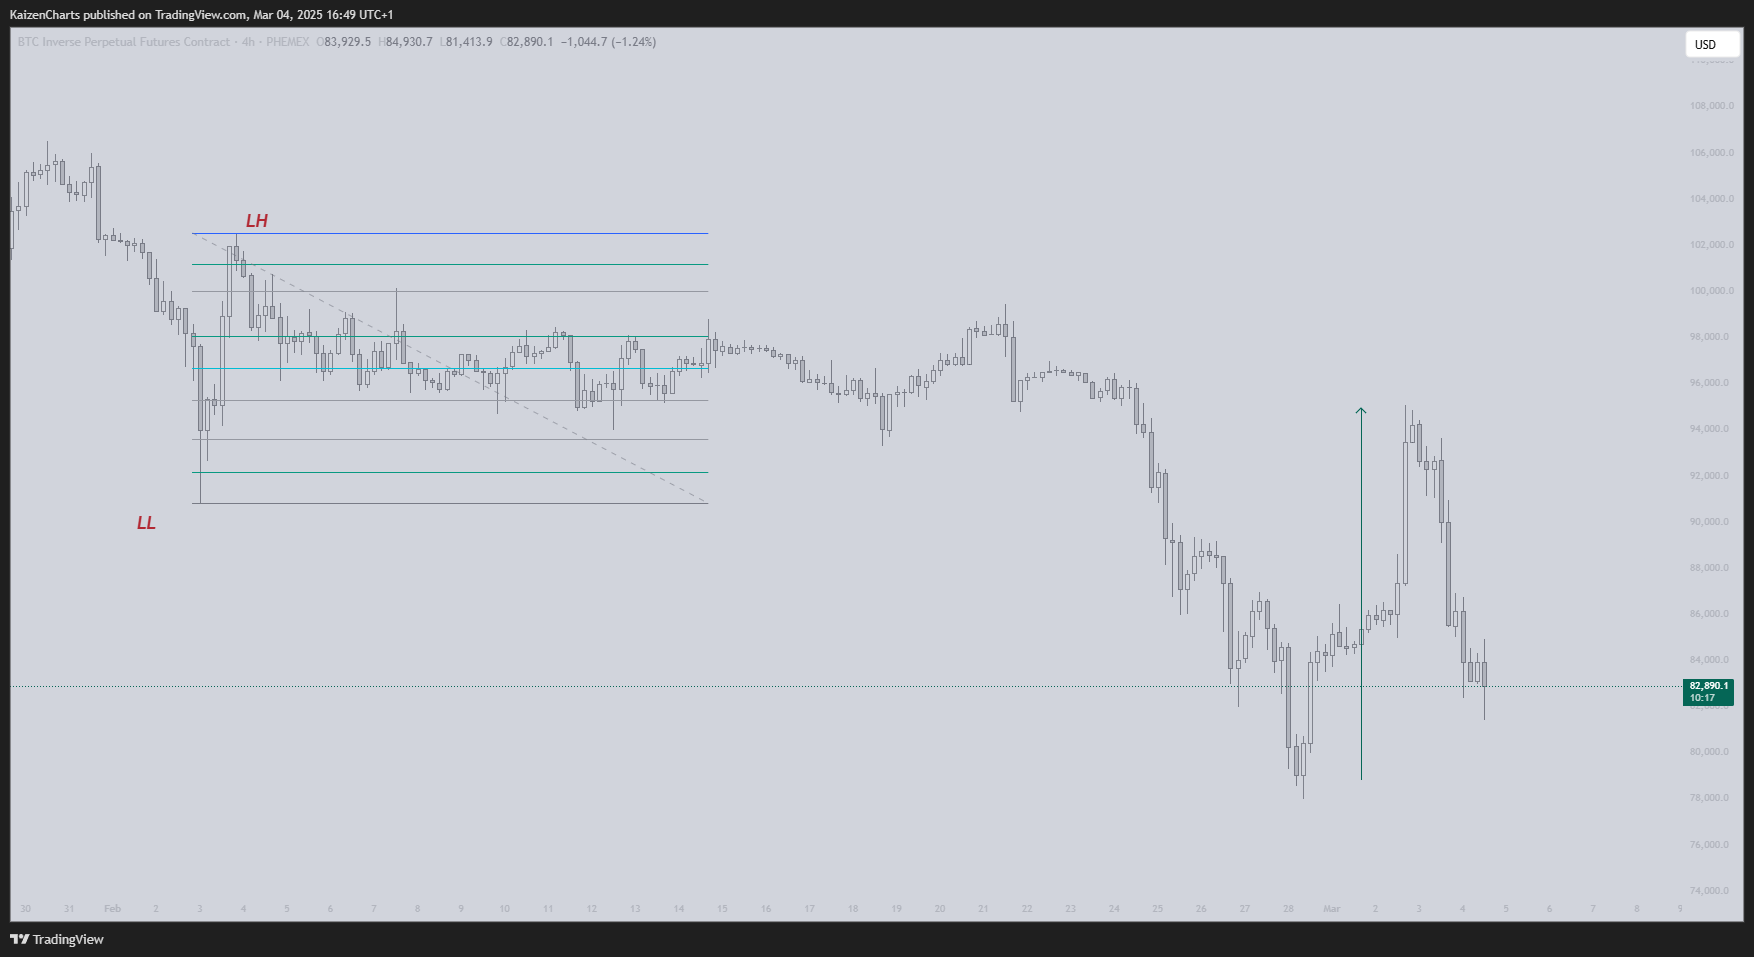
First thing I do each day, is to go from higher to lower time frames recognizing the pivots (LL-LH on bearish trend and HH-HL on bullish trend).
This will not only help you identify the bias correctly but also identify price levels of interest. You want to recognize if price is on an impulse or retrace move.
-Fibonaccis: one of the ways I use this is on swings, pulling from one pivot to another (LL-LH or HH-HL).
See the picture below. This will be peculiar to some as I'm not using the last low but instead the previous swing ( I do use the full swing too).
When price comes back for a retest this fib can help you determine resistance levels.
-Previous Day Equilibrium: price will often test it, upon reaction one can have an idea of where market is heading.
Time:
Quite a few things in this category. Some, quite well known.
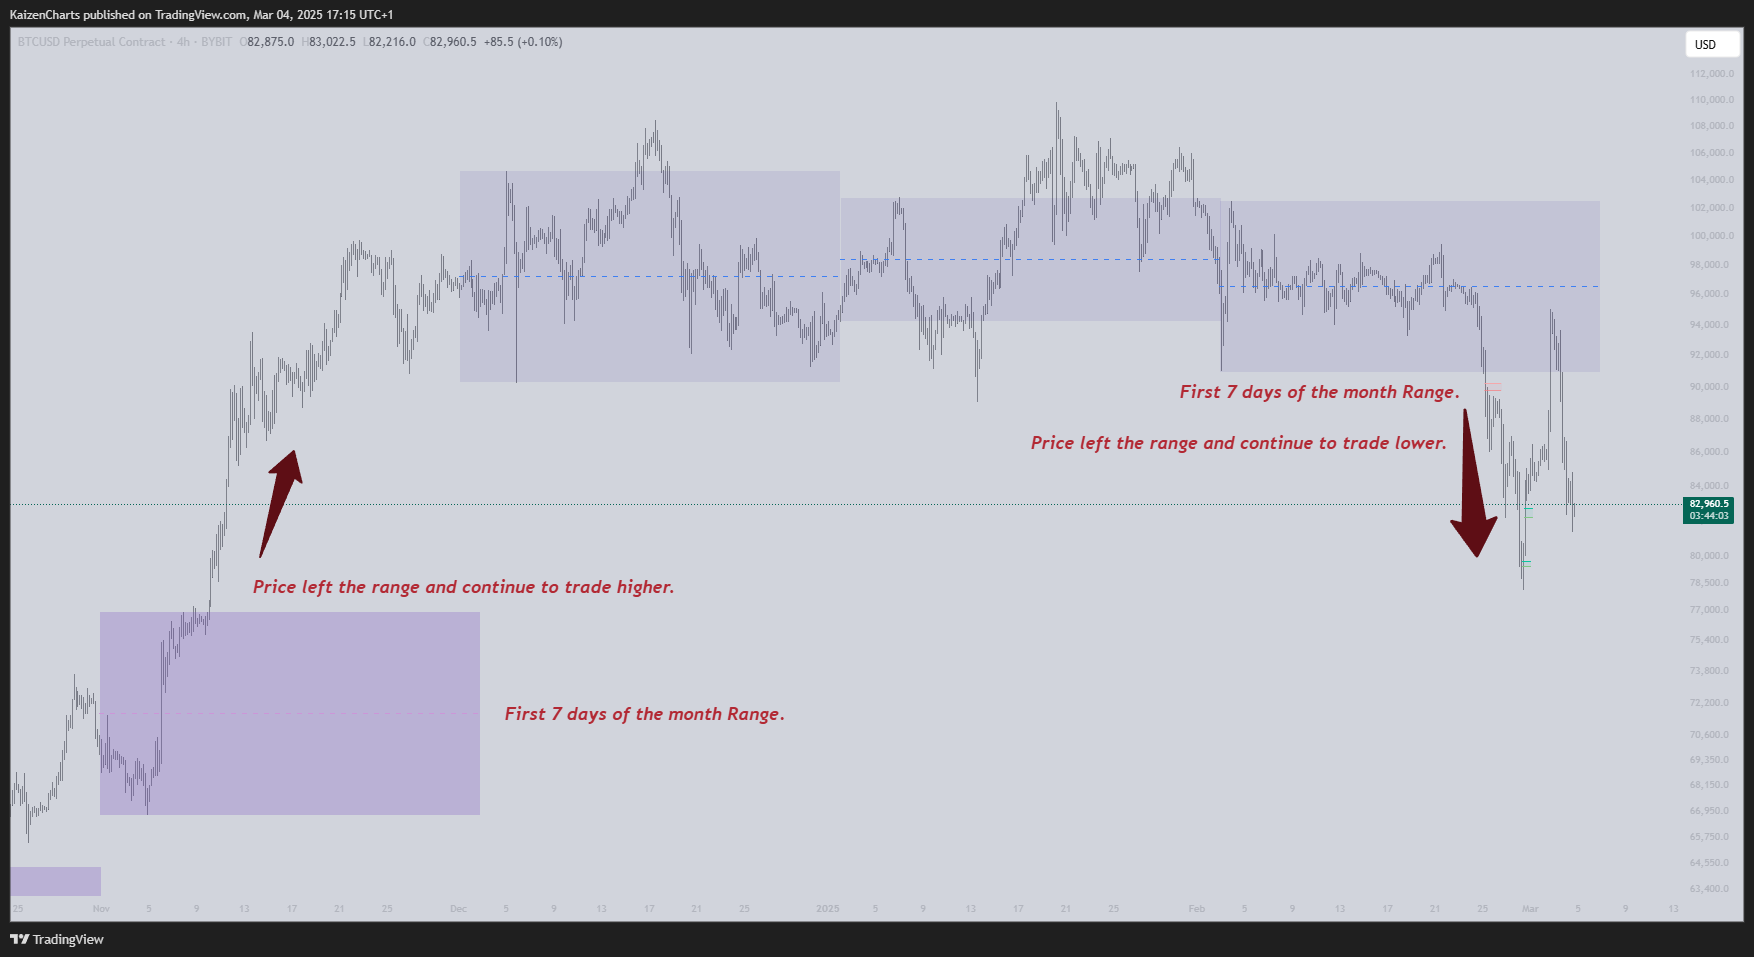
1.First 7 days of the month: you probably haven't heard of this one. When I started to use the Monday Range, I tested similar ideas which could work for the month's price action and I found this one.
The idea is the same as the Monday Range, see on the illustration. Described also on next point, Monday Range.
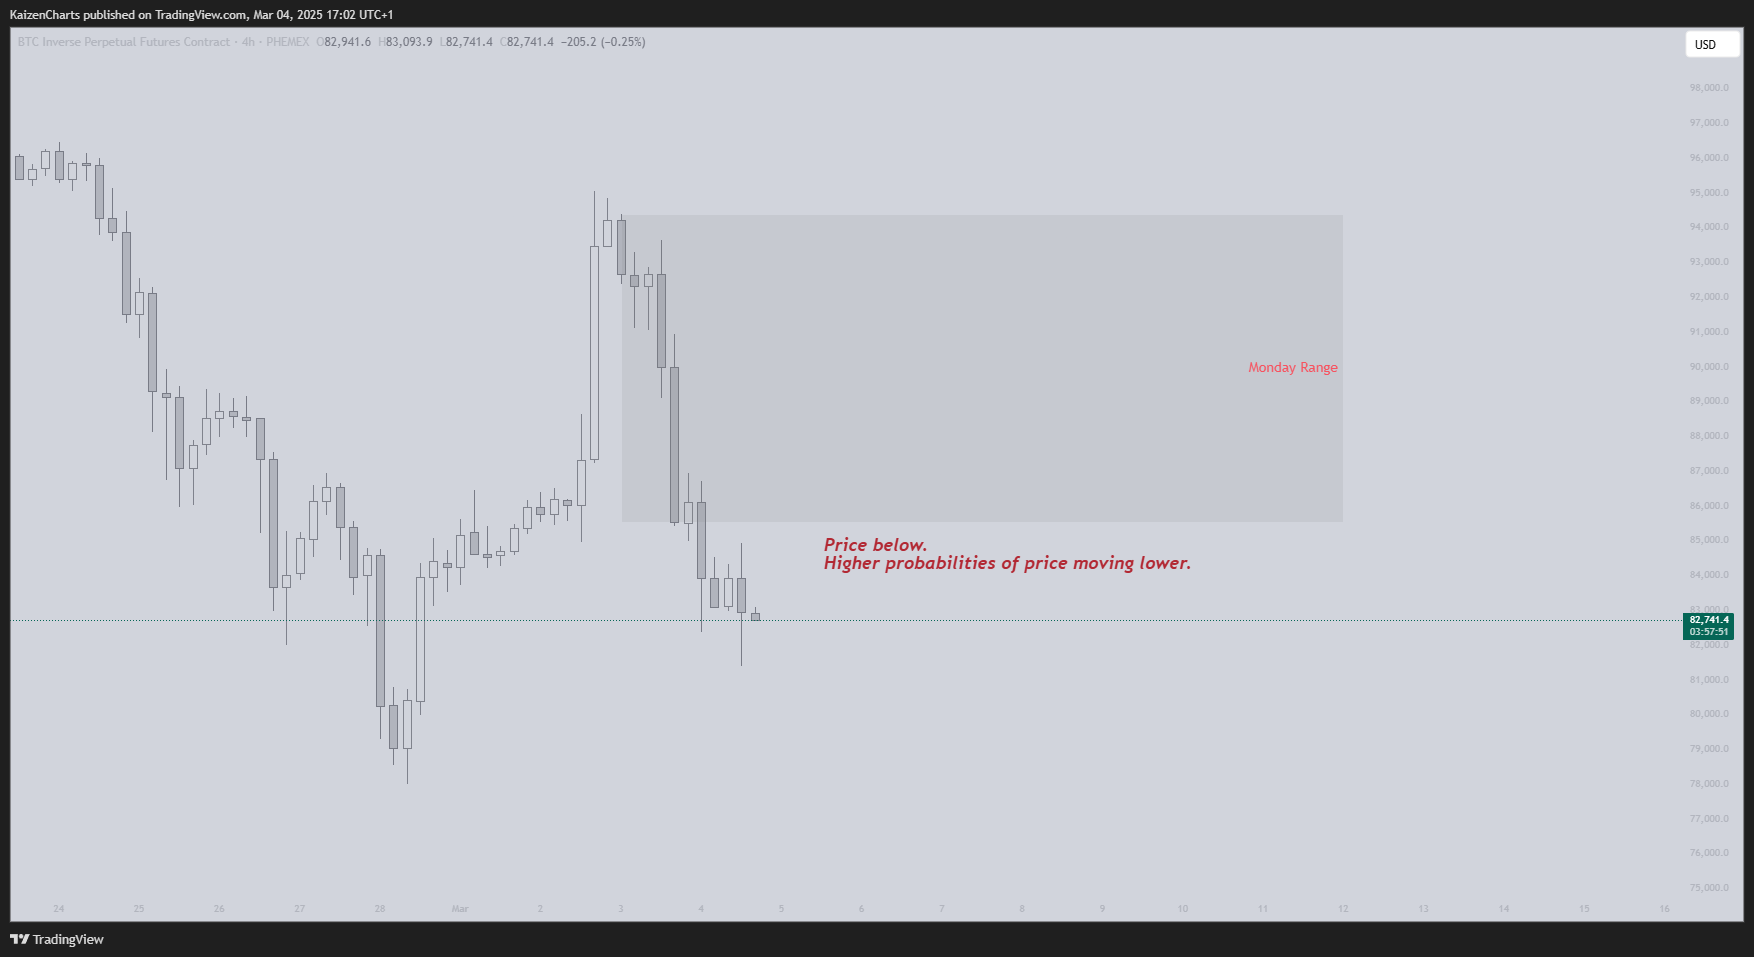
2.Monday Ranges: these is the price range during a given time period, Monday's opening and closing.
The reason why I mark this is because, very often, how price develops on Monday will affect the rest of the week.
Very simple, if price is below MR it's more likely it will continue lower and therefore short trades have more probabilities of being winners and better returns. The opposite will be true if price is trading above MR. This is a simplified idea but you get the point.
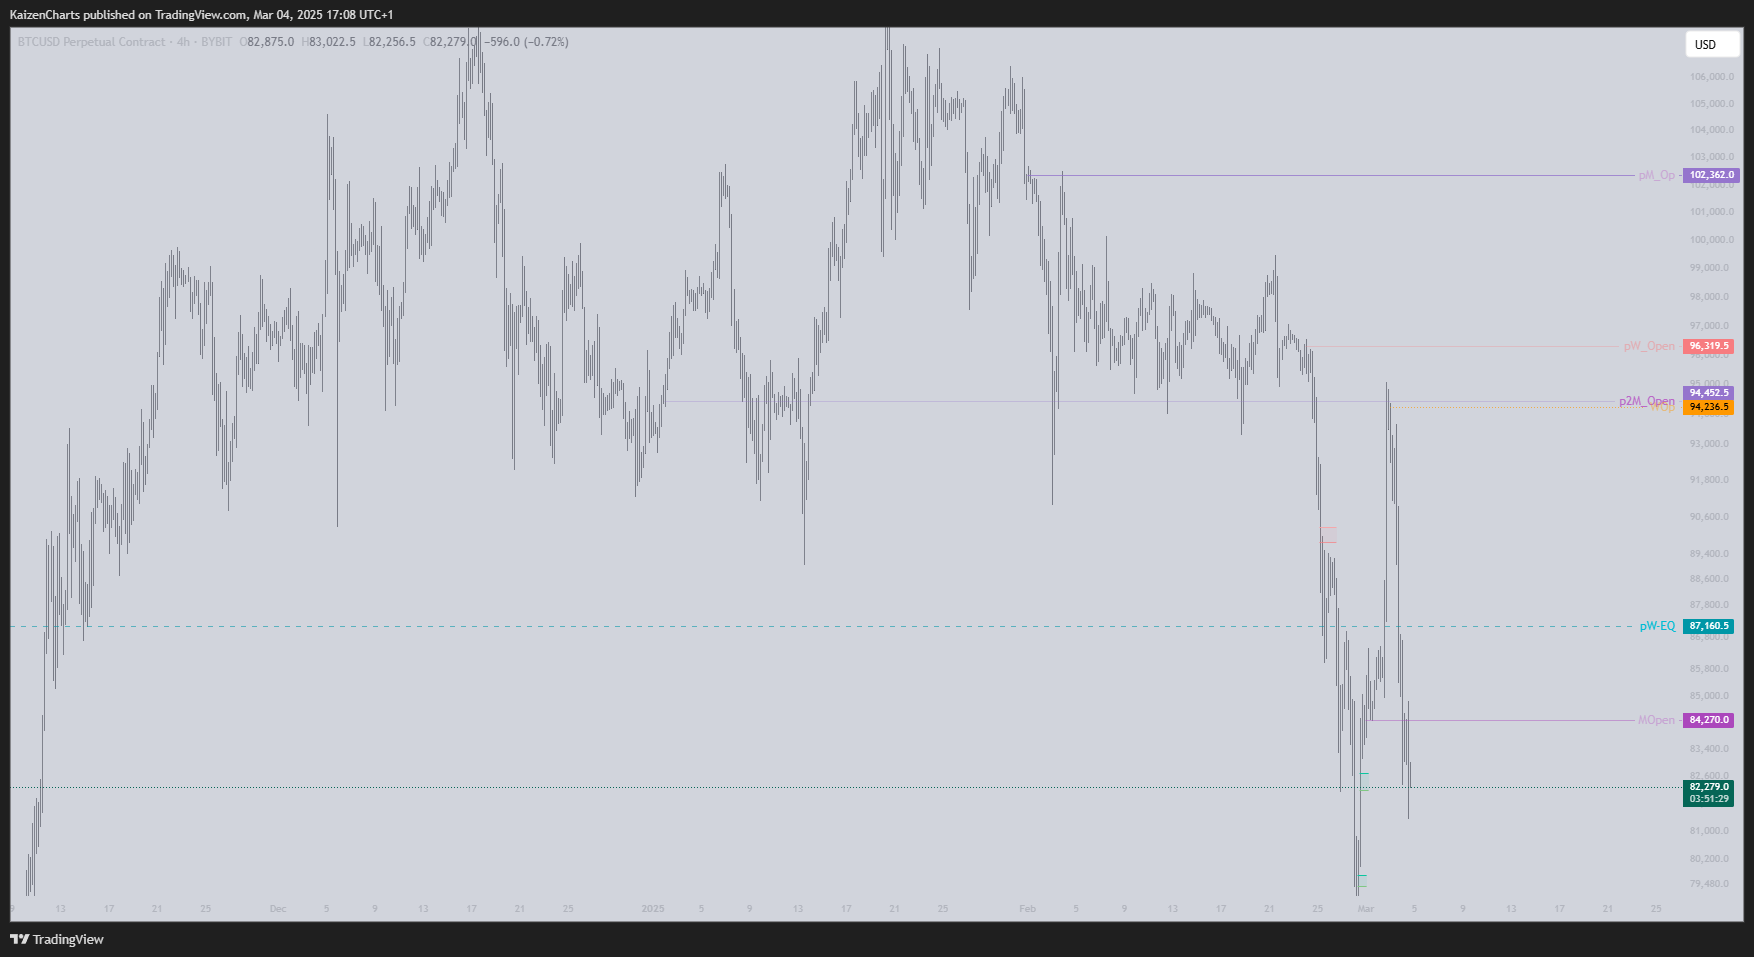
3.Openings: common price levels traders mark. These a specific price level at a specific points in time, an opening. My opening folder has these markings:
Week Opening.
Previos week Opening.
Month Opening.
Previous Month Opening.
Quarter (3 month) Opening.
Previous Quarter Opening.
Price will often retest this levels after a move. Also, where price closes on the given period (i.e: week) in relation to the opening, will help you determine the following time period price action.
As you can see, the Trading View (TV) tool I use for this is the Ray. Also, on this picture is the previous week Equilibrium which is marked with the Horizontal Line Tool.
4.Initial Balance: this is the range formed each day in the first hour of trading since the market opens.
The importance and use of this is the same as with the Monday Range. If price trades above the IB it's very likely the trend continues up until it hits resistance. On the contrary, if it trades below it is likely to continue lower until hitting support.
Here is an indicator I use on Trading View to see it on my chart.
Volume:
Two things: volume profiles and high volume candles.
-High Volume Candles: I mark candles with higher volume than usual on two different time frames mainly, the m5 and h4.
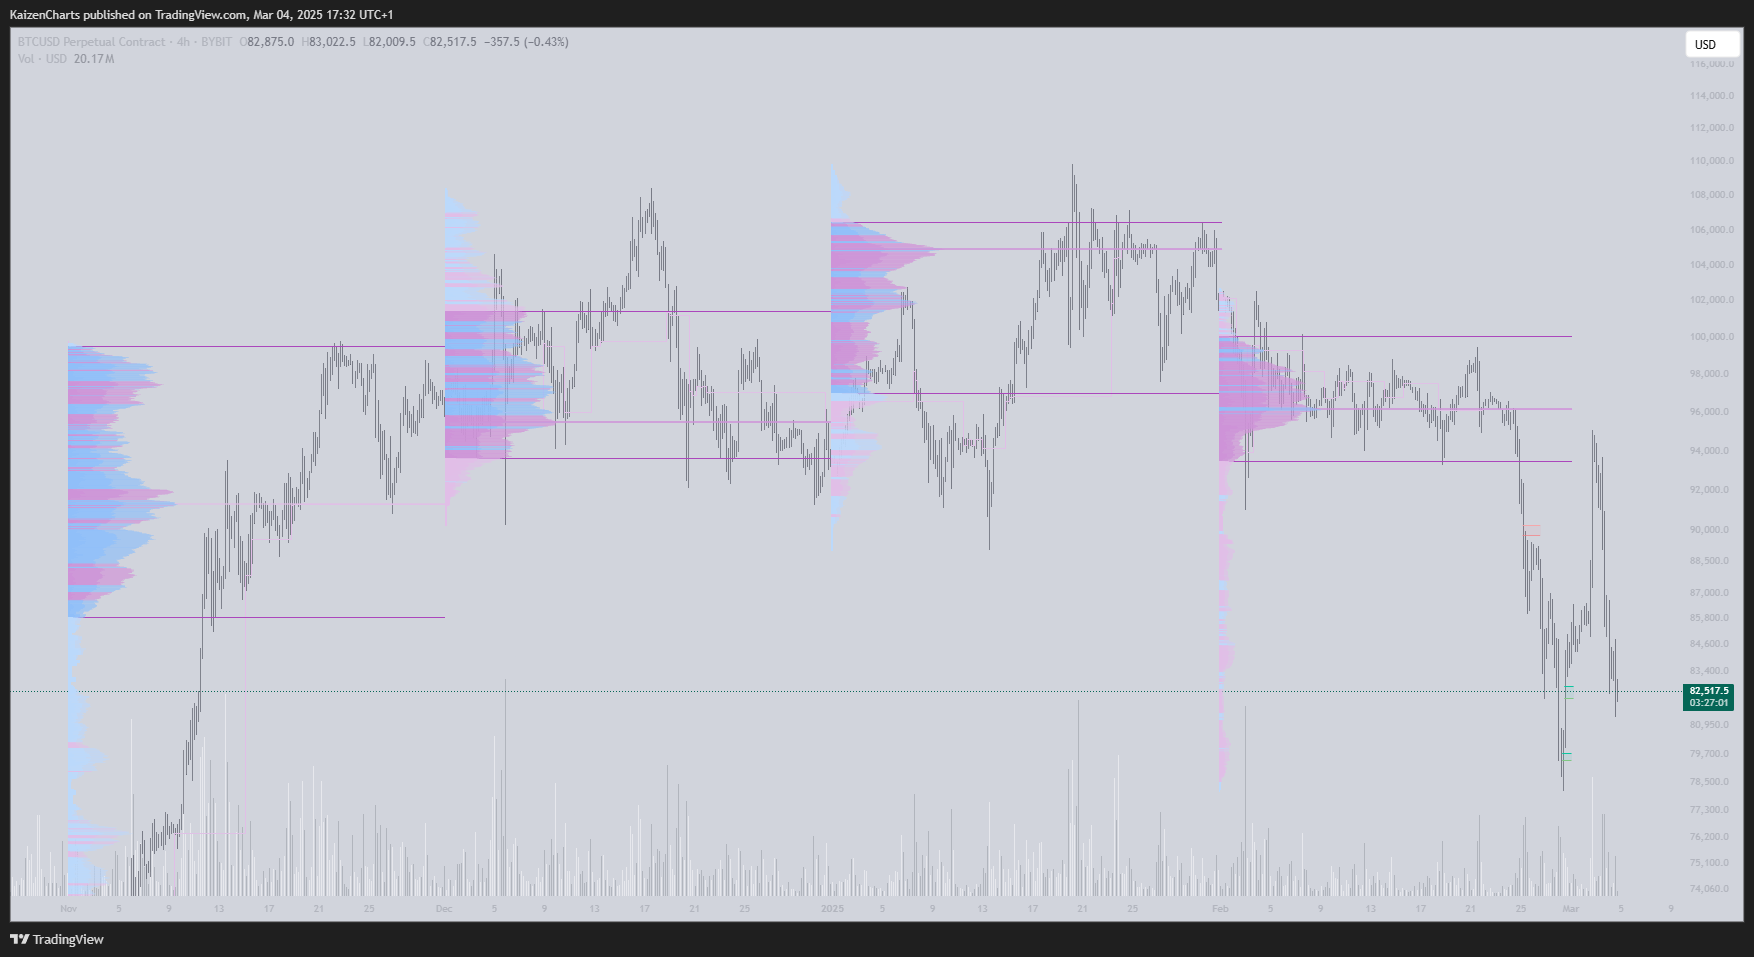
-Volume profiles: although they're mostly used on ranges I also have a particular way to chart them which is often useful. I mix the idea of volume with time so I have a folder with weekly, monthly and quarterly volume profiles. This way you can monitor previous price action moving away from balance in relation to a given time period and also target specific levels such as previous weekly, monthly, etc naked POCs.
See this example on this tweet where the Quarterly Volume Profile helped me identified a possible scenario on HTF which end up playing.
You will notice something on the VP. The volume nodes have different colour ranges within them. This is because I don't use the standard Volume setting. Instead, I use Delta.
Why? because it helps to provide confluence with POI (Points Of Interest), as price often retests this levels where delta changed (the line between colours, which mean market sellers surpassed buyers or the other way around).
See this post where I explained it:
Here is how the monthly VP looks on my chart.
-VWAP: I use this on a similar way to the Volume Profiles, using them in relation to time periods. So I have a folder where I have the week's, previous week, month, previous month and previous quarter.
There are two interesting uses for the vwap with the monthly pattern I discovered being very profitable.
See on this two posts.
The monthly pattern:
The use of the third standard deviation:
This was all for this topic, thank you for reading. I think this is enough before it continues to get too long. I hope you have enjoyed the read and found some things interesting which will motivate you to try on the charts an have a play.
These blog entries take quite some time and effort to put together, if you want to support by any means I would appreciate. You can follow me on twitter, share the blog post there, or of course you always have the option of buying me a coffee (which more than the income side of it helps GREATLY to boost motivation).
In case you want to continue reading on different indicators I use and how I mark things here are some past post on X:
Coinalyze
https://x.com/kaizenChart/status/1863574589785457017
-S/R Flips
https://x.com/kaizenChart/status/1834339191456432603
https://x.com/kaizenChart/status/1863600008005640453
-I/B
https://x.com/kaizenChart/status/1814005513971229029
https://x.com/kaizenChart/status/1785366296600719631
-Liquidations
https://x.com/kaizenChart/status/1767811736516595790
-vwaps
https://x.com/kaizenChart/status/1889628459443294375
-MR
https://x.com/kaizenChart/status/1888902186521817456
-Vol Profile delta and setttings.
https://x.com/kaizenChart/status/1887908892853907901
-Fib levels
https://x.com/kaizenChart/status/1885820423893401782
-Candle reading
https://x.com/kaizenChart/status/1885026189435428947
-Footprints