
 Trend Analysis:
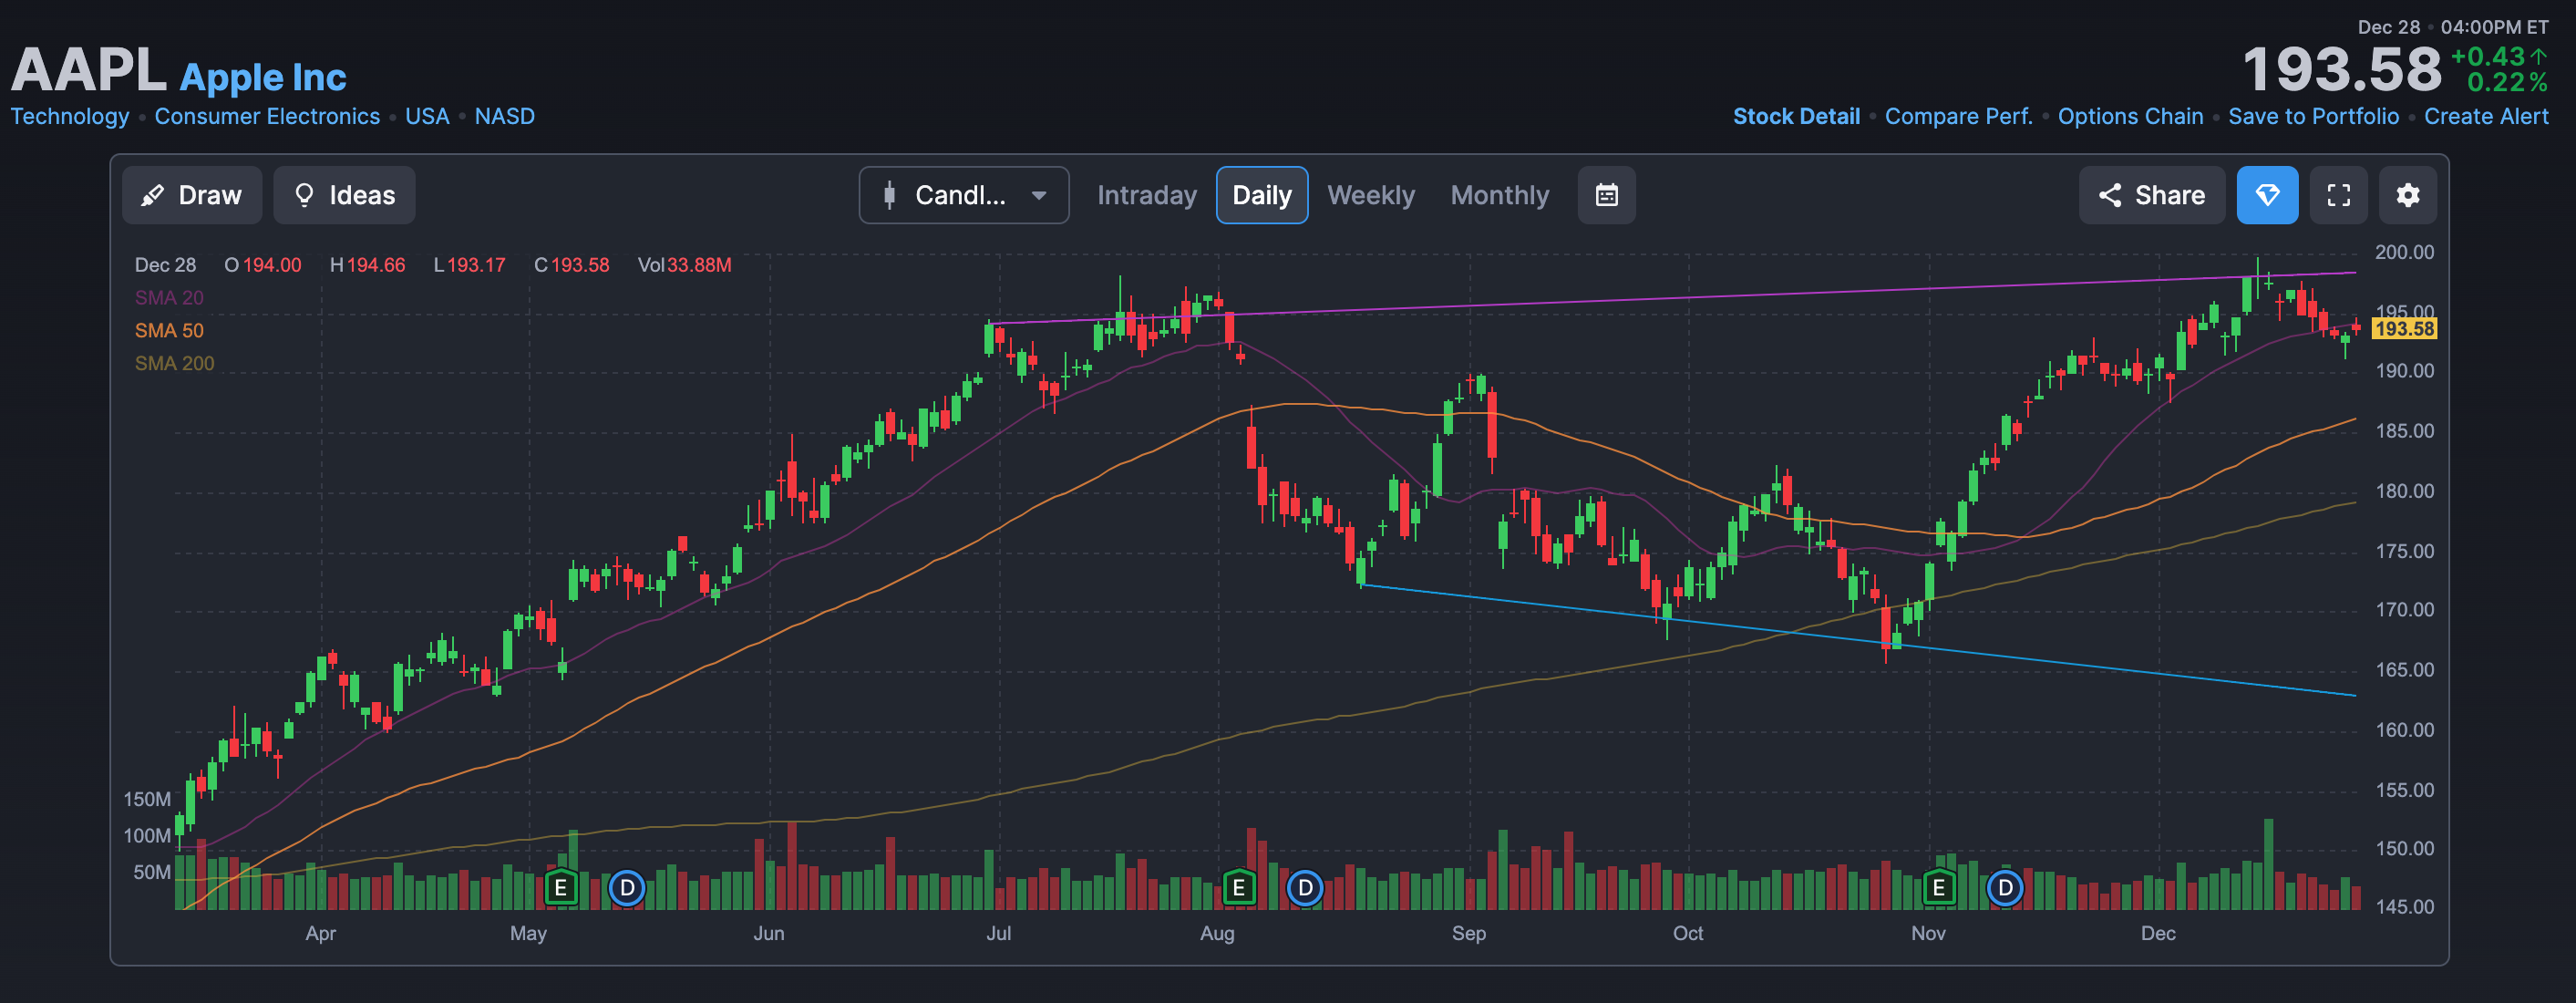
Uptrend Indication: The chart shows an overall uptrend, as indicated by the price making higher highs and higher lows over the period displayed. This is a positive sign for potential long-term investors.
Moving Averages: The stock price is above the 200-day simple moving average (SMA 200), which is traditionally a bullish signal. However, it has recently crossed below the 20-day simple moving average (SMA 20), which may indicate short-term bearish momentum.
Support and Resistance Levels: There appears to be a resistance level around the $200 mark, where the price has peaked and reversed. The support levels might be around the SMA 200 line.
Volume and Volatility:
Volume: The volume appears to be consistent with no significant spikes, which suggests there are no abnormal trading activities.
Volatility: There's some recent increased volatility, as indicated by the wider price swings in the last few candles.
Potential Investment Opportunities:
Long-Term Investment: Given the overall uptrend and the stock price being above the SMA 200, long-term investors might view dips as buying opportunities.
Short-Term Trades: Traders might look for short-term opportunities by playing the bounce off the support levels or a breakthrough above the resistance.
Risks:
Market Correction: If the stock fails to break through the resistance level, it might be due for a correction or consolidation period.
Increased Volatility: The recent volatility might continue, leading to a potential breakdown below the longer-term moving average, which could signal a trend reversal.
Macroeconomic Factors: External factors such as interest rate changes, inflation data, and other macroeconomic news can have a significant impact on stock prices, especially for large companies like Apple.
Advice:
Risk Management: Always use stop-loss orders to manage risk, especially when entering trades based on technical levels.
Diversify: Don't overexpose your portfolio to a single stock, even one as generally reliable as AAPL.
Stay Informed: Keep an eye on upcoming earnings reports, product launches, and other company-specific news that could affect stock performance.
Monitor Technicals: Keep an eye on the SMA 50 and SMA 200, as a crossover could indicate a significant shift in momentum.
Conclusion:
This analysis provides a snapshot based on the chart's historical performance and technical indicators. However, investment decisions should also take into account fundamental analysis, investor's risk tolerance, investment horizon, and current market conditions. It's also advisable to review updated charts and data before making any investment decisions.