
Bitcoin Hits 64k! Can it Continue?
Opinion
As I reflect on yesterday's market action, I'm struck by the sheer robustness of the rally. At one point, the S&P 500 was up nearly 2%, which is a significant move by any measure. While we did see some retreat from these lofty levels by the close, the overall sentiment was unmistakably bullish.
What particularly caught my attention was the sense of panic in the air. Many market participants had been caught on the wrong side of this move, leading to liquidity in the order book drying up rapidly. The result was a massive bidding frenzy, with buyers seemingly indifferent to price. This buying pressure started building in London overnight and accelerated dramatically as we entered the U.S. trading session.
I've been pondering whether rate cuts would be bullish for the market, and the Federal Reserve's decision to implement a 0.5% rate cut on Wednesday has me more concerned than anything else. This ties into a narrative I've been discussing regarding the accuracy of economic data over the past year.
I am concerned that unemployment figures, GDP, and other metrics must be corrected and substantially revised. What troubles me most is that based on Powell's comments during Wednesday's conference call, there seems to be little interest in transparency or taking responsibility for these potential inaccuracies. This lack of clarity continues to be a critical factor we must closely monitor.
Turning to yesterday's economic releases, we saw several surprises. Initial and continuing claims came in better than expected, and the Philadelphia Fed index significantly outperformed expectations. On the surface, these numbers paint a picture of a robust economy. However, given my concerns about data accuracy, the real question we must grapple with is how we should interpret and react to these figures.
In my recent YouTube video, I delved into this topic in detail, which I encourage you to watch for a more comprehensive discussion. But in essence, I'm finding it challenging to fully embrace these numbers at face value, especially in light of the market's exuberant reaction yesterday.
There's a possibility that yesterday's rally pushed things too far, too fast. As a result, I wouldn't be surprised to see some sideways consolidation in the near term as the market digests these moves and we get a clearer picture of whether higher prices are sustainable in this pattern.
That said, our algorithmic indicators are still suggesting the potential for higher prices, particularly as we move into the first week of October. The intermediate-term charts point to at least two or three more weeks of potential upside. However, we must balance this technical outlook with the broader contextual factors.
One such factor is the approaching election. As we approach this event, the markets will likely experience increased volatility, if not outright caution. Observing how market sentiment evolves as we approach this critical juncture will be fascinating.
As we head into Friday, it's worth noting that there are no scheduled economic releases. This means we won't have any fresh data to drive sentiment. Instead, I expect the market narrative to continue focusing on the implications of the recent interest rate cut.
The prevailing view is that this rate reduction will help maintain positive economic momentum. While I agree that a recession doesn't appear to be on the immediate horizon, I view this rate cut more as a "window dressing" move than a necessary economic stimulus. Looking ahead, there's a possibility of a pause in rate cuts in November, depending on the data we see in the next two employment reports and upcoming CPI, PPI, and PCE numbers.
In conclusion, while the market's reaction has been undeniably positive, we're entering a period that calls for careful analysis and perhaps some hesitation. The disconnect between market exuberance and underlying economic realities continues to be a source of concern for me.
Looking back on Thursday’s action
As I analyze today's market action, I'm struck by the robust performance across major indices. The S&P 500 and Dow Jones Industrial Average reached new all-time highs, surging 1.7% and 1.3%, respectively, while the Nasdaq Composite posted an impressive 2.5% gain.
This rally directly responded to yesterday's Federal Open Market Committee (FOMC) decision to cut the target rate for federal funds by 50 basis points, bringing it to the 4.75-5.00% range. The market's enthusiastic reaction reflects a growing belief that the economy is on solid footing and that the Fed will continue to adjust rates as needed to maintain this positive economic backdrop.
Today's economic data reinforces this optimistic outlook. Weekly jobless claims remained steady below levels typically associated with recessions, the Philadelphia Fed Index returned to expansion territory in September, and while existing home sales for August came in slightly below expectations, they still indicated a tight housing market.
The rally was broad-based, with almost all sectors participating. A palpable 'fear of missing out' sentiment drove buying. Mega-cap stocks and chipmakers were standouts. The Vanguard Mega Cap Growth ETF rose 2.5%, while the PHLX Semiconductor Index jumped 4.3%.
Apple was a notable performer, surging 3.7% after T-Mobile's CEO indicated that iPhone 16 sales in the first week outpaced last year's models. This strength in Apple helped propel the S&P 500 information technology sector to a 3.1% gain. Other top-performing sectors included consumer discretionary (+2.2%), communication services (+1.9%), and industrials (+1.8%).
In contrast, defensive sectors like utilities and consumer staples both declined 0.6%, underscoring the risk-on sentiment pervading the market today.
In the bond market, we saw some divergence, with the 10-year yield settling five basis points higher at 3.73%, while the 2-year yield remained unchanged at 3.60%.
Despite this broad rally, FedEx stood out as a significant underperformer, dropping nearly 10% after missing estimates and delivering downbeat guidance for fiscal year 2025.
This market action suggests renewed optimism about economic growth prospects and the Fed's ability to navigate a 'soft landing'. However, as always, it's crucial to remain vigilant. While the current sentiment is bullish, unexpected economic data or geopolitical events could quickly shift the landscape. I'll closely monitor how these trends develop in the coming days and weeks.
· Nasdaq Composite: +20.0% YTD
· S&P 500: +19.8% YTD
· S&P Midcap 400: +12.3% YTD
· Dow Jones Industrial Average: +11.5% YTD
· Russell 2000: +11.1% YTD
Thursday’s economic releases
The Weekly Initial Claims came in at 219,000, significantly lower than the KR Forecast consensus of 232,000. The prior week's figure was revised slightly upward to 231,000 from 230,000. Weekly Continuing Claims decreased to 1.829 million, down from the revised previous figure of 1.843 million.
What's particularly noteworthy about these claims numbers is their implications for the broader economic picture. The low initial claims reading doesn't suggest an elevated likelihood of recession or economic downturn. This aligns with the sentiment expressed by Fed Chair Powell and supports the narrative of a resilient labor market.
Turning to the Q2 Current Account Balance, we saw a deficit of $266.8 billion, widening from the revised prior figure of $241.0 billion. This increase in the current account deficit could have implications for currency markets and trade dynamics.
The September Philadelphia Fed Index surprised to the upside, coming in at 1.7. While this is below the KR Forecast consensus of 3.0, it marks a significant improvement from the prior reading of -7.0. It indicates a return to expansion territory for manufacturing activity in the region.
In the housing market, August’s existing home sales came in at 3.86 million, slightly below the KR forecast consensus of 3.90 million and down from the revised prior figure of 3.96 million. The key takeaway is that more inventory becomes available as mortgage rates decline. However, the market remains tight, as evidenced by the ongoing increase in median home prices.
The August Leading Indicators showed a decline of 0.2%, slightly better than the KR Forecast consensus of -0.3% and an improvement from the prior month's -0.6%. This suggests a moderating pace of economic deceleration.
As we look ahead, it's worth noting that no significant U.S. economic data is scheduled for release on Friday. This could mean market participants will have time to digest today's releases and the implications of yesterday's Federal Reserve decision.
Today's data paints a picture of an economy that continues to show resilience in key areas, particularly the labor market while exhibiting some signs of moderation in others. The housing market data, in particular, suggests a delicate balance between increased inventory and sustained demand. As always, we'll continue to monitor these trends closely and assess their potential impact on monetary policy and market dynamics.
WaveTech Database
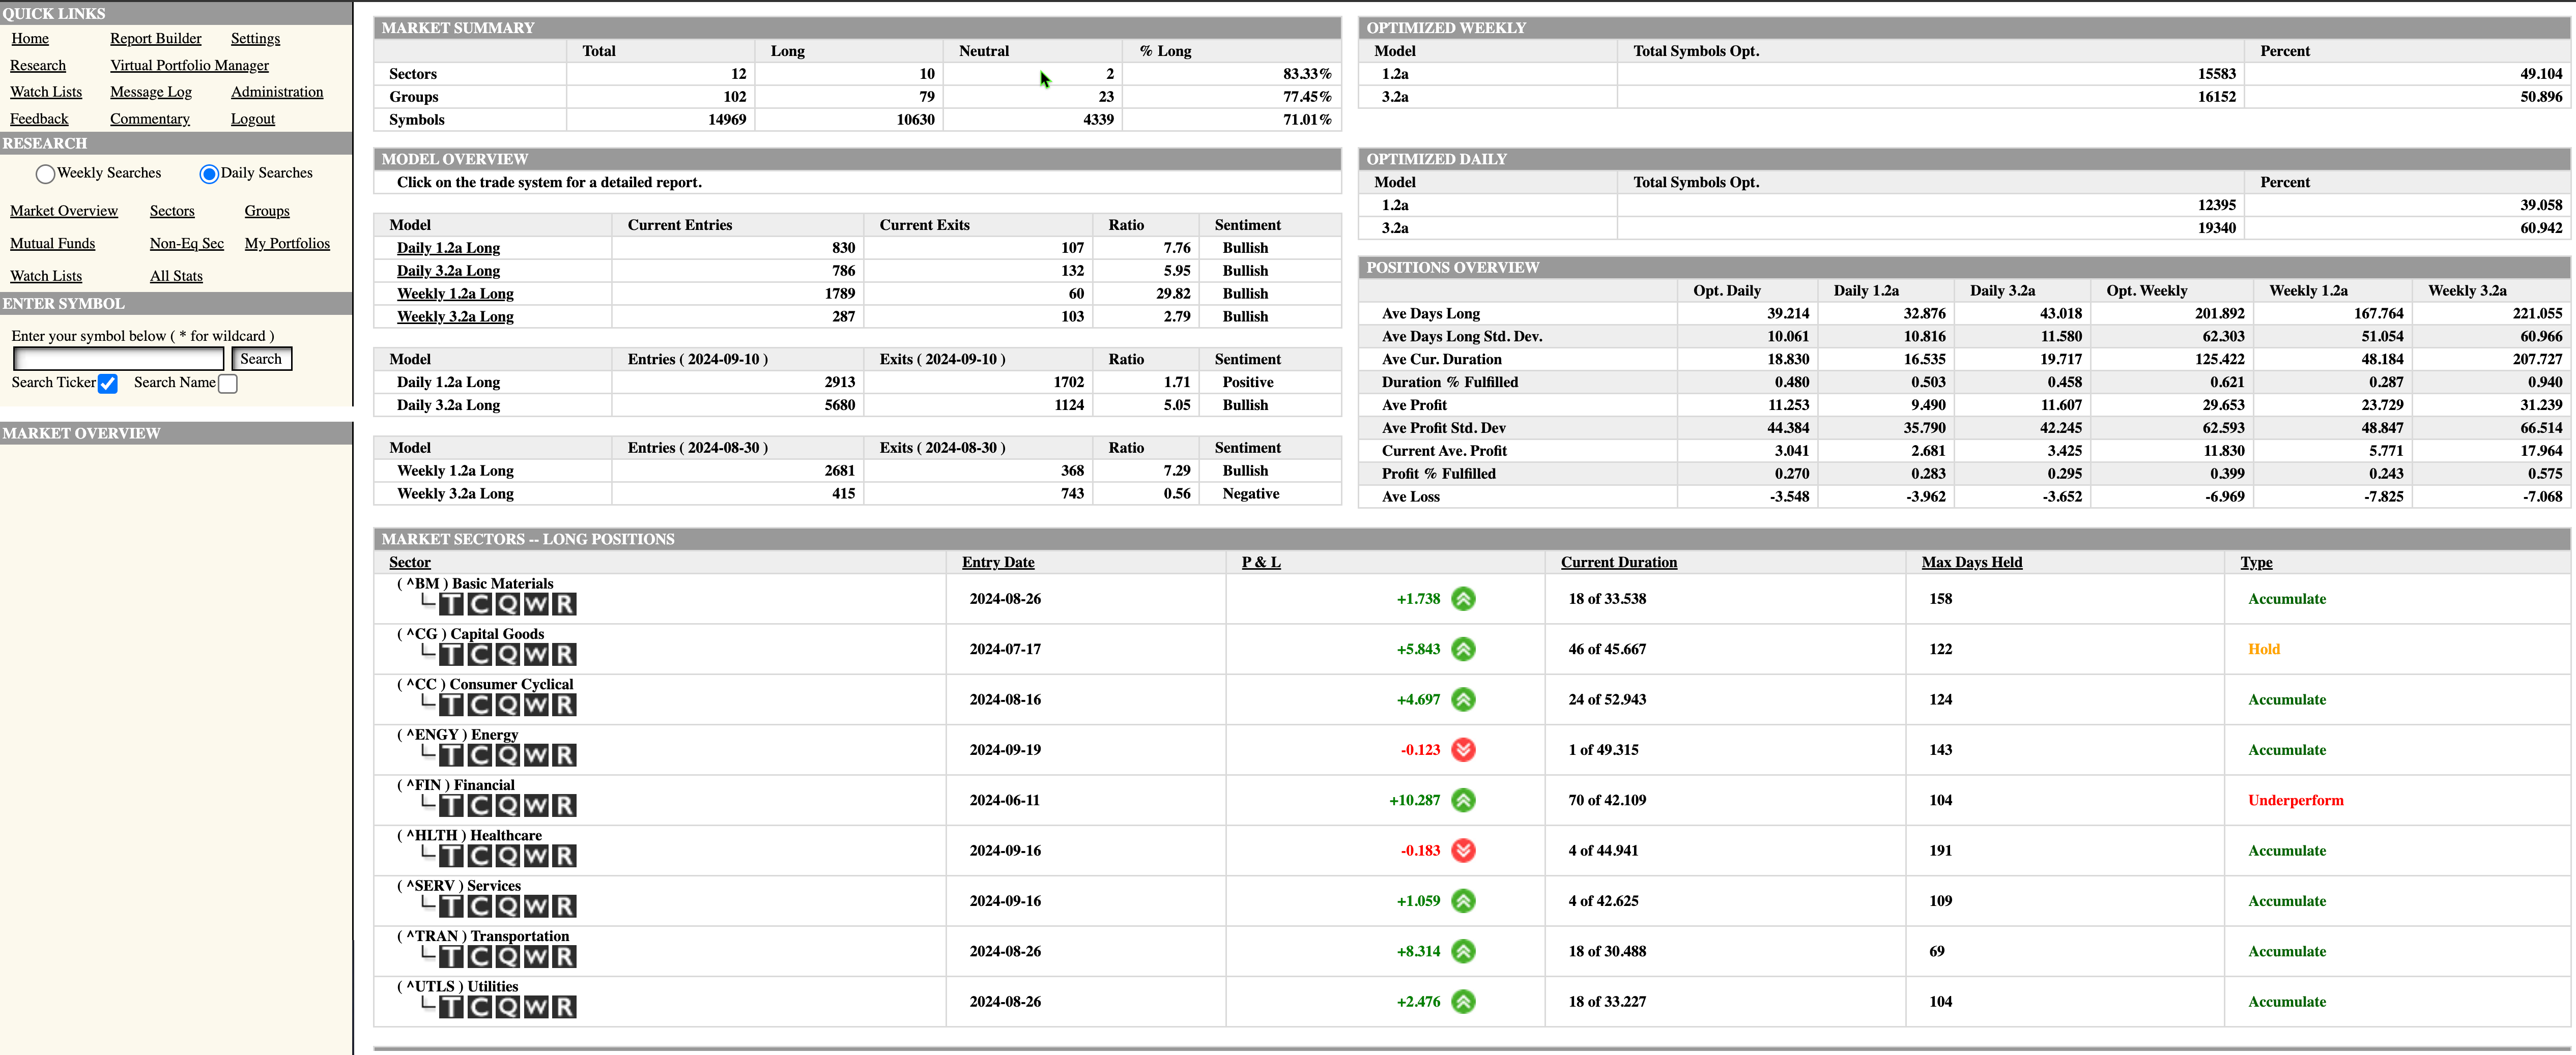
As I delve into the latest WaveTech database results, I'm struck by the continued momentum we're witnessing in the market. Yesterday's robust action has translated into impressive numbers, with 1,616 new entries and only 239 exits. This net positive flow has pushed our percent bullish metric to 71.01%.
This surge in bullish sentiment is exciting when we consider the context. A few days ago, I discussed how we typically see the bullish percent range between 68% and 72% before encountering some resistance. Now that we've reached the upper end of this range, it's worth pondering whether we're approaching a potential inflection point.
What's catching my attention is the status of several sectors we're currently long. Many of these have reached or exceeded their expected holding periods, which could signal impending shifts in market leadership. Let's break this down a bit:
The capital goods sector has entered a "hold" phase, which suggests that the easy money may have already been made while it's still performing well. We'll need to monitor this sector closely for signs of a potential topping or a continuation of its uptrend.
Even more intriguing is the financial sector, which has now moved into an "underperform" status. This doesn't necessarily mean it's time to sell but indicates that the sector has exceeded its average holding period. Typically, we expect financials to be held for about 42 days, but we're now at day 70. This extended duration could indicate that the sector's outperformance may be waning.
These capital goods and financial, combined with the overall database reaching extremely bullish levels, suggest that we're likely on the cusp of seeing some sector rotation. It's a natural part of the market cycle, and I'll be watching closely to see which areas of the market step up to take leadership.
It's worth noting that not all sectors are in the same boat. Some are still in the early or middle stages of their cycles. Energy, for instance, just turned bullish a day ago. This aligns with comments I've made in recent YouTube videos and other analyses, highlighting the potential for energy to show increased strength over the next couple of months.
This divergence in sector performance and cycle positioning creates an interesting dynamic. While some areas of the market may get a bit long in the tooth, others are just starting to hit their stride. This suggests that while we might see some near-term choppiness as leadership shifts, the overall market trend could remain supportive.
However, it's crucial to remain vigilant. When the overall database reaches these extreme bullish levels, it often precedes at least a short-term pause or consolidation in the broader market. The key will be watching how smoothly the baton is passed from current leaders to emerging ones.
In conclusion, while the current bullish sentiment is undoubtedly strong, the market may be undergoing a recalibration phase. The potential sector rotation we're seeing signs of could provide new opportunities for those who are prepared and vigilant.
S&P 500 Futures
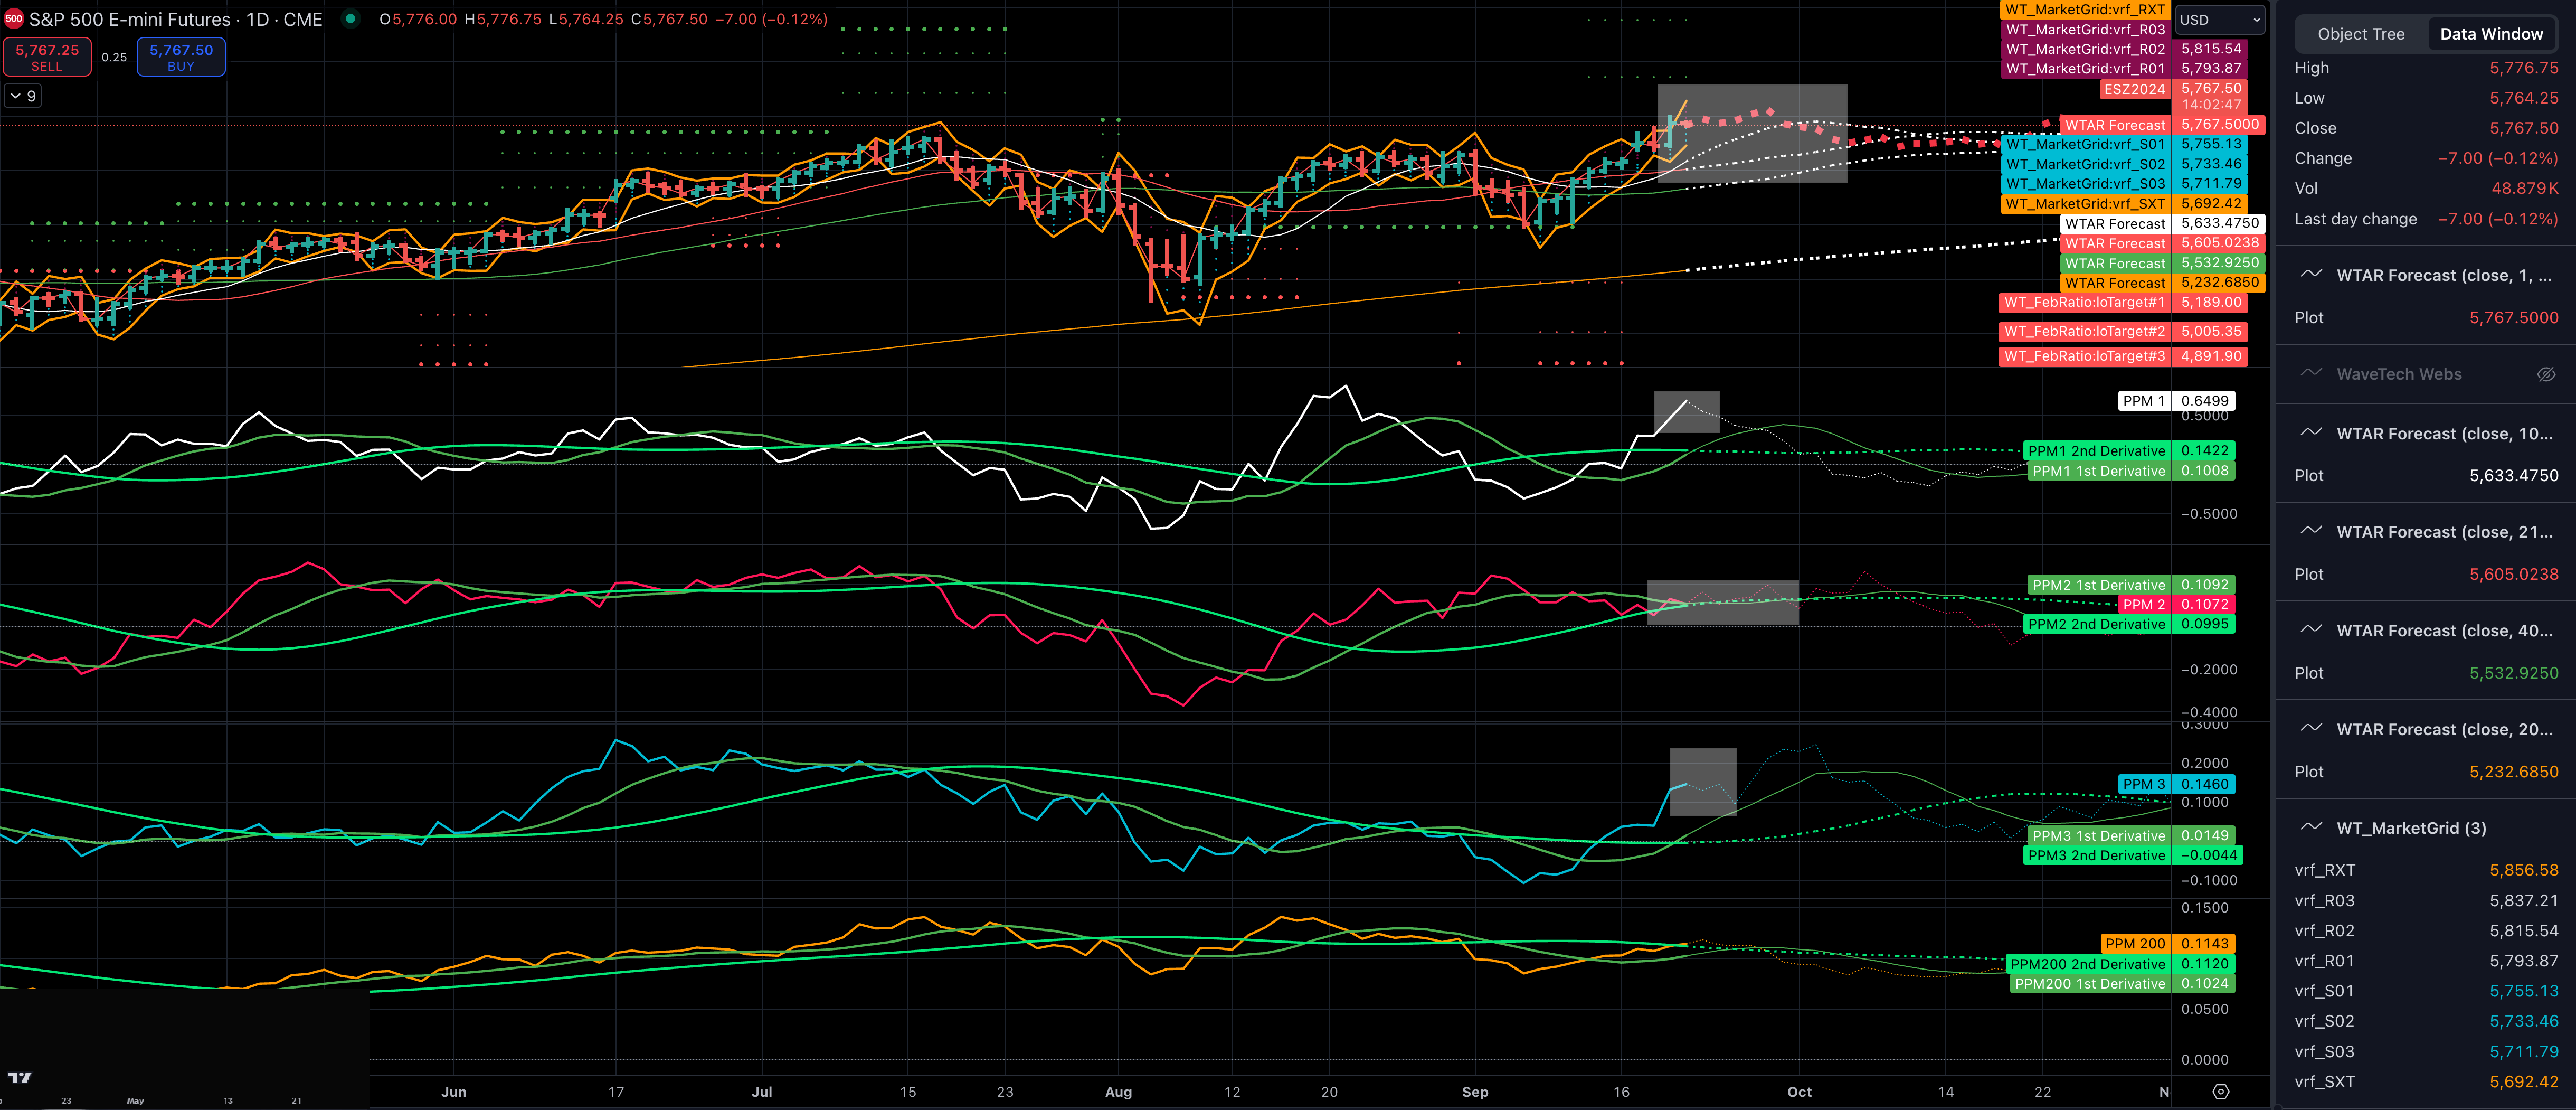
Reflecting on yesterday's extraordinary rally, I note that we exceeded the RXT value, a key technical indicator I closely monitor. This development suggests we're likely entering a phase of sideways movement lasting one to two days, with a slight downward bias. Our algorithmic models further reinforce this projection, indicating a loss of momentum as we approach early next week.
The implications of this potential consolidation are significant. We're looking at a probable test of key support levels, specifically the 10-day simple moving average. Currently, this moving average sits at 5633, but it's important to note that it's rapidly climbing at about 30 points per day. This upward trajectory underscores the robust underlying trend we're experiencing.
We're likely witnessing a natural and healthy correction towards this moving average or, at the very least, a period of sideways movement that allows these faster-moving averages to catch up with the significant surge we've seen over the past eight sessions. This consolidation shouldn't be viewed negatively; rather, it represents a necessary pause, a chance for the market to catch its breath before potentially continuing its upward journey.
Looking beyond this short-term consolidation, I still see strong indications of further upside potential. The Fibonacci targets I've discussed in previous analyses are still in play. These projections suggest a minimum move to the 5943 level, a target that I believe could be achieved within the next eight to ten trading days, potentially extending into the first week of October.
It is crucial to understand that this short-term consolidation doesn't negate the broader bullish trend. Our intermediate models show robust numbers, and the overall trend indicates acceleration. These longer-term indicators suggest that the positive momentum could carry us well into the first or second week of October.
For today's trading session, I've identified some critical levels that will be important to watch. On the support side, we're looking at 5755 and 5733. These levels should provide a cushion against any potential pullbacks or profit-taking. On the upside, resistance will likely be encountered at 5793 and 5815. How the market interacts with these levels could provide valuable insights into the strength and sustainability of the current trend.
It's worth noting that this potential consolidation phase comes at an exciting juncture in the market cycle. We've seen a significant price run-up, driven by the Federal Reserve's recent rate cut and optimistic economic data. However, as I've mentioned in previous analyses, there are still underlying concerns about the accuracy of some financial metrics and the sustainability of this rapid ascent.
If this consolidation period materializes as our models suggest, it could provide a valuable opportunity for market participants to reassess their positions and for the overall market to digest recent gains. During these phases, we often see sector rotation as investors shift their focus from overbought areas to those offering better value or growth potential.
In conclusion, while we may enter a short-term consolidation phase, the broader bullish trend remains intact. The key will be watching how the market interacts with the support levels I've outlined, particularly the 10-day moving average. A controlled pullback or sideways movement that allows this average to catch up could set the stage for the next leg higher, potentially towards those Fibonacci targets I previously discussed.
NASDAQ Futures
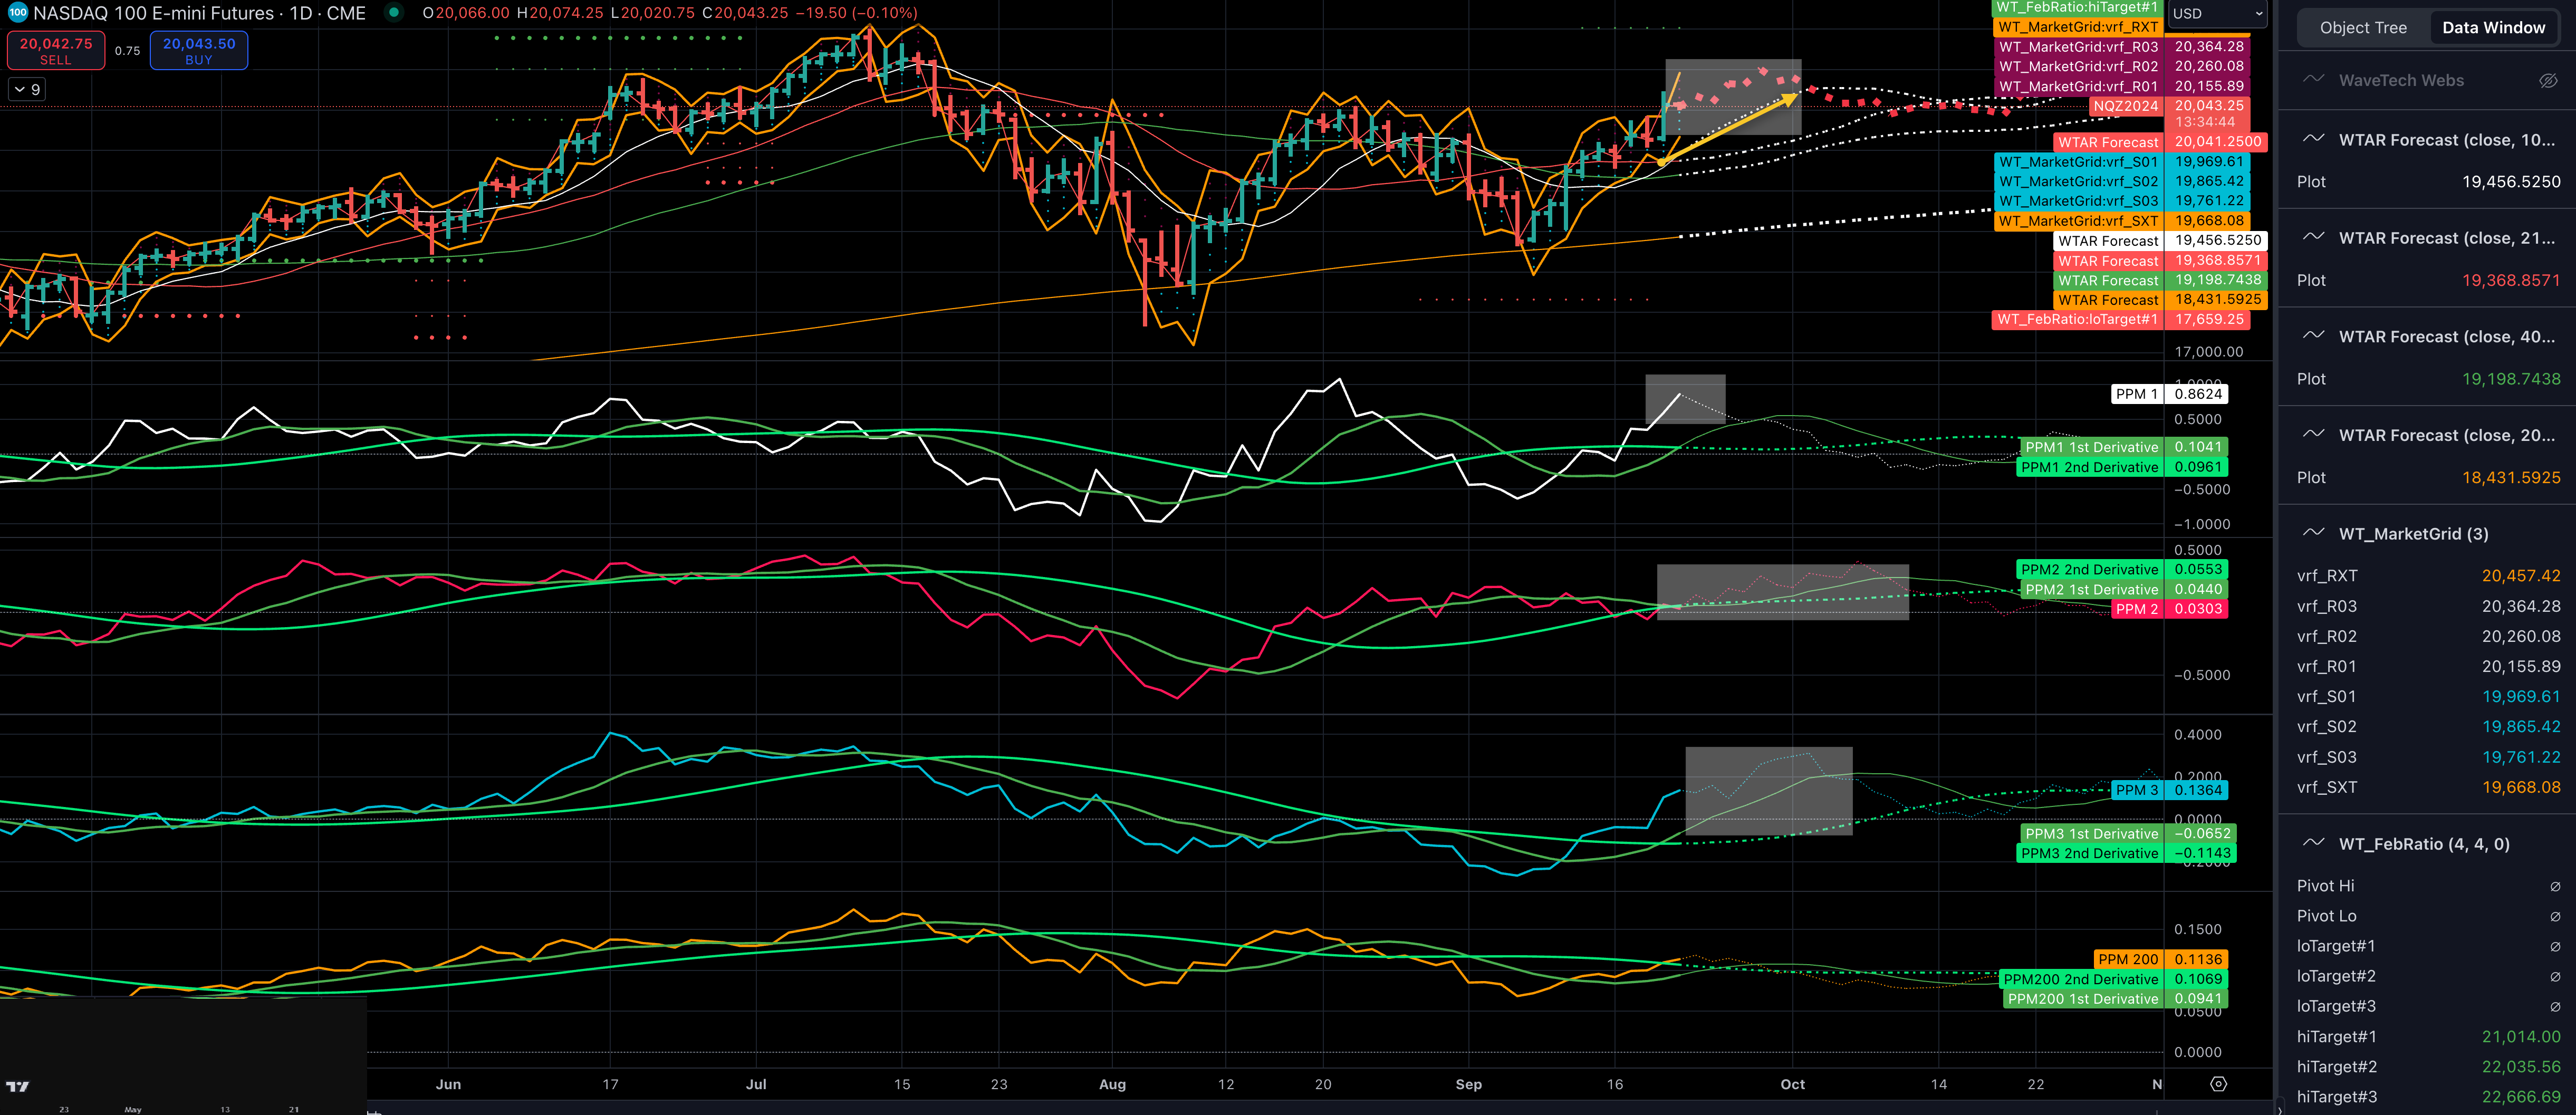
As I analyze the current NASDAQ trends, I notice some intriguing developments that align closely with what I see in the S&P 500. One of the critical elements confirming our short-term consolidation thesis is the behavior of the price pressure indicators, particularly price pressure #1.
What's catching my eye is the inverted V top formation in price pressure #1. This pattern is typically quite significant and often precedes a period of consolidation or potential pullback. It's a clear sign that the recent momentum might be losing steam, at least in the short term.
However, it's crucial to note that I see conflicting signals when we look at price pressure #2 and #3. These indicators suggest that the underlying trend is still trying to evolve and potentially setting up a bottoming pattern. This divergence between our short-term and longer-term indicators creates an exciting dynamic we must monitor closely.
As my S&P 500 analysis mentioned, we will likely see a retreat towards the 10-day moving average. For the NASDAQ, this critical level currently sits at 19,457. It's important to understand that this moving average is rising within the overall uptrend, which means the support level is dynamic and moving higher each day.
Our algorithmic models suggest a sideways movement for the next few days, with a slight bias to the downside. This aligns with the RTX sell signal we've received, a significant indicator in my analysis toolkit.
What's particularly noteworthy is that the probabilities for the market to continue moving sharply higher in its current configuration are relatively low. We're seeing signs that momentum is starting to peak. However, it's crucial to understand that while short-term momentum might wane, there's still substantial upside in the broader trend.
The Fibonacci target at 21,014 adds another layer to our analysis. This level suggests there's still potential for upward movement in the longer term. However, the path to this target will likely involve some consolidation or pullback soon.
I anticipate a consolidation scenario over the next several days. This doesn't mean a sharp reversal or significant losses but rather a period when the market breathes, easing overbought conditions and setting the stage for potentially higher levels.
It is essential to view this potential consolidation phase in the context of the broader bull market we've been experiencing. Markets rarely move in straight lines, and periods of consolidation are normal and often healthy for sustaining longer-term uptrends.
As we navigate this potentially choppy period, I'll pay close attention to how the NASDAQ interacts with crucial support levels, particularly that rising 10-day moving average. The market's behavior around this level could provide valuable clues about the strength and sustainability of the current trend.
I'm also closely examining the interplay between our various price pressure indicators. Any signs of the longer-term indicators (price pressure #2 and #3) starting to align with the short-term indicator (price pressure #1) could signal a more significant shift in market dynamics.
In conclusion, while we see some signs of short-term exhaustion in the NASDAQ, the longer-term picture remains constructive. This potential consolidation phase could be a launching pad for the next leg up, potentially towards that Fibonacci target at 21,014.
Bitcoin
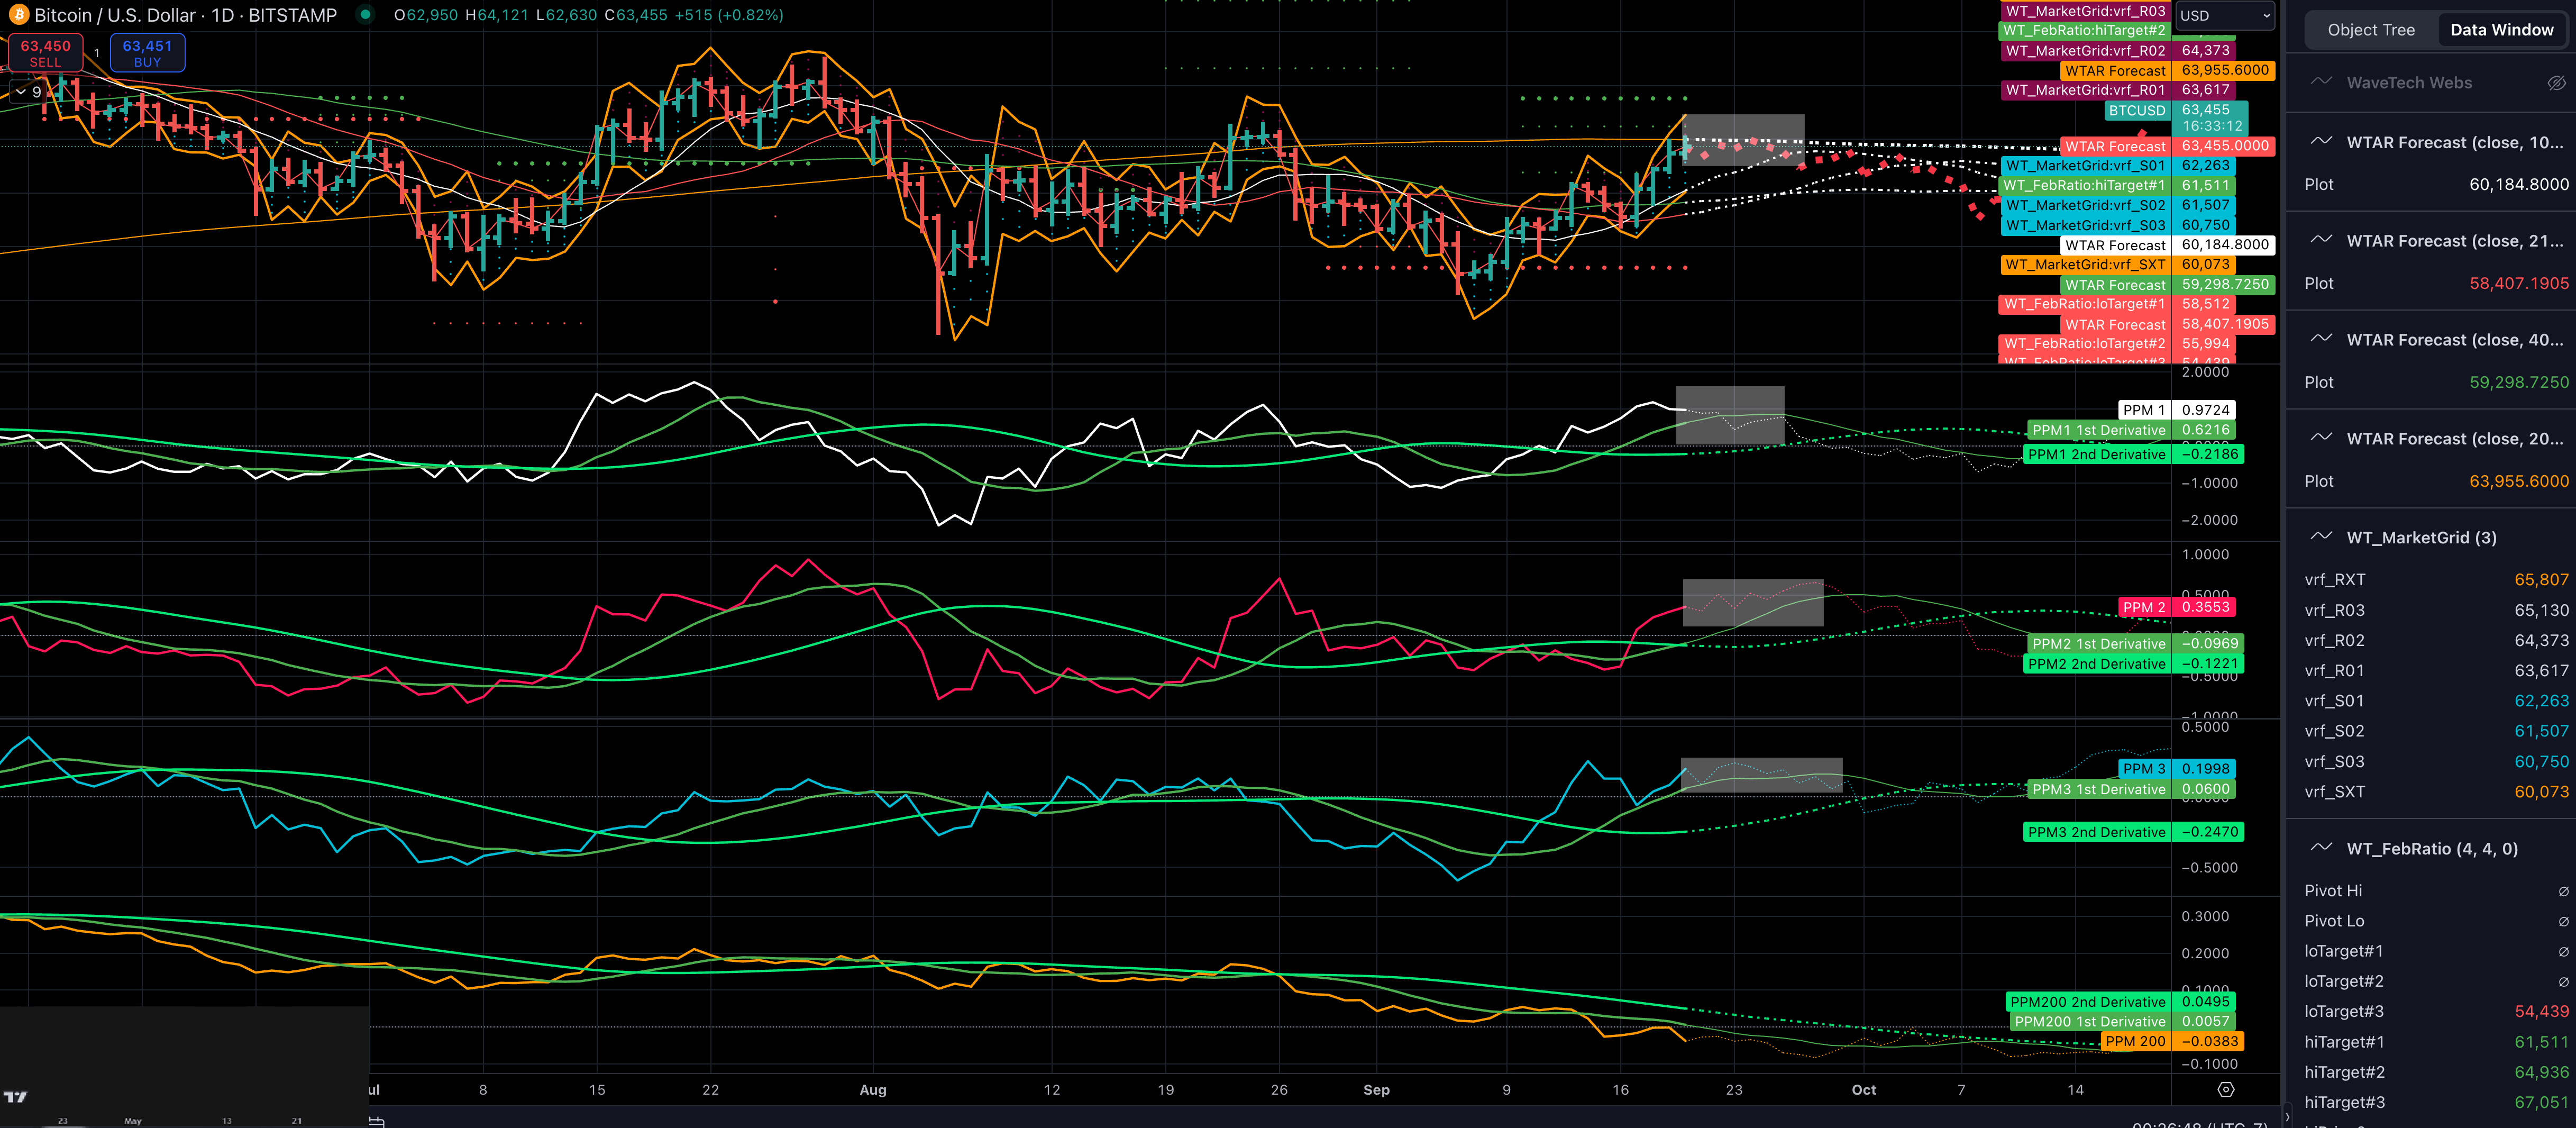
As I analyze Bitcoin's recent performance, it closely tracks the trajectory I've been discussing over the past several sessions. We've seen Bitcoin rally towards the 64,000 level, just as anticipated, and overnight it touched 64,121. This movement validates our previous projections and underscores the importance of following critical technical levels.
While we've reached this significant milestone, there might still be some upward potential in this current move. My analysis suggests that we could see Bitcoin push even higher, potentially reaching the 65,130 to 65,800 range. These levels represent the extreme upper bounds of what our market grid indicator currently allows for today's session.
However, it's equally important to monitor key support levels. For today, I'm closely watching the 62,263 and 61,500 levels. These should act as a floor, providing a cushion against any potential pullbacks or profit-taking. I expect the market to stay within these ranges in the near term.
I'm noticing signs that momentum might be stalling over the next few days. As discussed earlier, this aligns with what we see in other risk-on assets. We could be entering a period of sideways consolidation, a natural and healthy part of any sustained uptrend.
A critical level I'm keeping a close eye on is the 10-day simple moving average (SMA), which currently sits at 60,184. This moving average rises within the uptrend, providing dynamic support that moves higher daily. I anticipate seeing Bitcoin consolidate towards this level over the next several sessions, potentially using it as a springboard for future moves.
This potential consolidation phase shouldn't be viewed negatively. Instead, it's an opportunity for the market to digest recent gains and build a foundation for future advances. During these periods of sideways movement, we often see accumulation by larger players, setting the stage for the next leg up.
As we progress, I'll closely examine how Bitcoin interacts with the key levels I've outlined. Holding above the 10-day SMA will maintain the overall bullish trend. Conversely, a decisive break below this level could signal a deeper correction might be in store.
In conclusion, while Bitcoin has reached the levels we anticipated, the short-term picture suggests a period of consolidation may be ahead. This doesn't negate the overall bullish trend but allows the market to reset before potentially making another push higher.