

Introduction
In today’s highly connected world, keeping your network safe from cyber threats is more important than ever. Whether you are a cybersecurity enthusiast, a student, or an IT professional, understanding how to monitor your network for malicious activity is a must-have skill.
In this blog, I am going to walk you through my project: Building a Network Intrusion Detection System (NIDS) using Suricata IDS and Wazuh SIEM.
By the end of this guide, you will have a working setup that detects suspicious network traffic (like Nmap scans) and instantly reports it to a beautiful security dashboard.
You can find the complete project files and documentation in my GitHub repository here:
👉 Network Intrusion Detection using Suricata & Wazuh
What are Suricata and Wazuh?
Suricata is an open-source Intrusion Detection System (IDS). Think of it as a security guard monitoring your network traffic for known bad behavior.
Wazuh is a Security Information and Event Management (SIEM) tool. It acts as the central brain, collecting logs from Suricata, analyzing them, and presenting them in an easy-to-read dashboard.
Step 1: Forwarding Suricata Logs from the Wazuh Agent
Once Suricata is installed on your target machine, it writes its alerts to a log file (usually eve.json). We need to tell the Wazuh Agent to read this file and send it to the Wazuh Manager.
Open the Wazuh Agent configuration file on your monitored machine:
Bash
nano /var/ossec/etc/ossec.config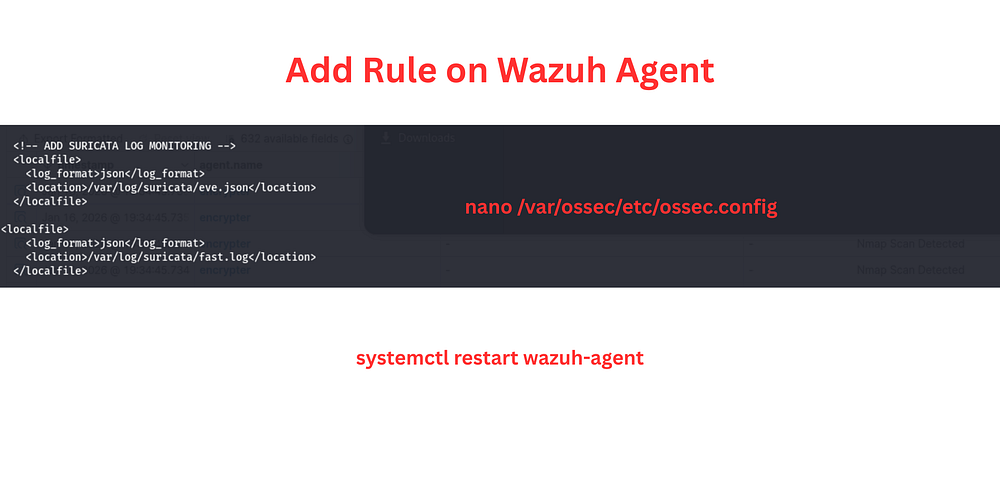
Add the following block to monitor the Suricata JSON and fast logs:
<!-- ADD SURICATA LOG MONITORING -->
<localfile>
  <log_format>json</log_format>
  <location>/var/log/suricata/eve.json</location>
</localfile>

<localfile>
  <log_format>json</log_format>
  <location>/var/log/suricata/fast.log</location>
</localfile>
Save the file, and then restart the Wazuh Agent service to apply the changes
systemctl restart wazuh-agentConfiguring the Wazuh Agent to read Suricata logs.
Step 2: Adding Custom Rules to the Wazuh Manager
Now that the agent is sending logs, the Wazuh Manager needs a custom rule to properly identify and escalate specific attacks, such as an Nmap scan.
On your Wazuh Manager server, open the local rules file:
nano /var/ossec/etc/rules/local_rules.xml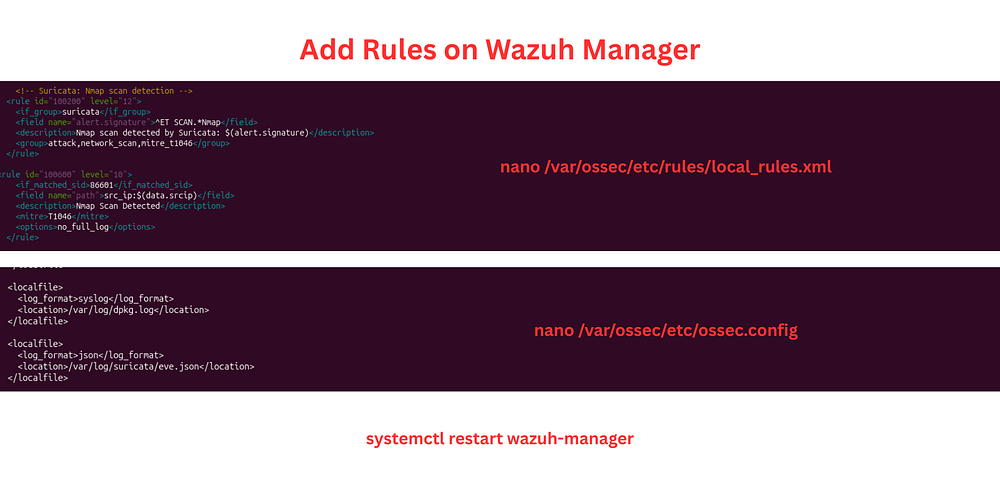
Add the following custom rule to detect Nmap scans identified by Suricata:
<!-- Suricata: Nmap scan detection -->
<rule id="100200" level="12">
  <if_group>suricata</if_group>
  <field name="alert.signature">^ET SCAN.*Nmap</field>
  <description>Nmap scan detected by Suricata: $(alert.signature)</description>
  <group>attack,network_scan,mitre_t1046</group>
</rule>
Make sure the manager’s ossec.config is also set up to parse the incoming logs, then restart the Wazuh Manager[cite: 5]:
Bash
systemctl restart wazuh-managerAdding custom rules to the Wazuh Manager to detect Nmap scans.
Step 3: Simulating an Attack (The Fun Part!)
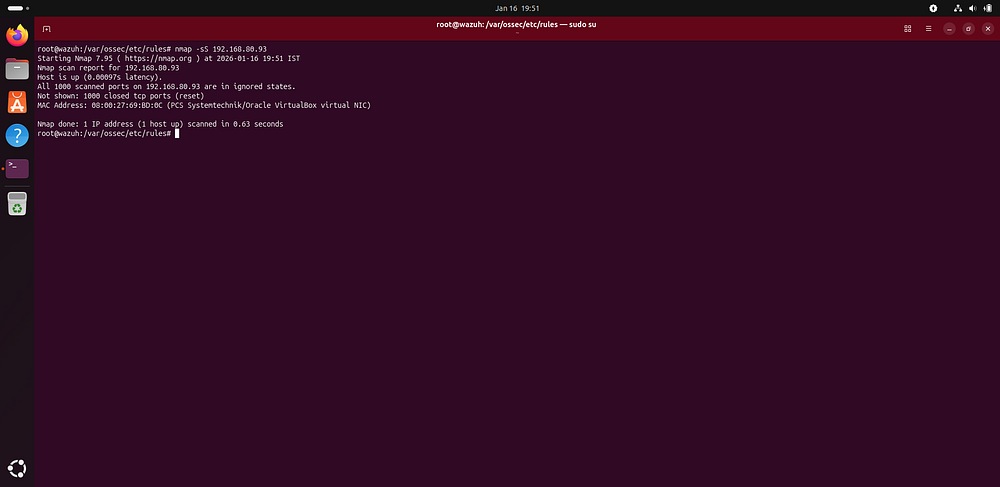
It’s time to see our creation in action. We are going to trigger a fake attack by running a stealth Nmap scan against our monitored machine.
From an attacker machine (or your terminal), run the following command, replacing the IP with your target’s IP address:
nmap -sS <victim_ip>Executing a stealth Nmap scan to trigger the IDS.
Step 4: Viewing the Alerts in the Wazuh Dashboard
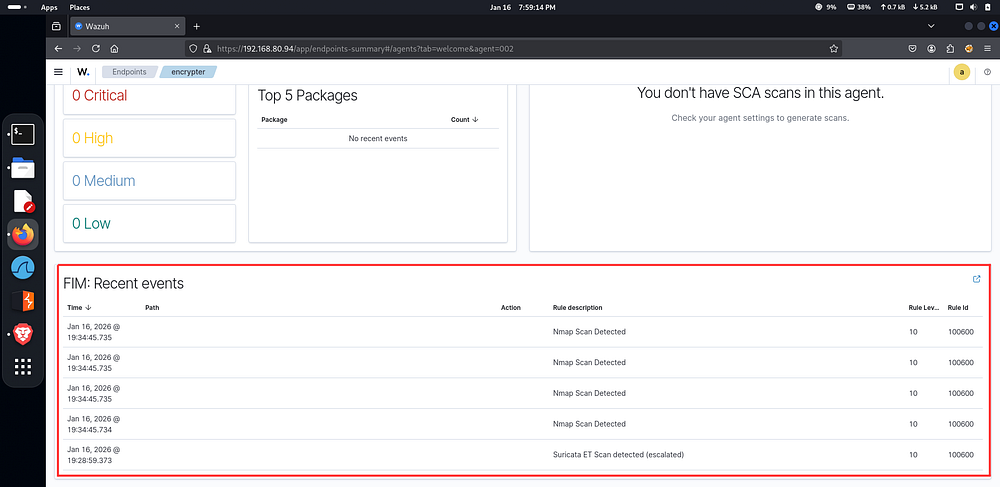
Now, log into your Wazuh Web Dashboard and navigate to the Security Events module.
Because of the rules we configured, you will immediately see high-level alerts popping up. The dashboard will show a “Nmap Scan Detected” event with Rule ID 100600[cite: 2]. Suricata detected the scan, generated the log, and the Wazuh Agent pushed it to the SIEM in real-time!
Wazuh dashboard successfully displaying the detected Nmap scan events.
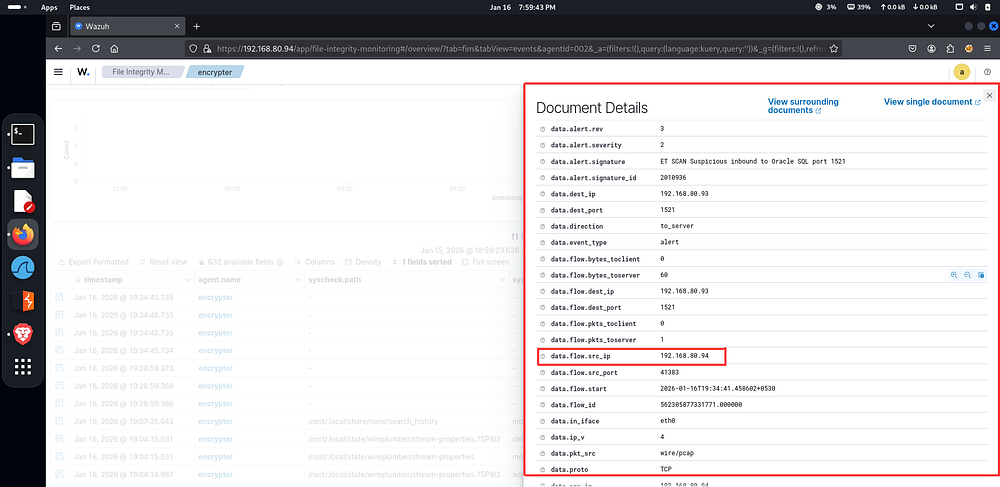
You can click on these events to see the Document Details. This detailed view provides crucial forensic information, such as highlighting the exact source IP (data.flow.src_ip) of the attacker and the specific signature triggered (e.g., "ET SCAN Suspicious inbound to Oracle SQL port 1521")
Detailed alert document showing the attacker’s source IP and the specific Suricata signature.
Conclusion
Congratulations! You have successfully integrated Suricata IDS with Wazuh SIEM. This setup is incredibly powerful and is used by real-world Security Operations Centers (SOCs) to monitor network traffic, detect reconnaissance scans, and stop intrusions.
Cybersecurity is all about visibility — you can’t protect what you can’t see. By combining Wazuh and Suricata, you give yourself a pair of x-ray glasses for your network.
If you found this guide helpful or want to dive deeper into the code, check out the complete project on my GitHub:
🔗 jaseervk / Network-Intrusion-Detection-using-Suricata-IDS-Wazuh-SIEM-
Feel free to star ⭐ the repository if it helps you out, or leave a comment below if you have any questions!
If you love my content and want to support my cybersecurity journey, consider buying me a coffee!
Other digital presences
https://medium.com/@jaseervk321
blog.jaseervk.com