
Hi dear supporters,
Jeddah provided another data point to assess the performance of the new grid, from both a single-lap and race-pace perspective. Some trends emerged, as discussed in the rest of the article: from Aston coming back to life on low fuel, to McLaren's still high drag, to Ferrari's much improved race pace. I will analyse the race in depth, quantifying each driver's and team's performance and HOW it was achieved. I will also extrapolate this information to give you a preview of the next GP. Let's start!
Results
Tyre Strategies
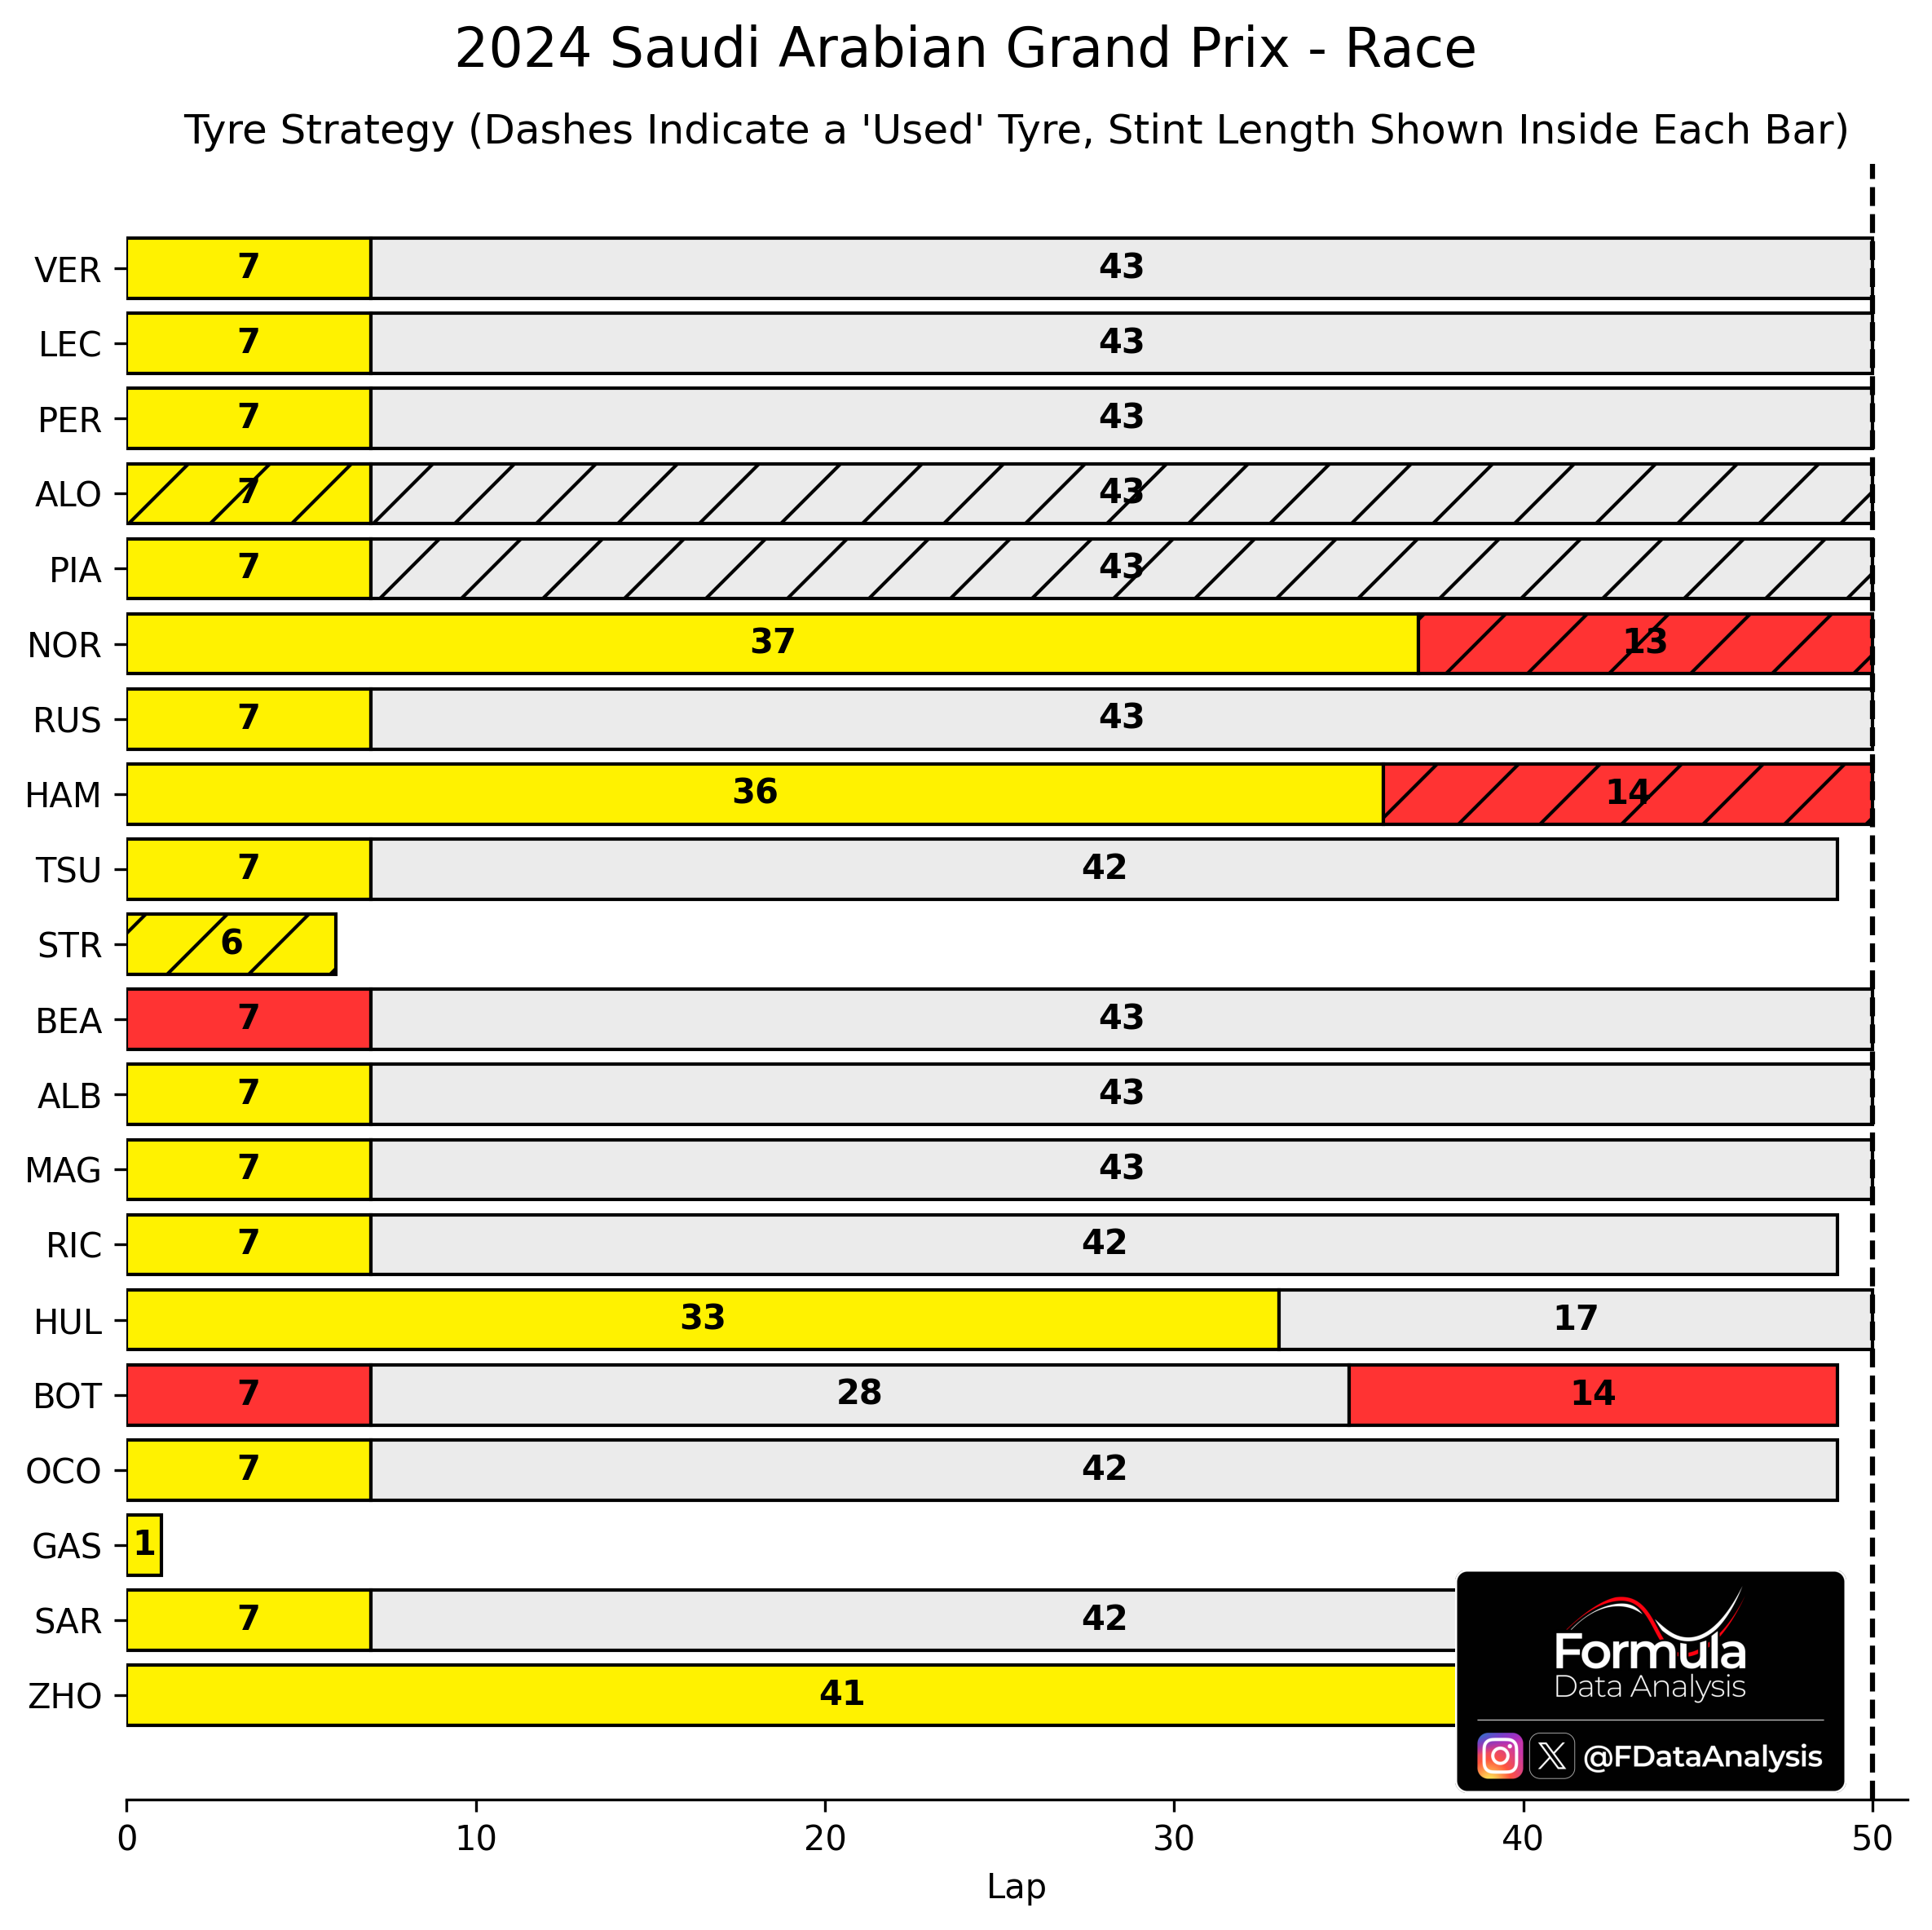
How to read: each bar represents a distinct stint; the number inside the bar is the total number of laps driven on that compound; a dashed bar means that the tyre set was a used one.
Most drivers started on a new set of mediums. Exceptions were the two Aston drivers (who were on a 'scrubbed-in' set) and Bearman and Bottas, who instead opted for a new set of Softs. Up to Lap 6, the race was proceeding normally, except for Gasly who retired on the first lap due to gearbox problems. Then, Stroll's crash triggered a chaotic pitting session to take advantage of the SC. All drivers pitted, except for Norris, Hamilton, Hulkenberg and Zhou. As expected, the two drivers who were running on softs didn't think twice before exploiting the occasion! After that, the conditions were equal again for most drivers: a new set of Hards (except for Alonso and Piastri, who mounted a used set).
Therefore, when looking at the analyses in the remainder of the article keep in mind that Norris and Hamilton were on a worn set for most of the race, and then found some extra pace after mounting the softs at the end. The fact that TWO drivers were able to make a Medium-Soft strategy work with no evident struggles highlights the low abrasion produced by the track and the significant durability of the Pirelli tyres. I suggest bringing a one-step softer tyres for next year.
Race Pace
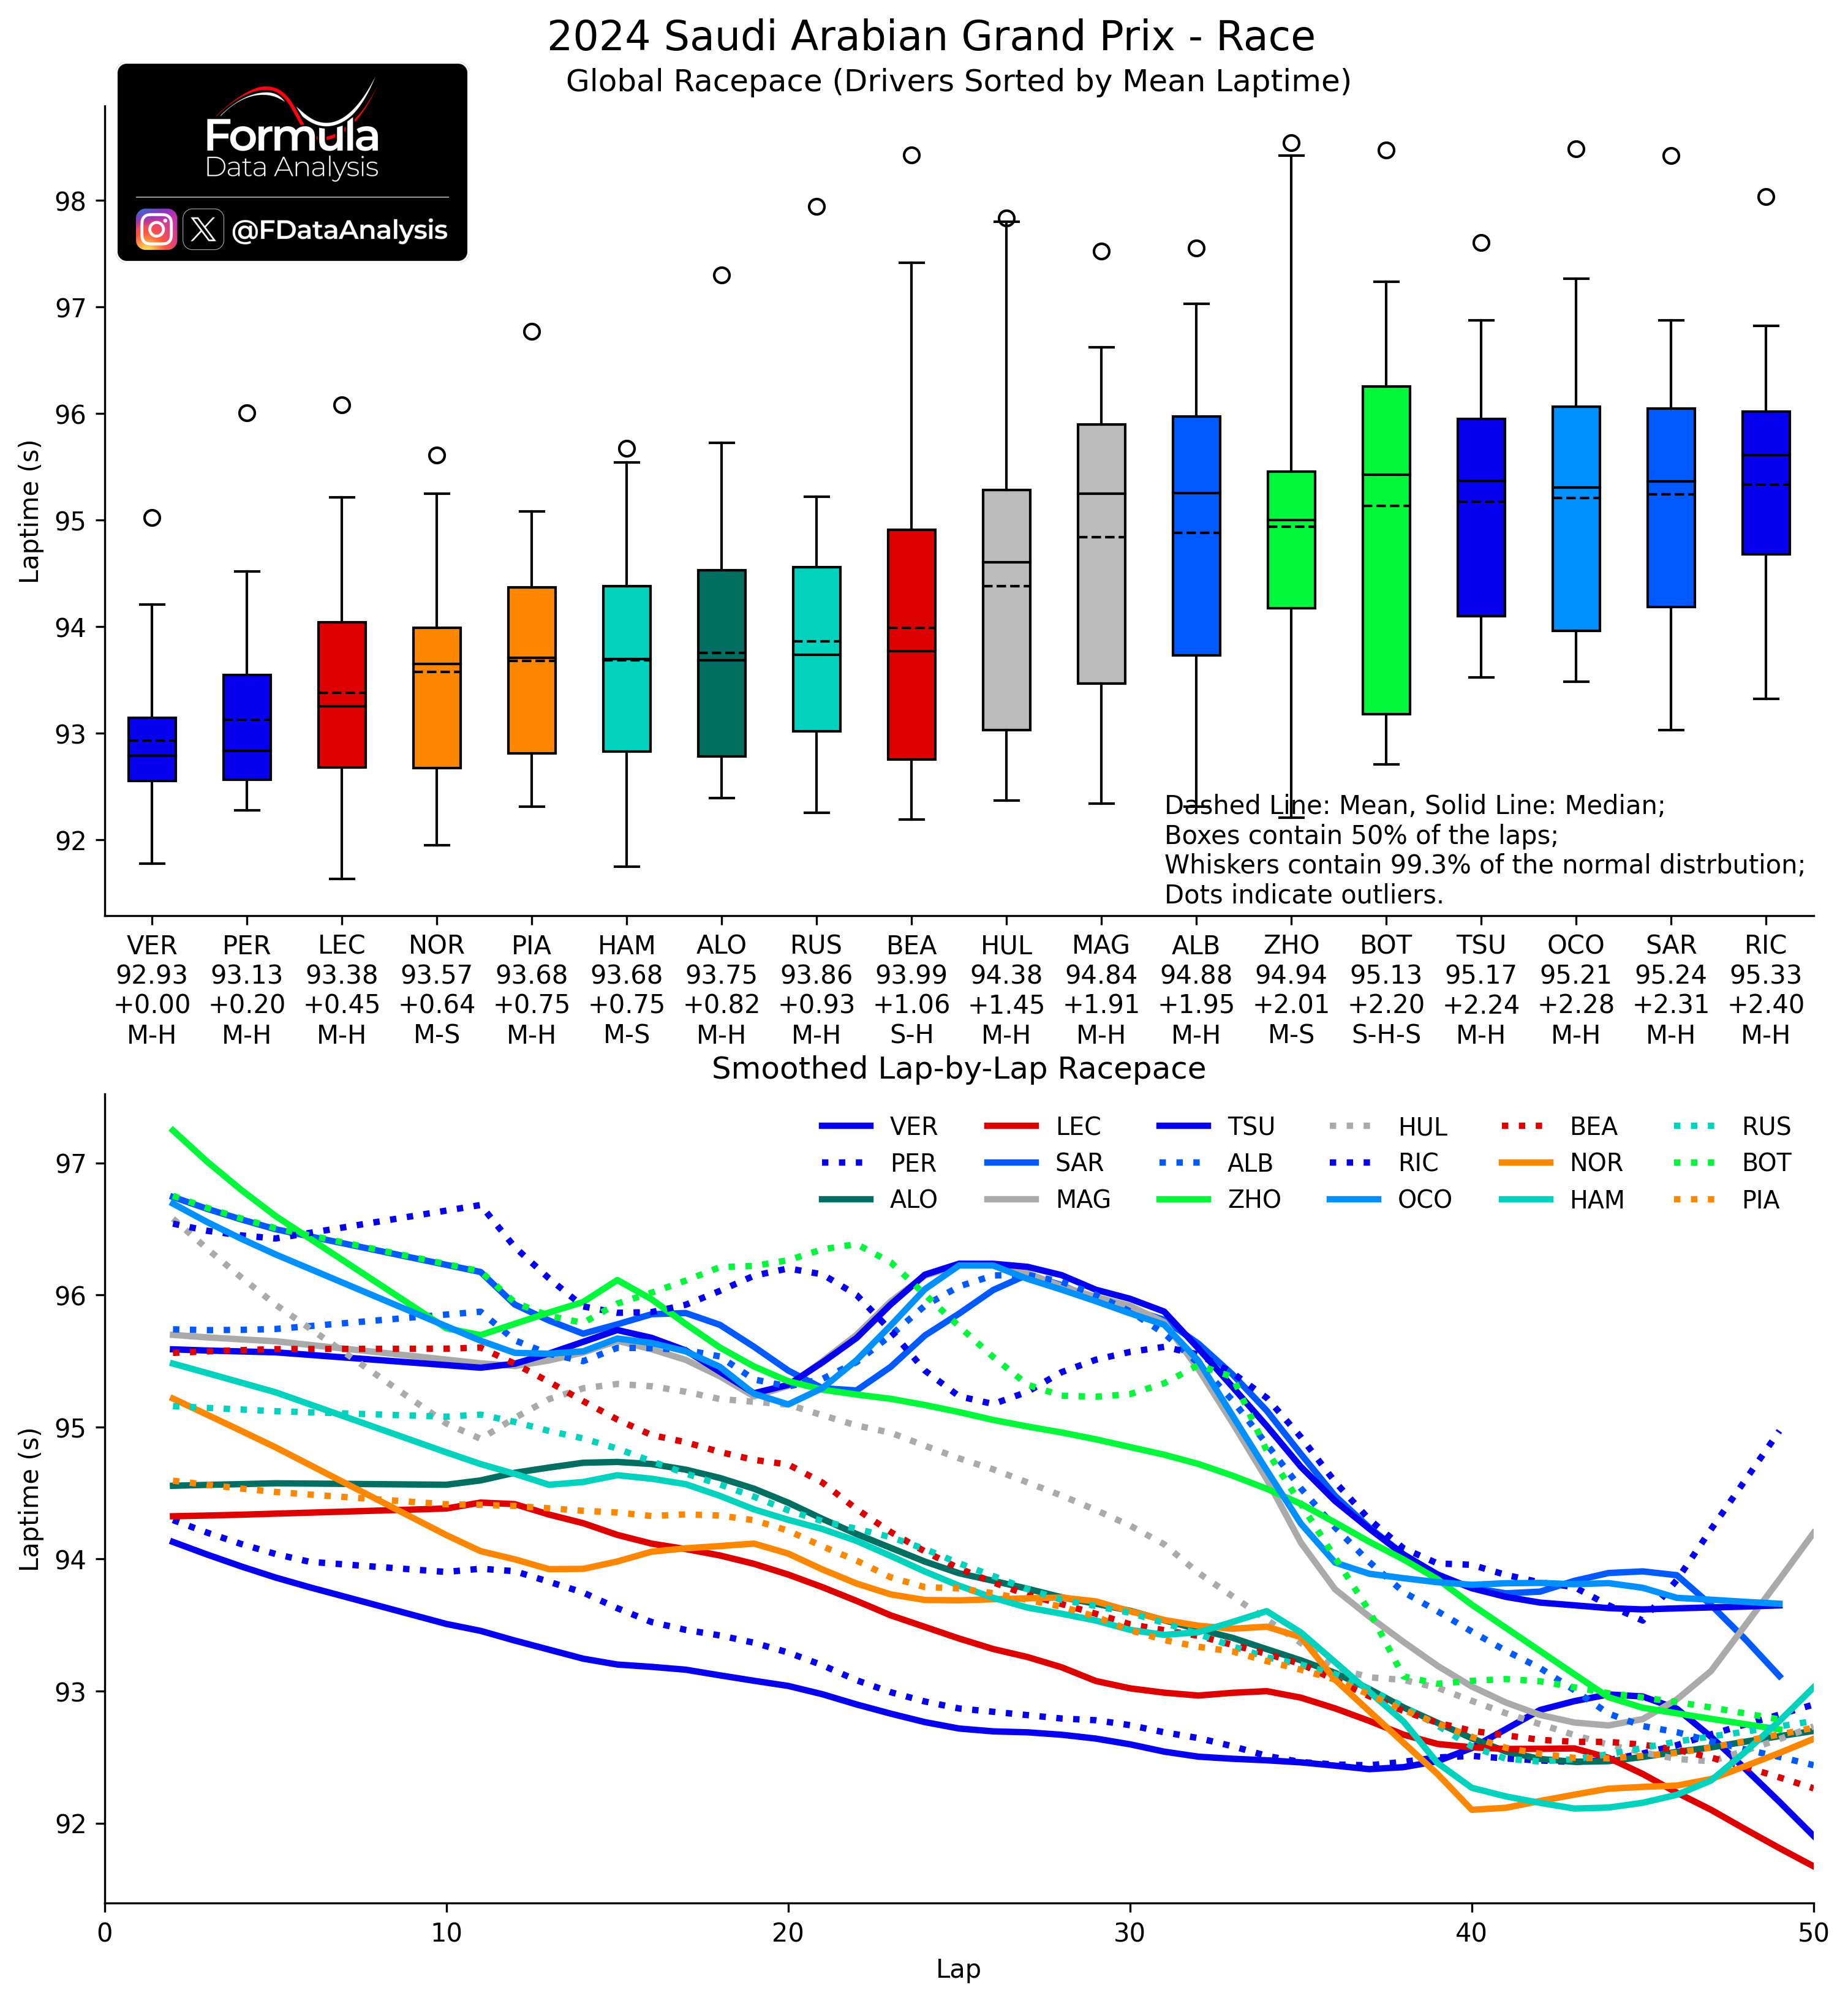
How to read: The upper plot shows the synthesis of each driver's pace during the race. The lower plot shows the (smoothed) evolution through the laps. Each bar contains the central 50% of the distribution: the shorter it is, the more consistent the pace. Inside it, the solid line indicates the MEDIAN (how quick was the TYPICAL lap), while the dashed line indicates the MEAN (how quick was a lap ON AVERAGE). The whiskers include all the laps from a driver that are not uncharacteristically slow for that driver: the lower whisker, in particular, shows that driver's quickest lap. The mean lap time is indicated below each drive's name, and below that is the gap to the quickest driver. The bottom line indicates the tyres used.
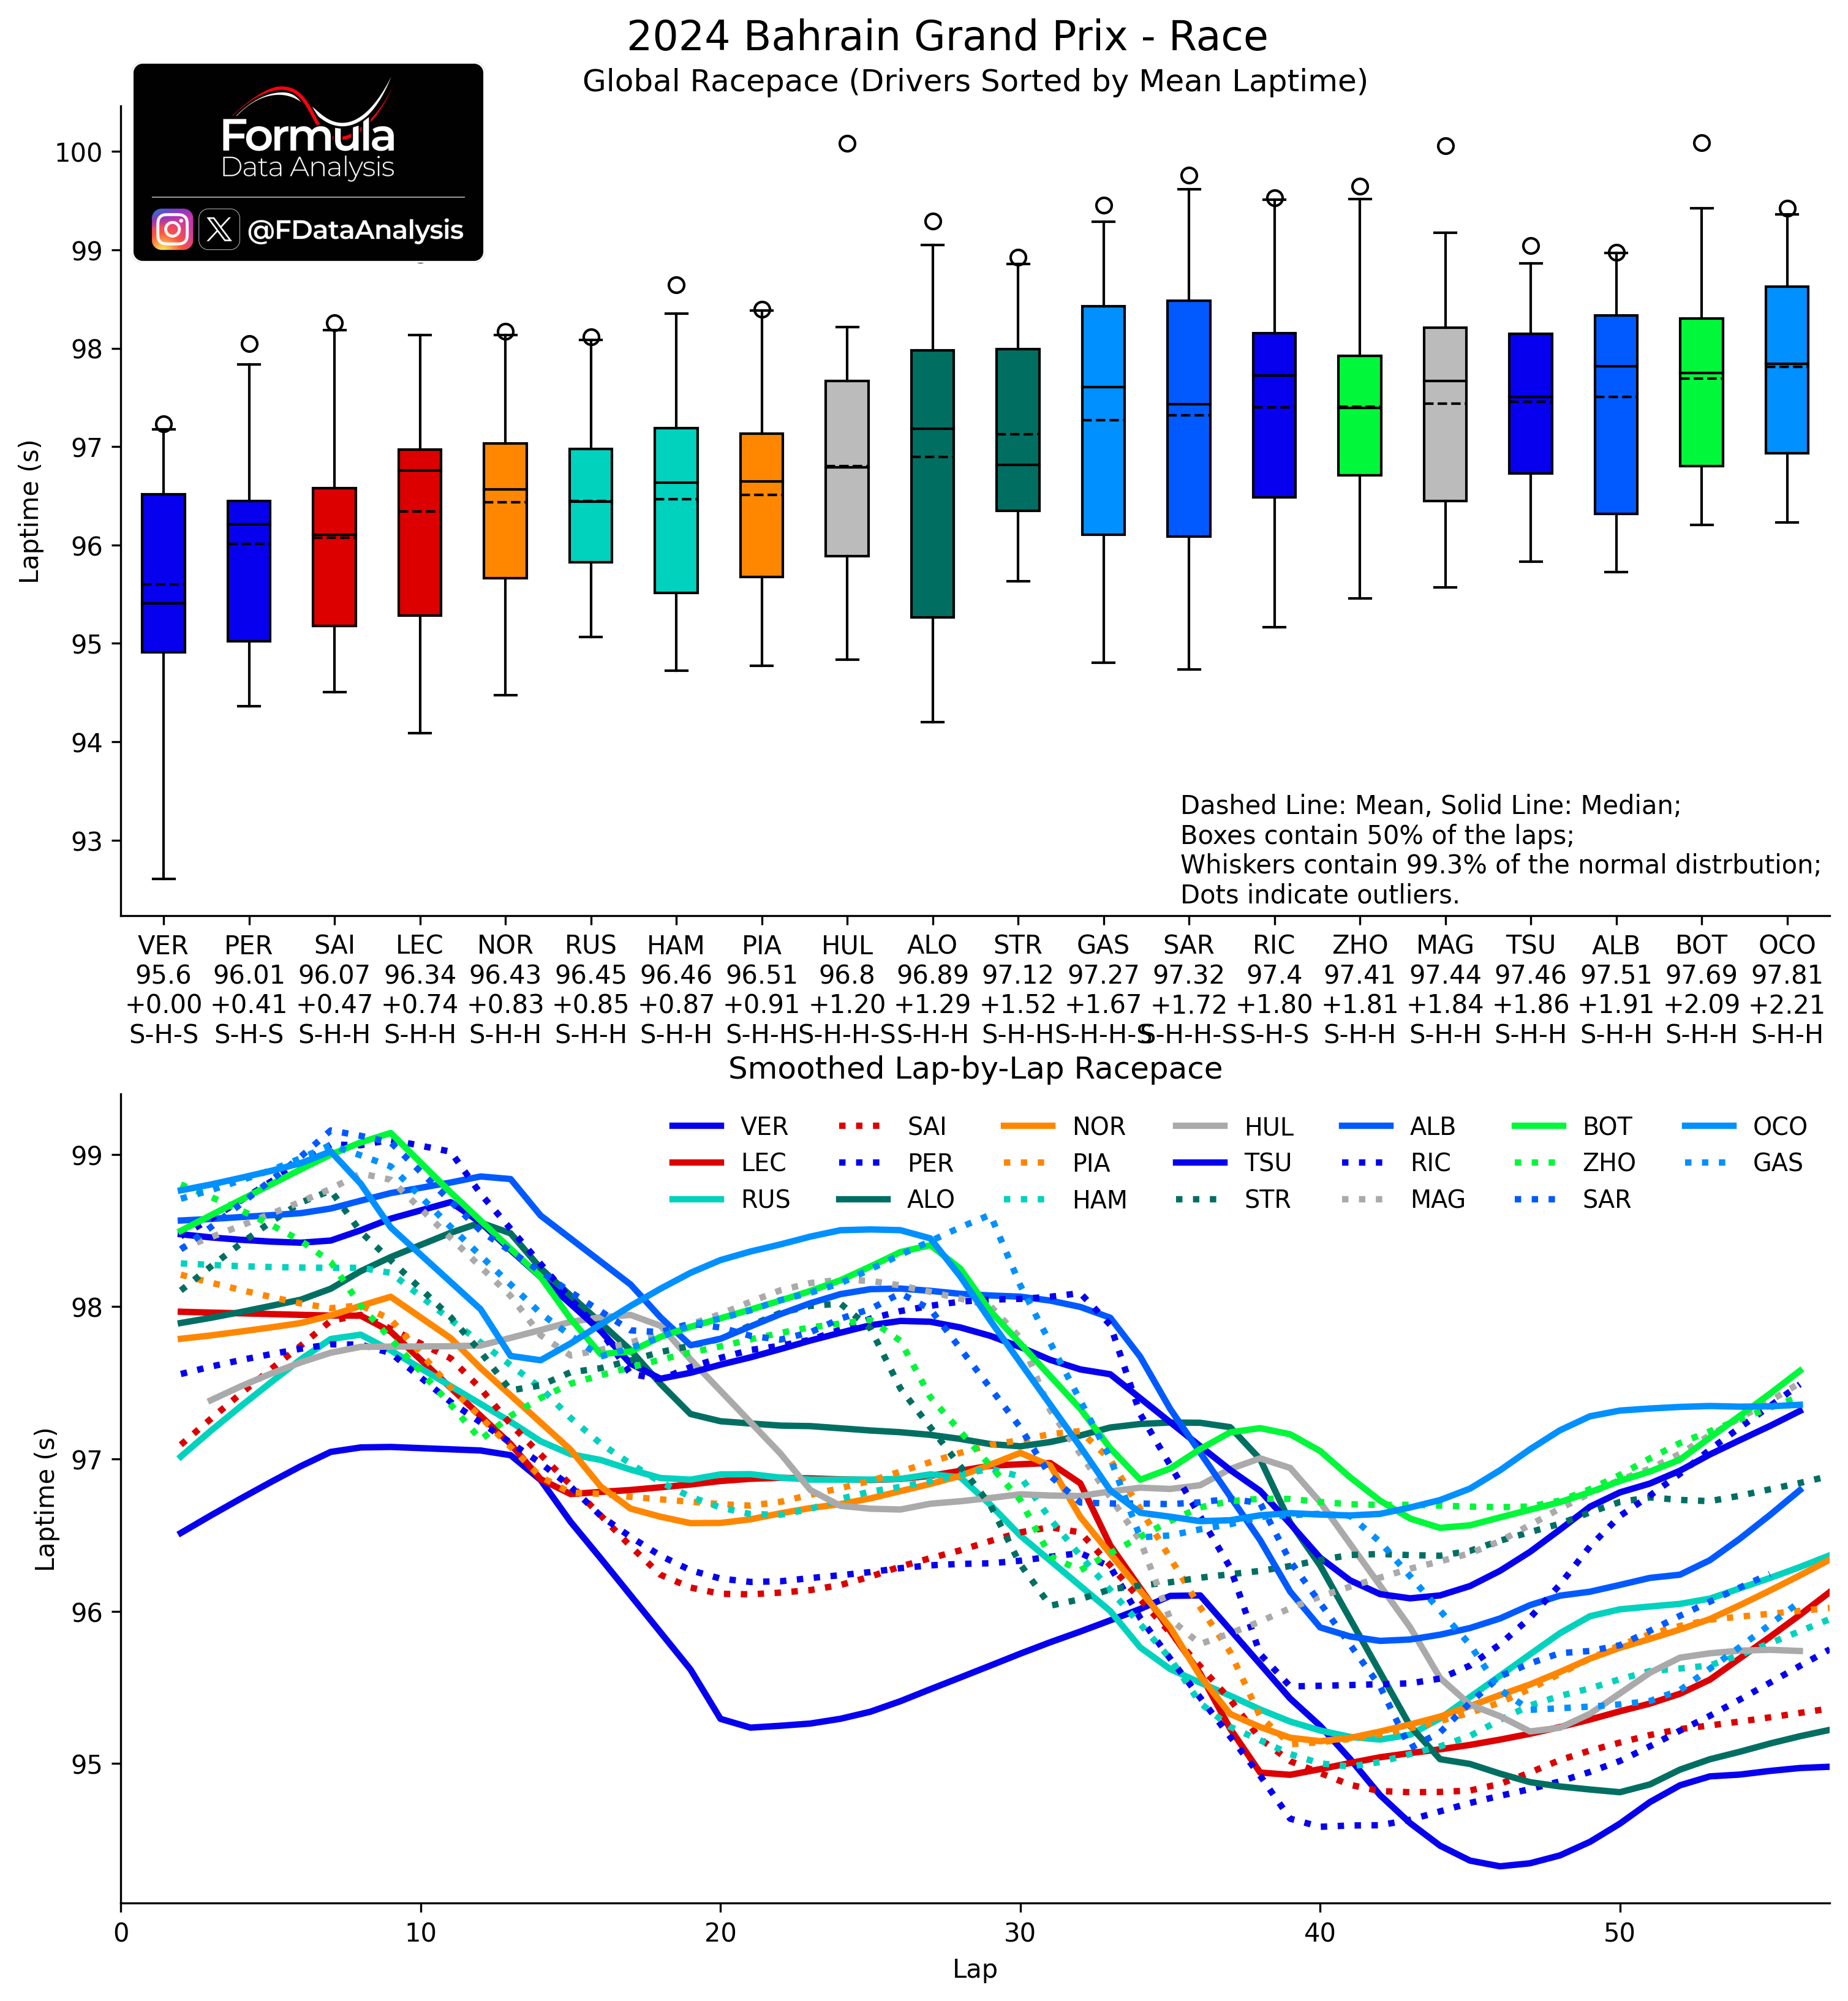
Similarly to Bahrain, Verstappen achieved a comfortable victory. This time, however, Perez was indeed closer: just 0.2s/lap away, contrary to the 0.41s/lap gap he had in Bahrain (partly due to the traffic he experienced there). Once again, the quicker Ferrari was 0.4-0.5s/lap slower than the RedBull: still too far to fight for wins on most tracks, but closer than last year, highlighting the good tyre wear progress made by the team. McLaren was the third fastest car there, despite the possibly wrong rear wing choice made by the team: the Medium-load rear wing was way more loaded than what most teams were running in the fast Jeddah track, and this made Piastri's race a nightmare! (compounded with the fact that Hamilton's Mercedes, instead, was on the other side of the spectrum, using the least-loaded wing on the grid). Mercedes was the 3rd quickest car, especially Hamilton, and the two silver arrows sandwiched Alonso. Only the Spaniard had the pace to compete with the front runners, though (also in qualifying): when considering each team's faster driver, Aston was possibly only the 5th fastest car in the race.
A note of merit to Haas: the car has improved significantly, and is gifted with an excellent top speed AND race pace, which is an uncommon combo! The car was best-of-the-rest in Jeddah, making Hulkenberg score the team's first points, achieving a current P6 in the WCC. The Racing Bull car seems to suffer traffic significantly: Tsunoda and Ricciardo didn't shine while battling with other drivers.
Last year's race pace, for comparison. McLaren's and Ferrari's improvements are clear, and they mirror Aston Martin's demise. The fastest non-RB driver was closer to VER yesterday than he was last year.
Change vs 2023 (Faster driver, s/lap)
McL -1.88
Ferrari -1.15
Williams -1.11
Haas -0.93
Sauber -0.64 (and one less stop)
Merc -0.59
RedBull -0.52
VCARB -0.34
Aston -0.27
Alpine +0.15

Race pace in the last race was, for comparison:
Stints Comparison
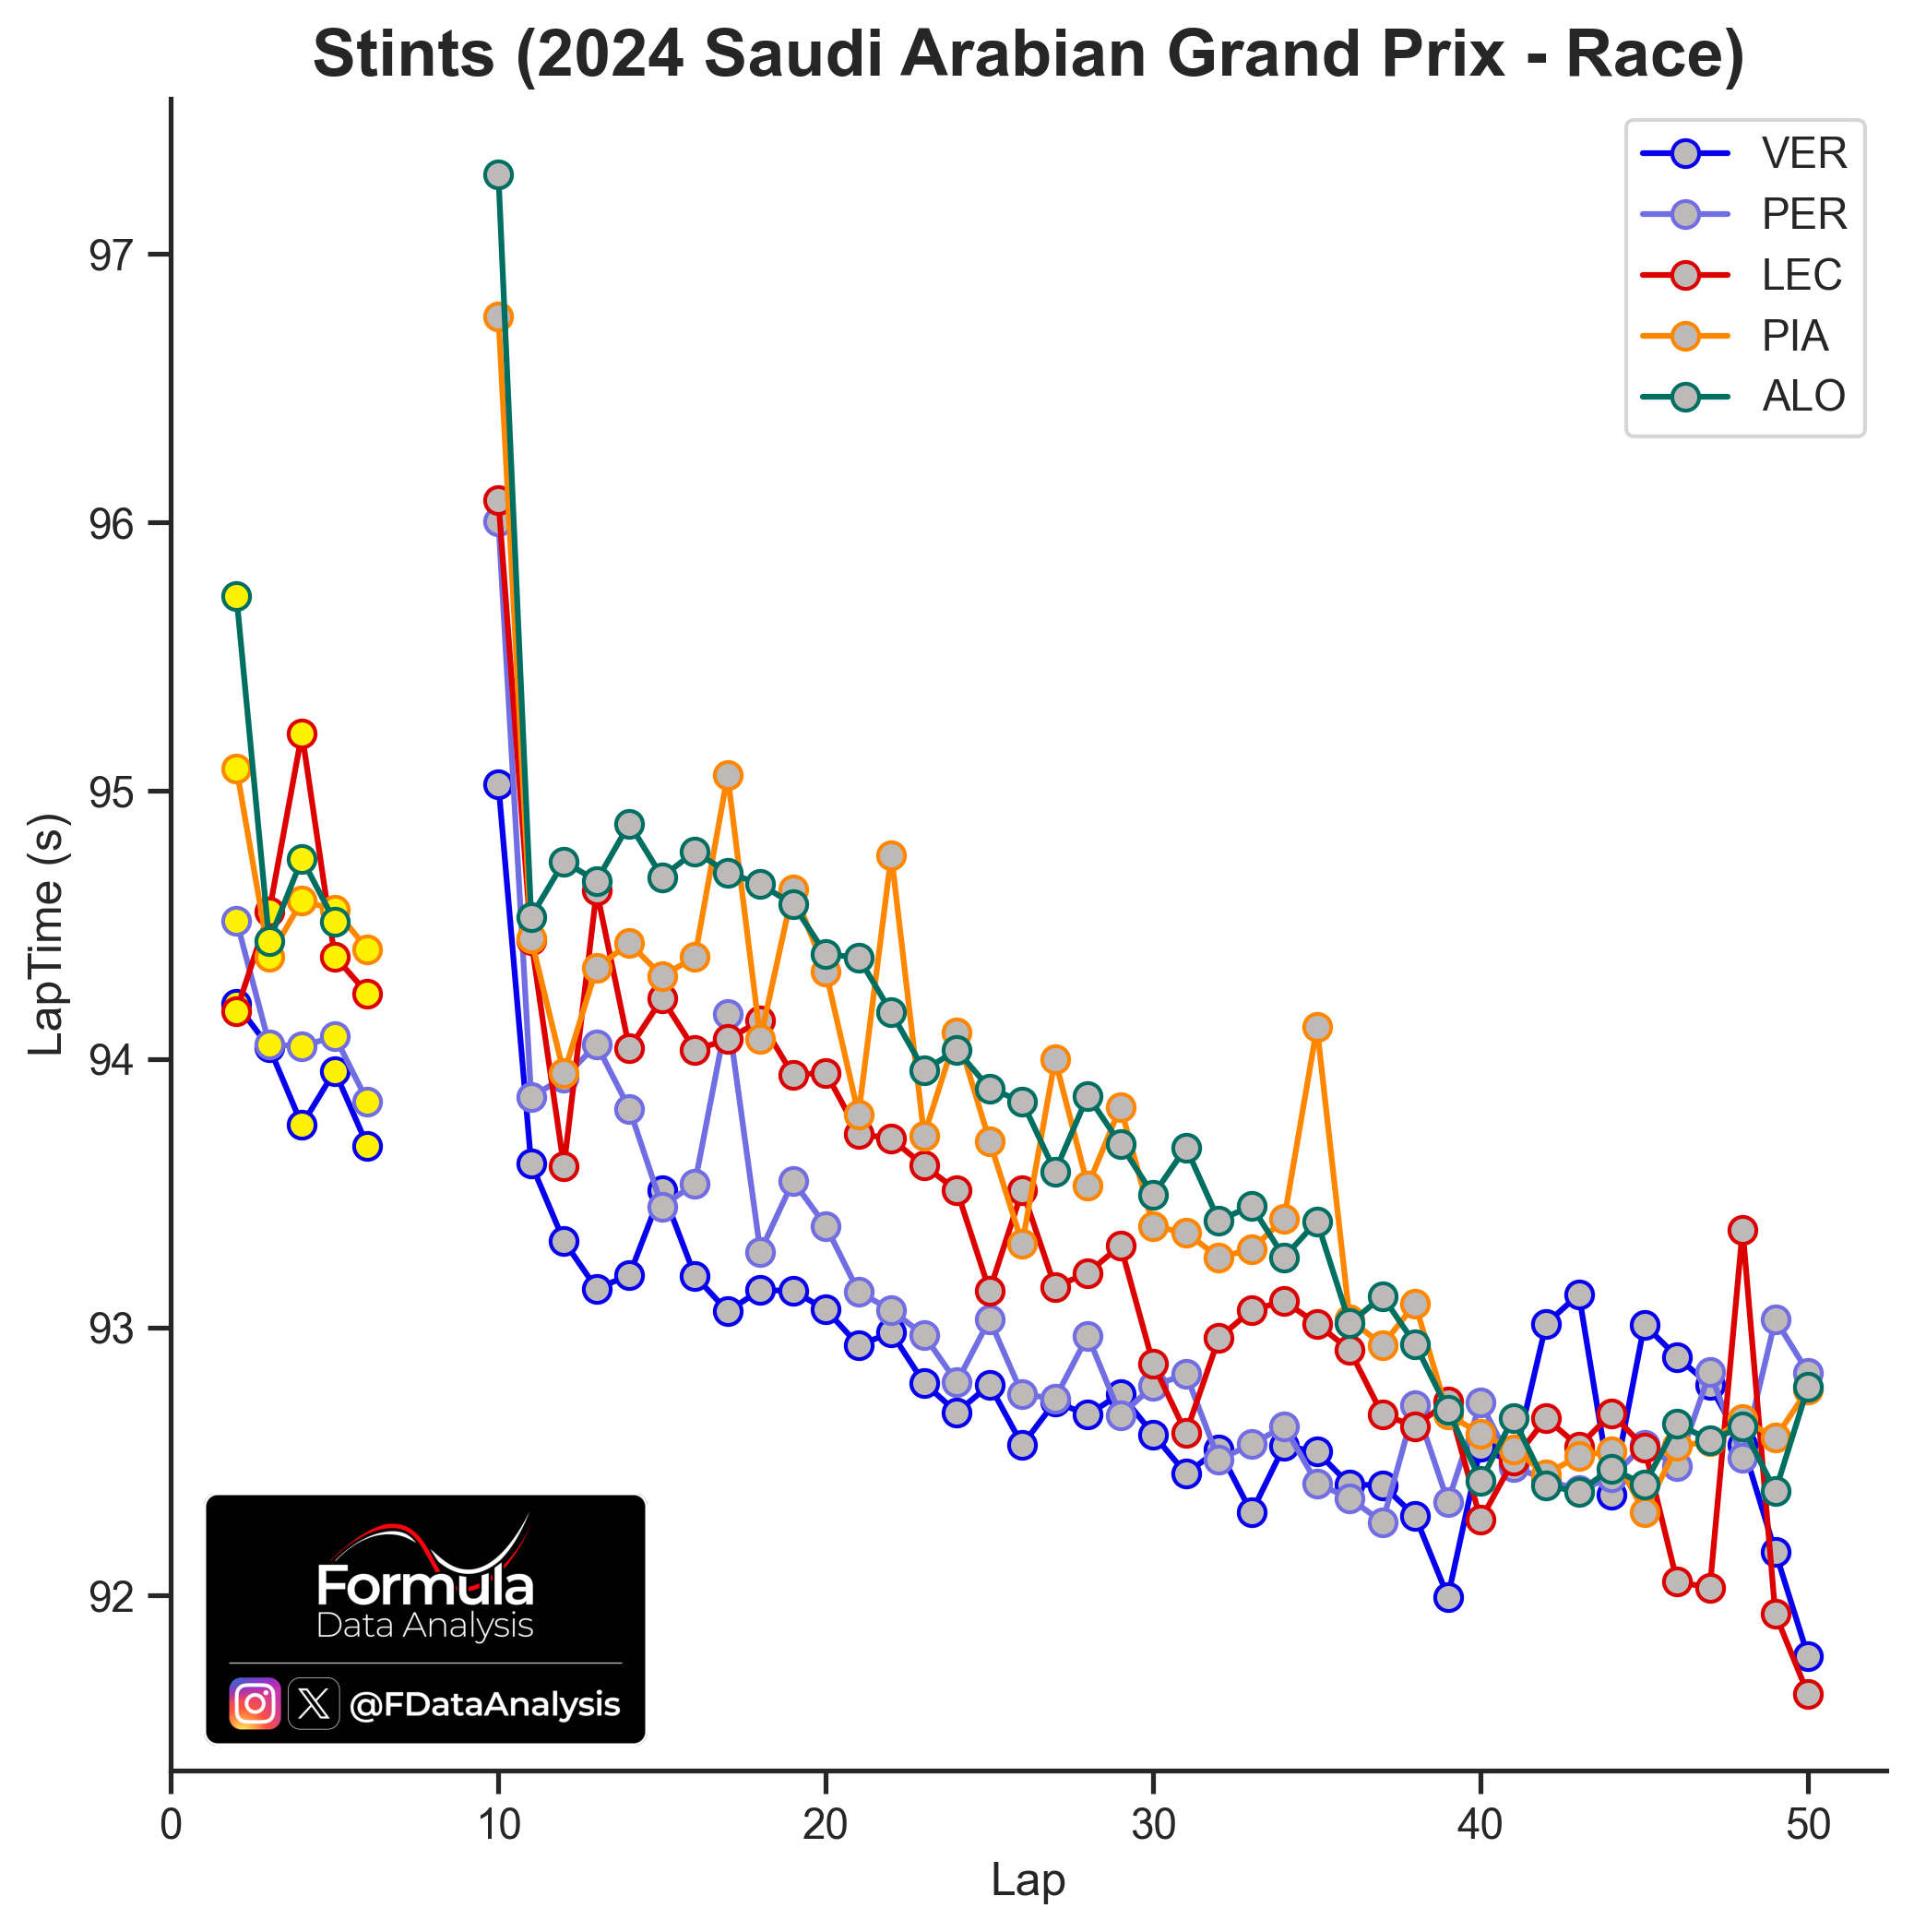
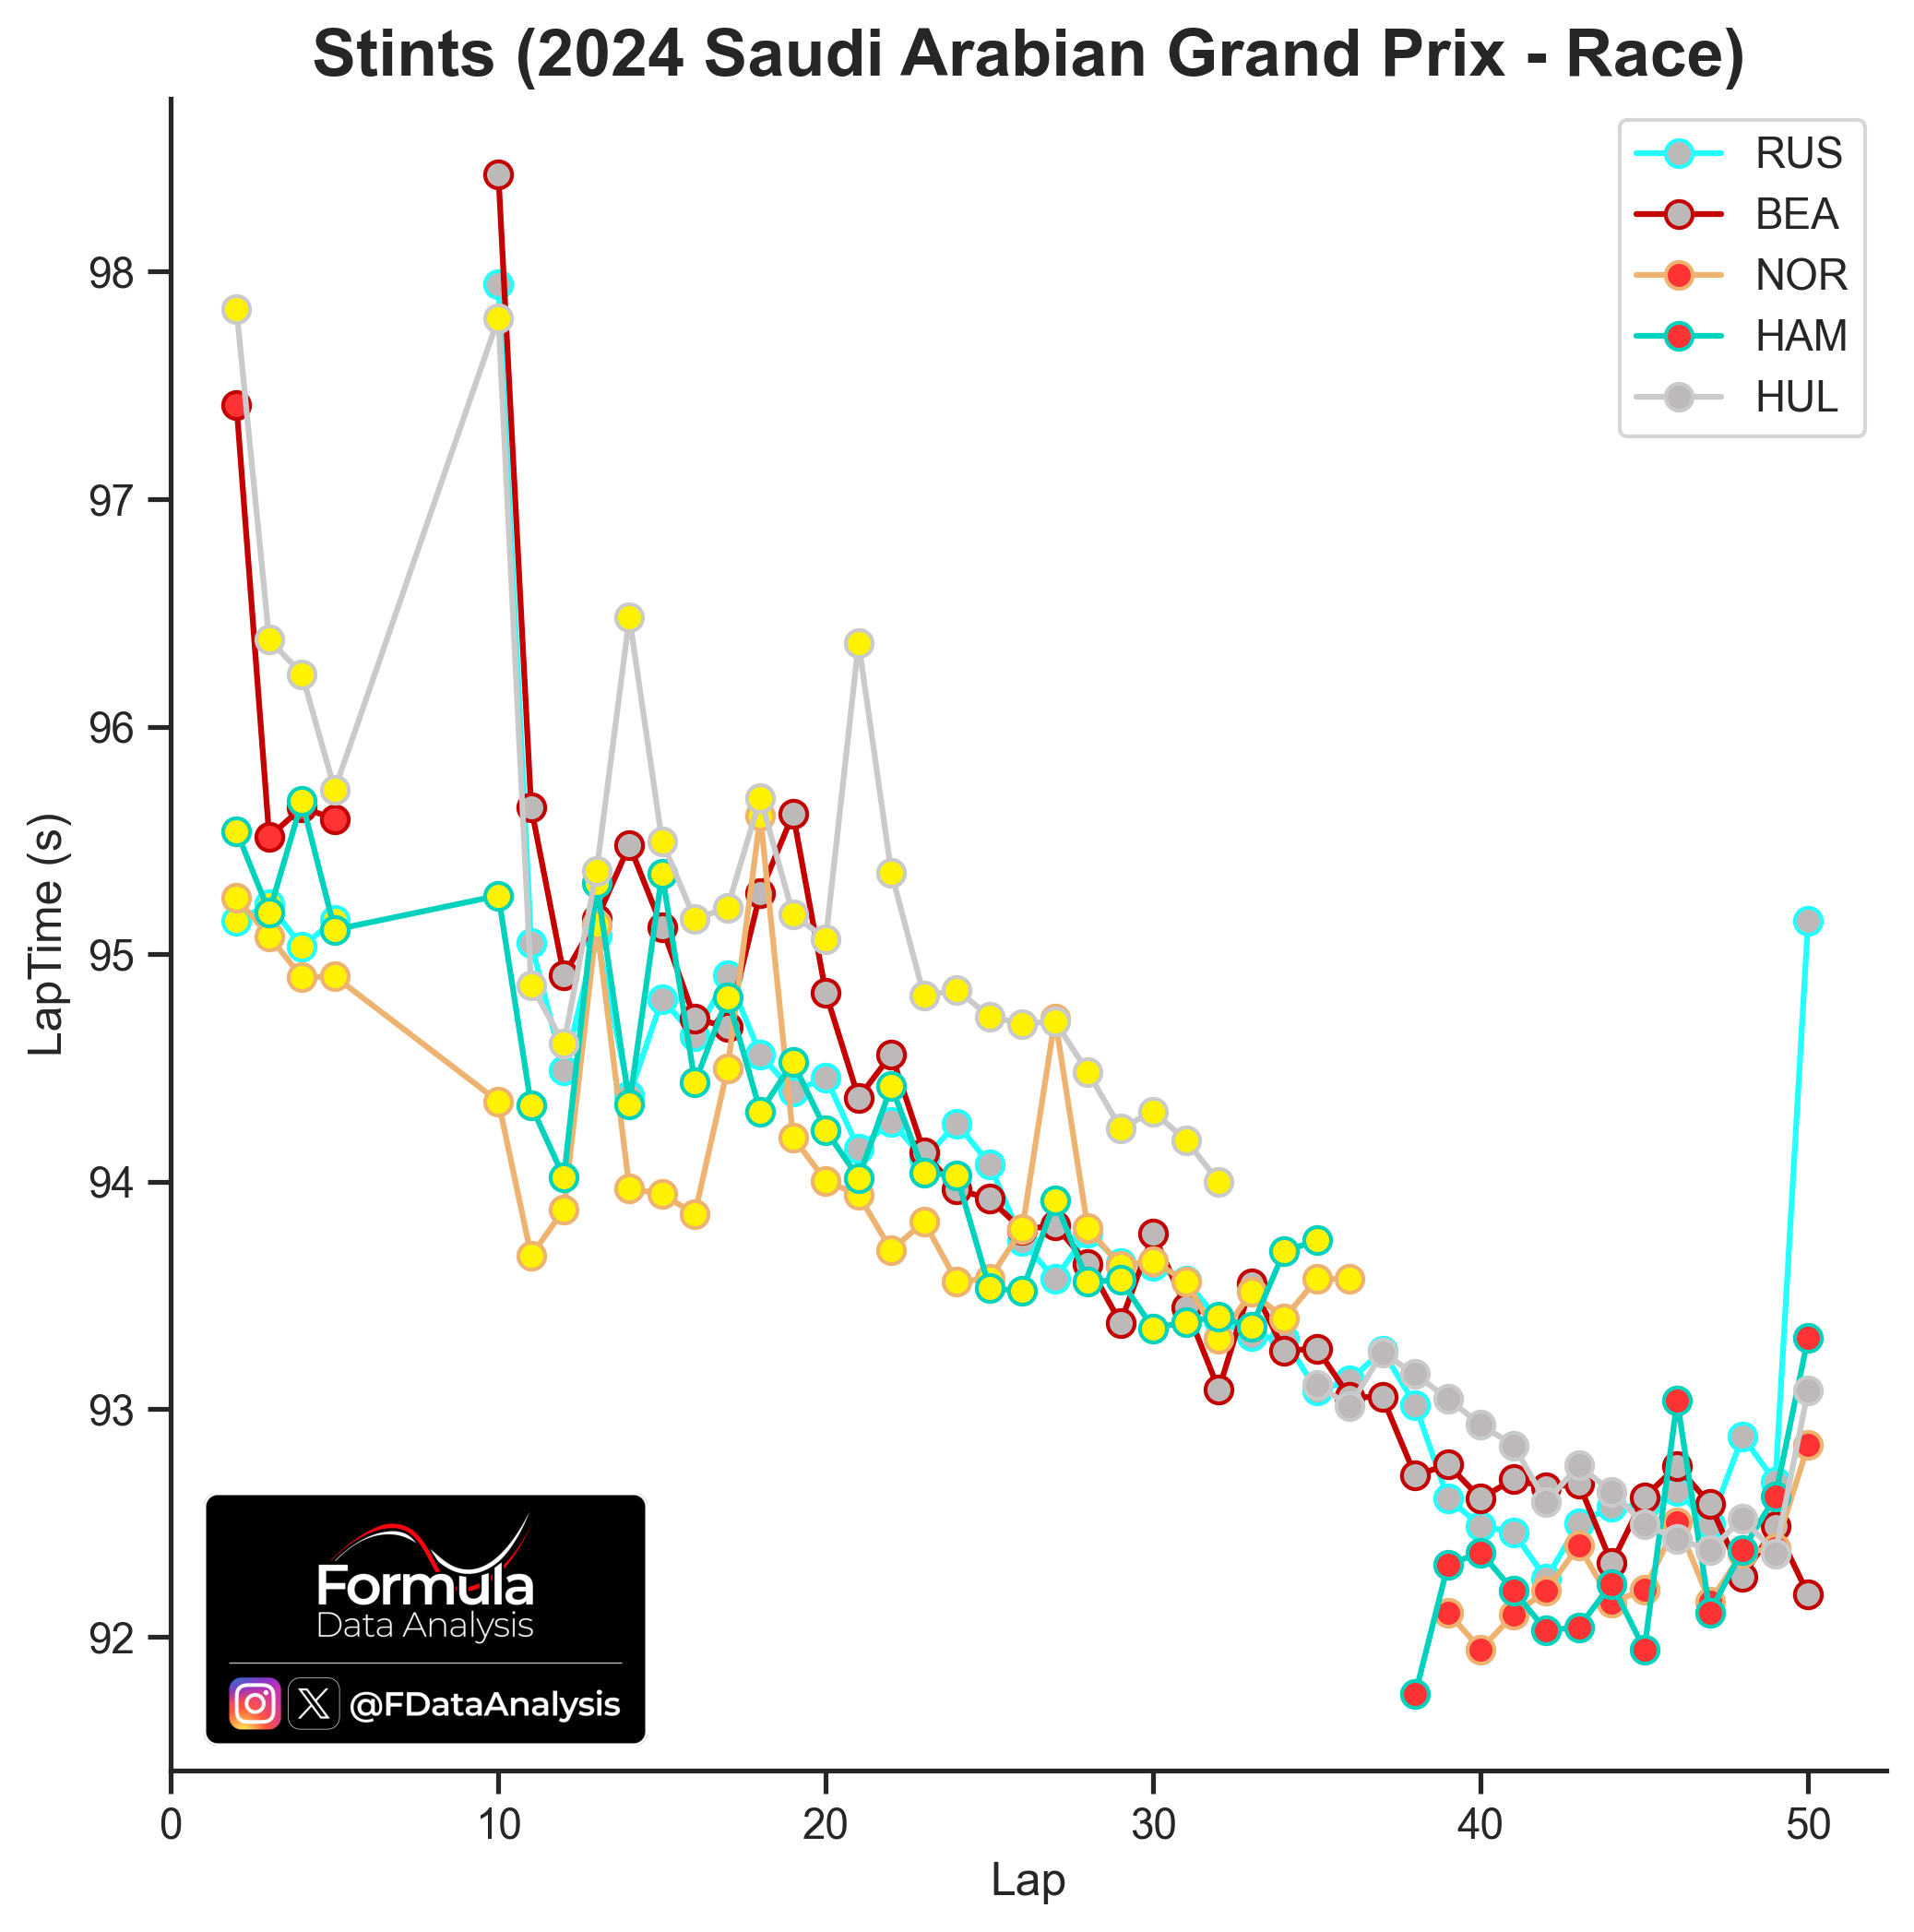
How to read: the chart shows the lap times of several drivers. Each dot is a lap. The dot colour indicates the compound used: red for Softs, yellow for Mediums, and grey for Hards.
P1-P5
In the first stint, Alonso could keep Piastri's pace, but he had no chances once Piastri mounted new hards. Notably, Alonso's car came to life in the last portion of the stint: the Aston seems to perform significantly better on low fuel, as in qualifying and in the last part of the last stint: something to work on.
You can see Leclerc's and Verstappen's attempt at FL in the last 2 laps: Max had to concede!
P6-P10
Bearman made notable progress on his second stint: he hit lower and lower lap times, with no significant effect of tyre wear. He probably grew his confidence throughout the race: towards the end, he was the fastest driver in this pack! Russell was facing severe issues in his last lap: he lapped in the 1:35s against Bearman's 1:32
Overall Compound Performance
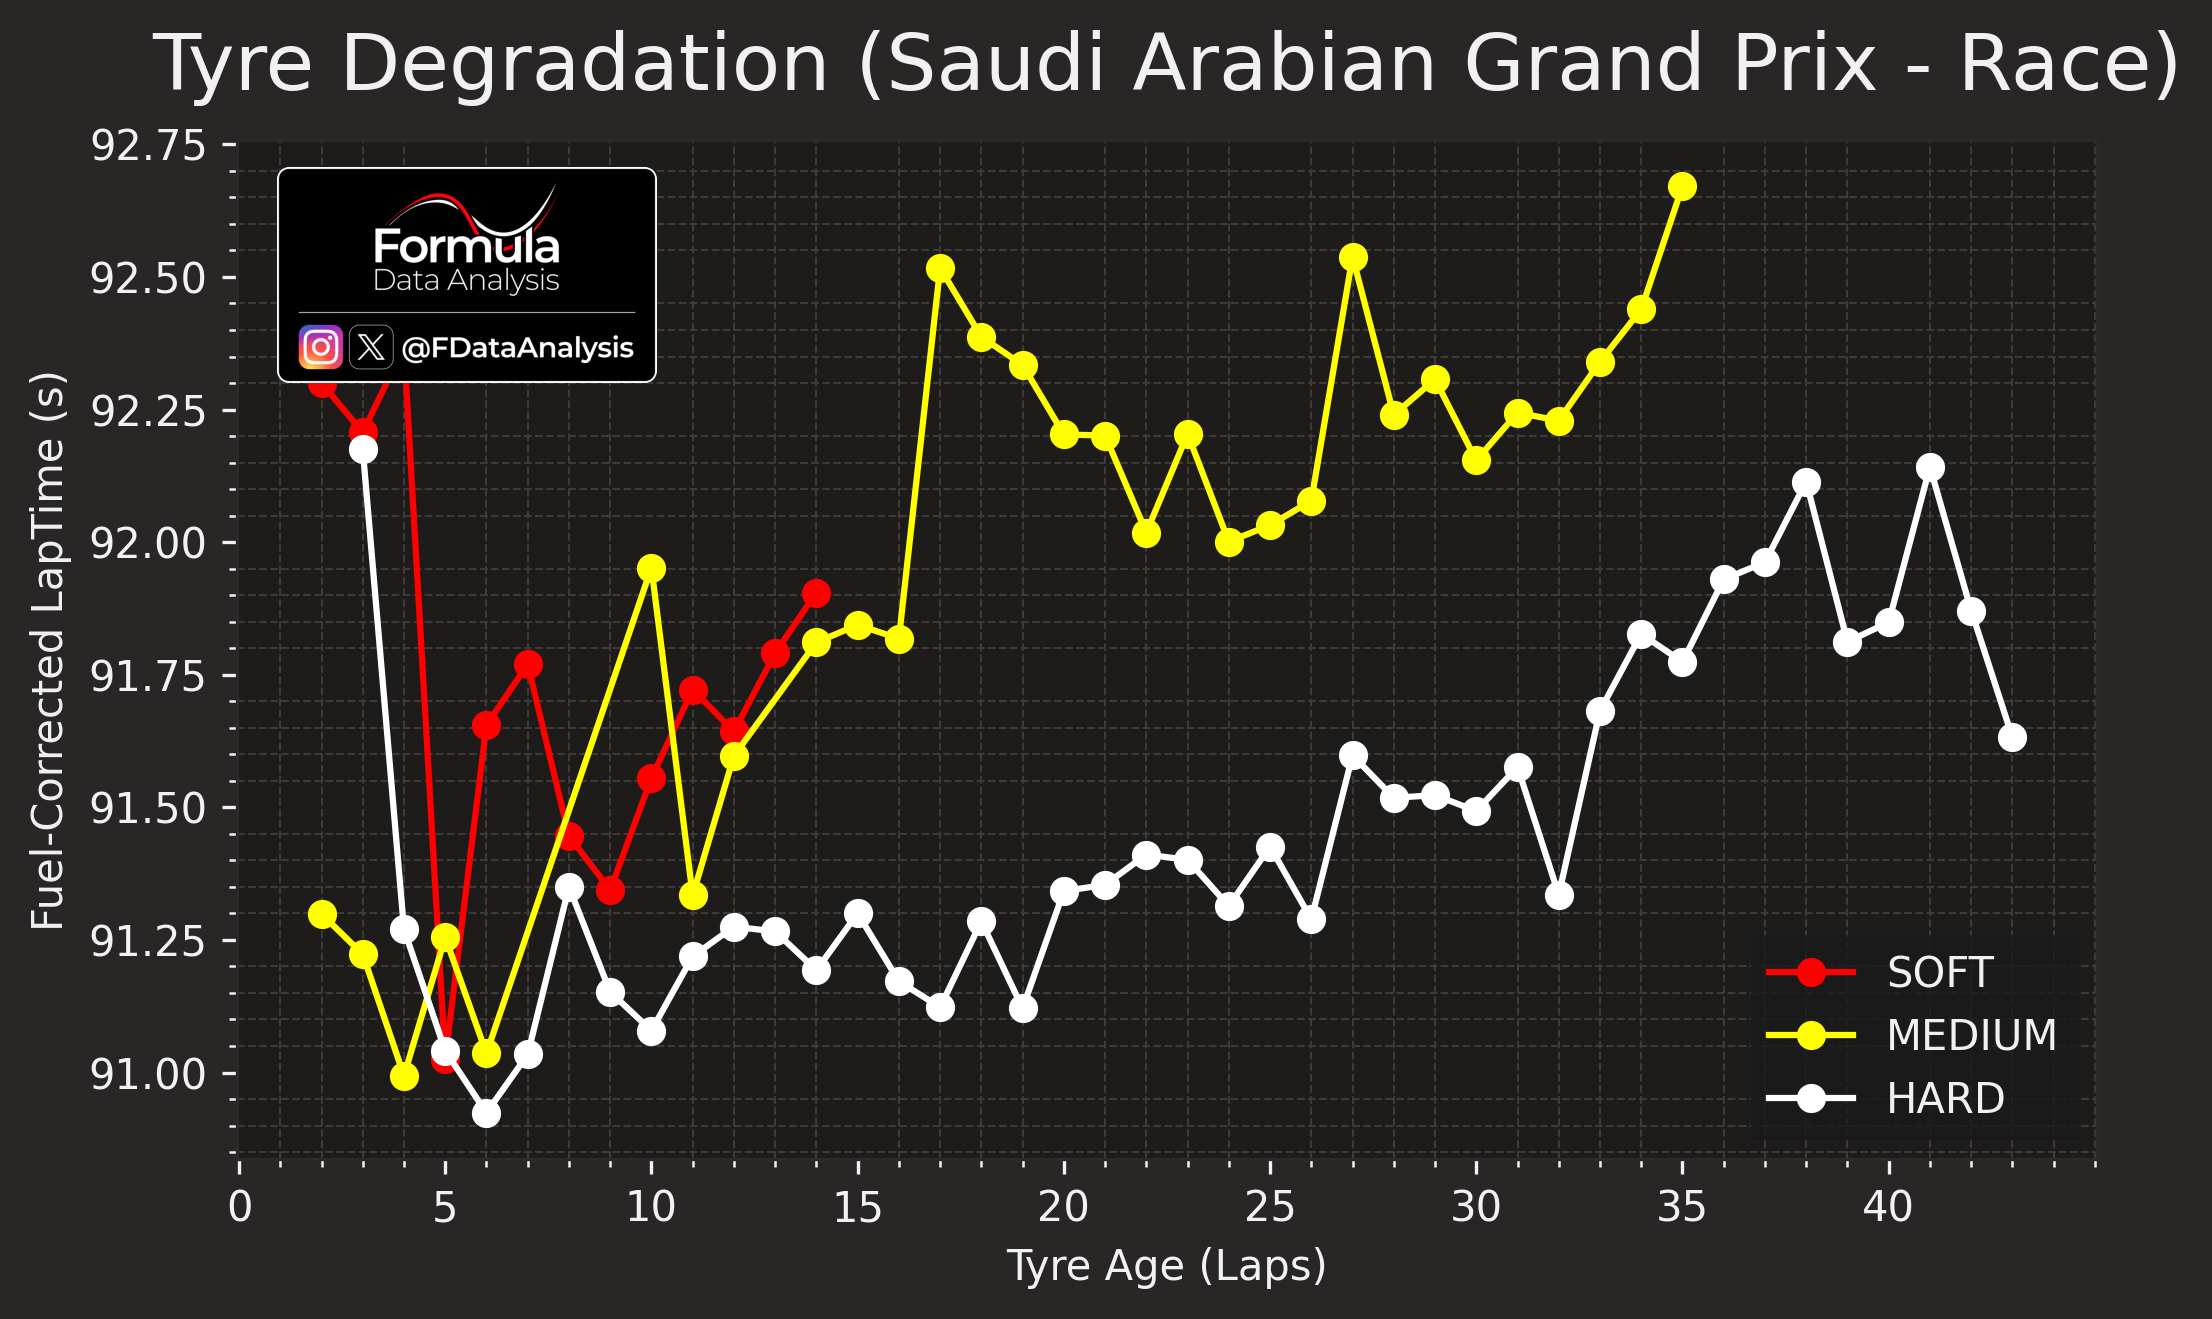
How to read: the chart shows the fuel-corrected lap time produced on each tyre compound at a given 'tyre age'. It is produced by taking the fastest lap for a given tyre age when at least 3 drivers reached that tyre age
The Hards were the best-performing compound, period. Good pace from the get-go, and significant durability. The Mediums degraded significantly more quickly. The softs behaved similarly to the Mediums. The Hards could easily cover over 40 laps, indicating that maybe one-step softer tyres would have been more appropriate.
Top Speeds
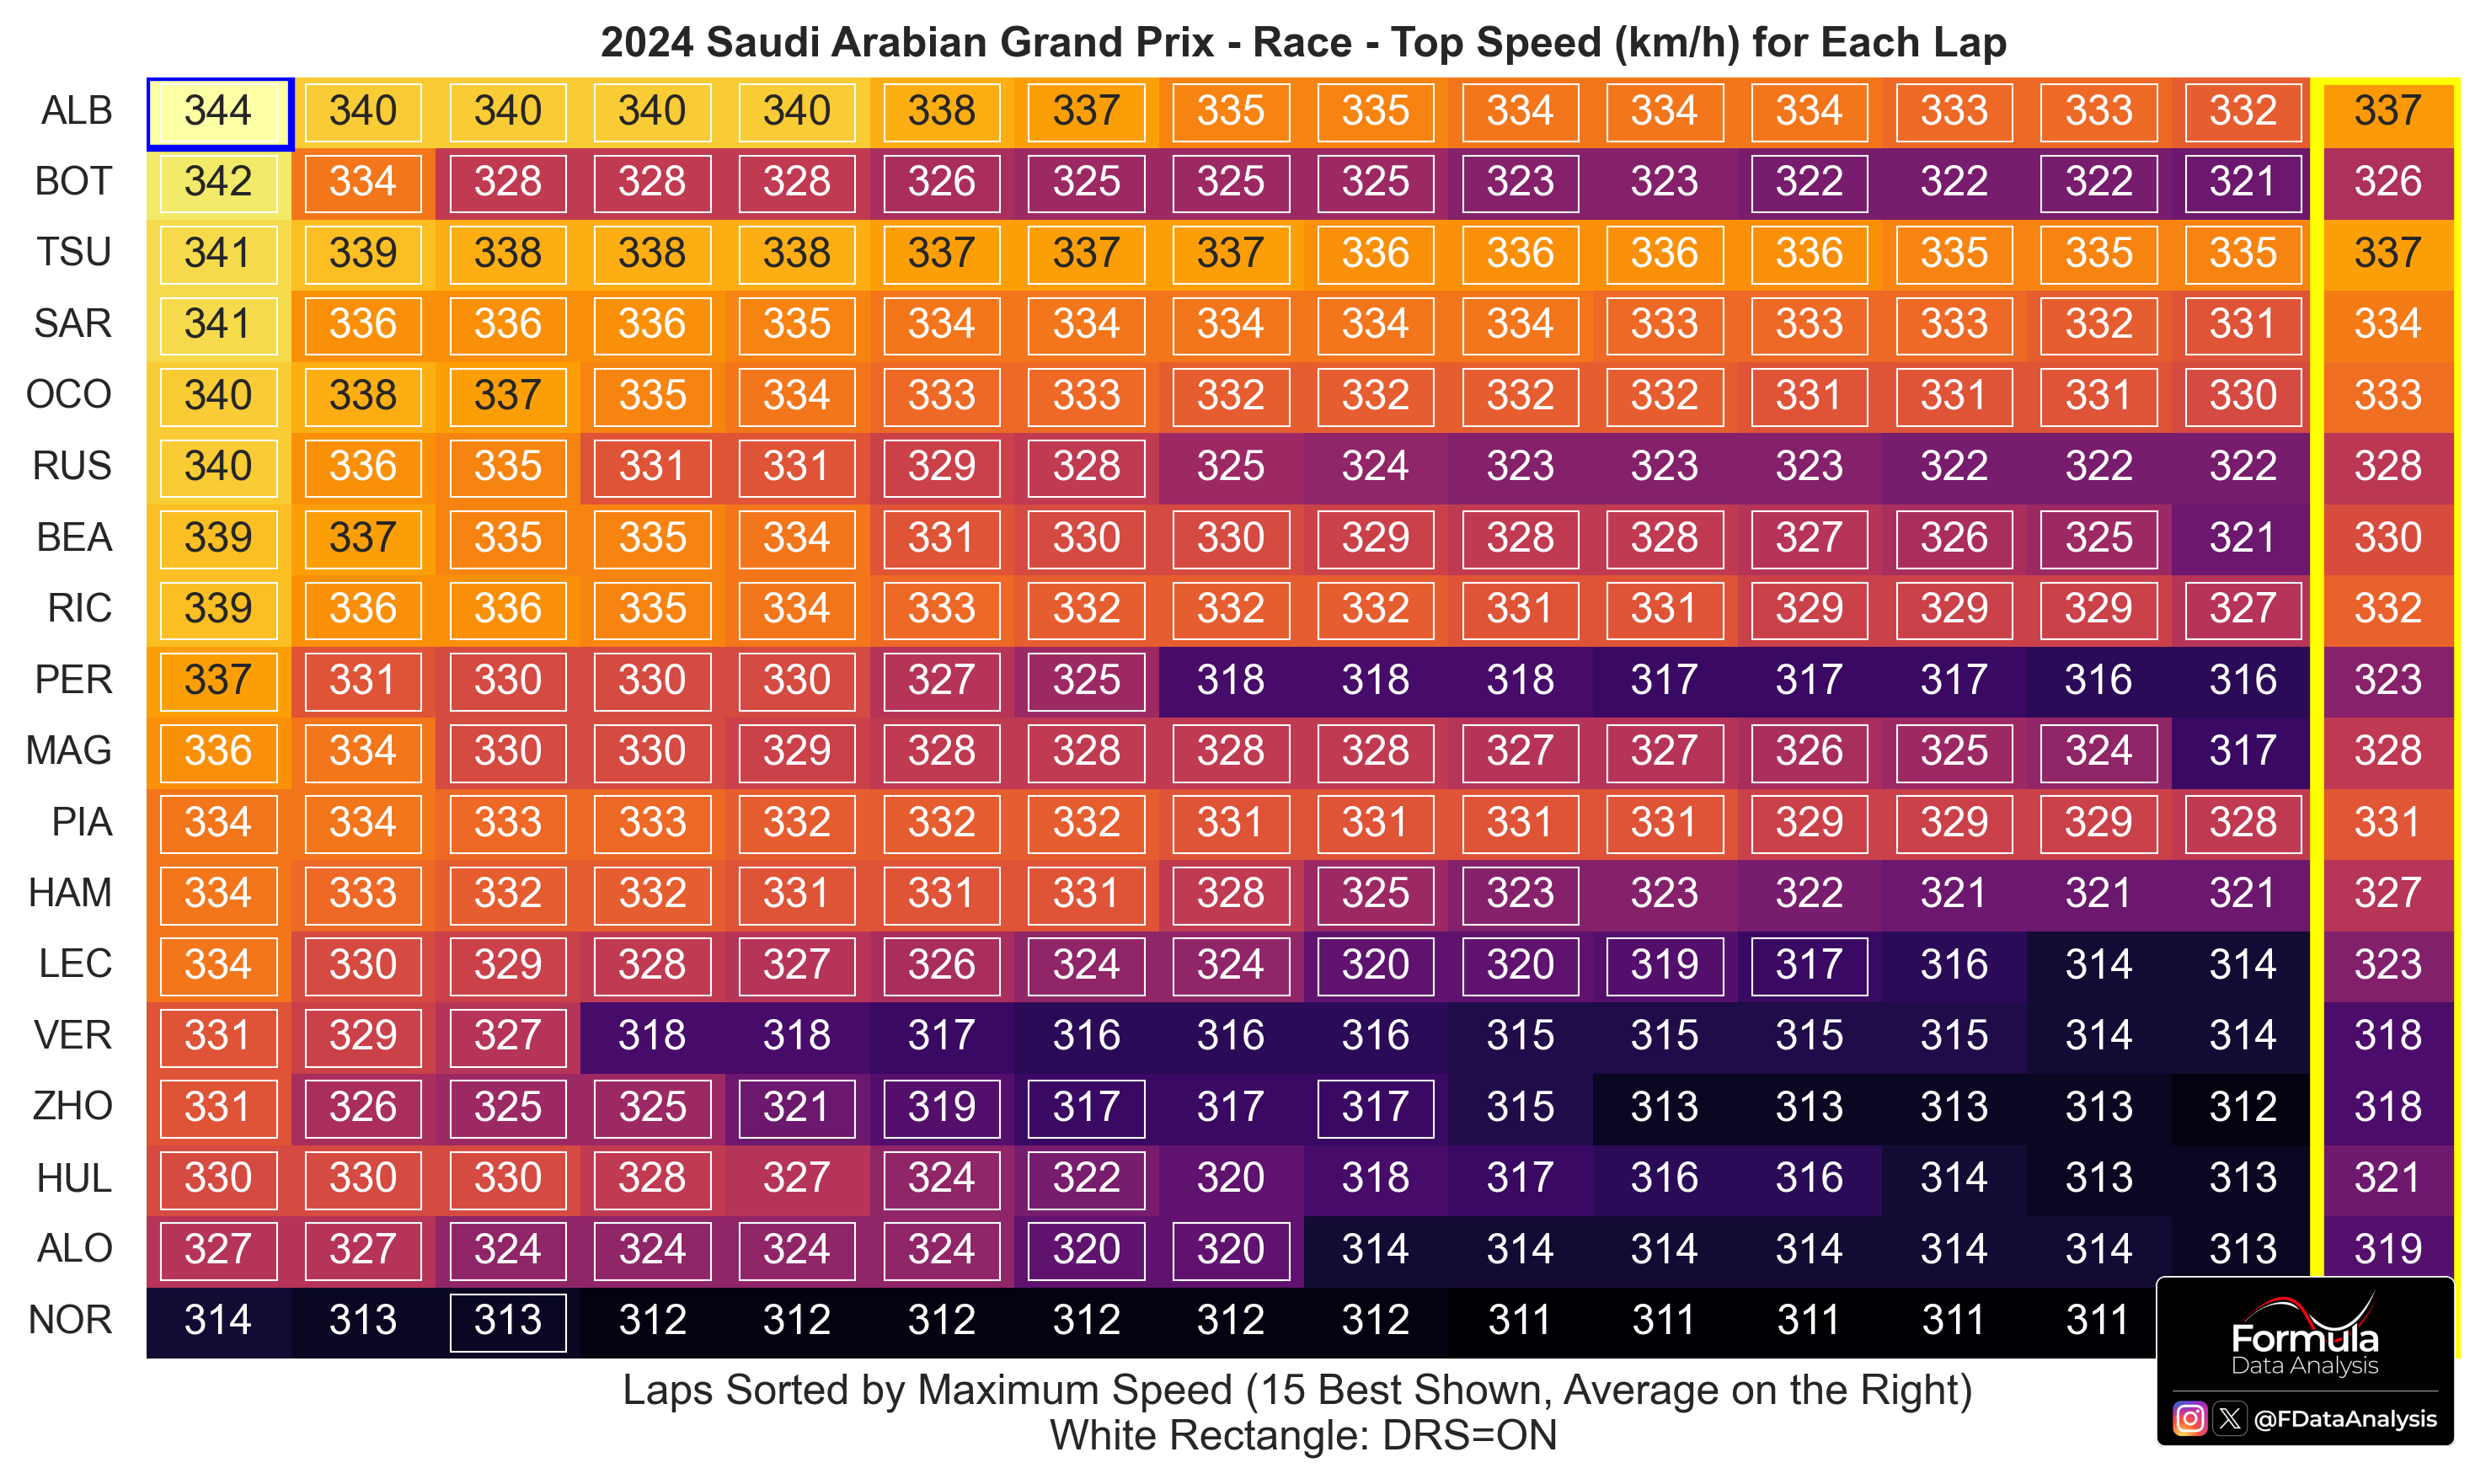
How to read: the chart shows the highest top speed values reached by each driver during the race. The drivers are sorted in descending order of highest to lowest top speed. For a given driver, the top speeds in each lap are sorted from highest (left) to lowest (right): the highest 15 values are shown. The column on the right shows the average of these 15 values. Values relative to DRS being active are surrounded by a white box.
In qualifying (where everyone uses DRS and tows are almost absent), Haas and Mercedes were the fastest. McLaren, instead, was clearly the slowest. This transposed to the race, even though the tows partially masked the situation.
Norris only reached 314km/h in the race, as he was the only driver to never use DRS: his non-DRS speed was particularly low and on par with Alonso. Compare it with Russell, 325km/h and Hamilkton's 323km/h: no wonder Piastri struggles massively to overtake Hamilton!
Next Race - Australia!
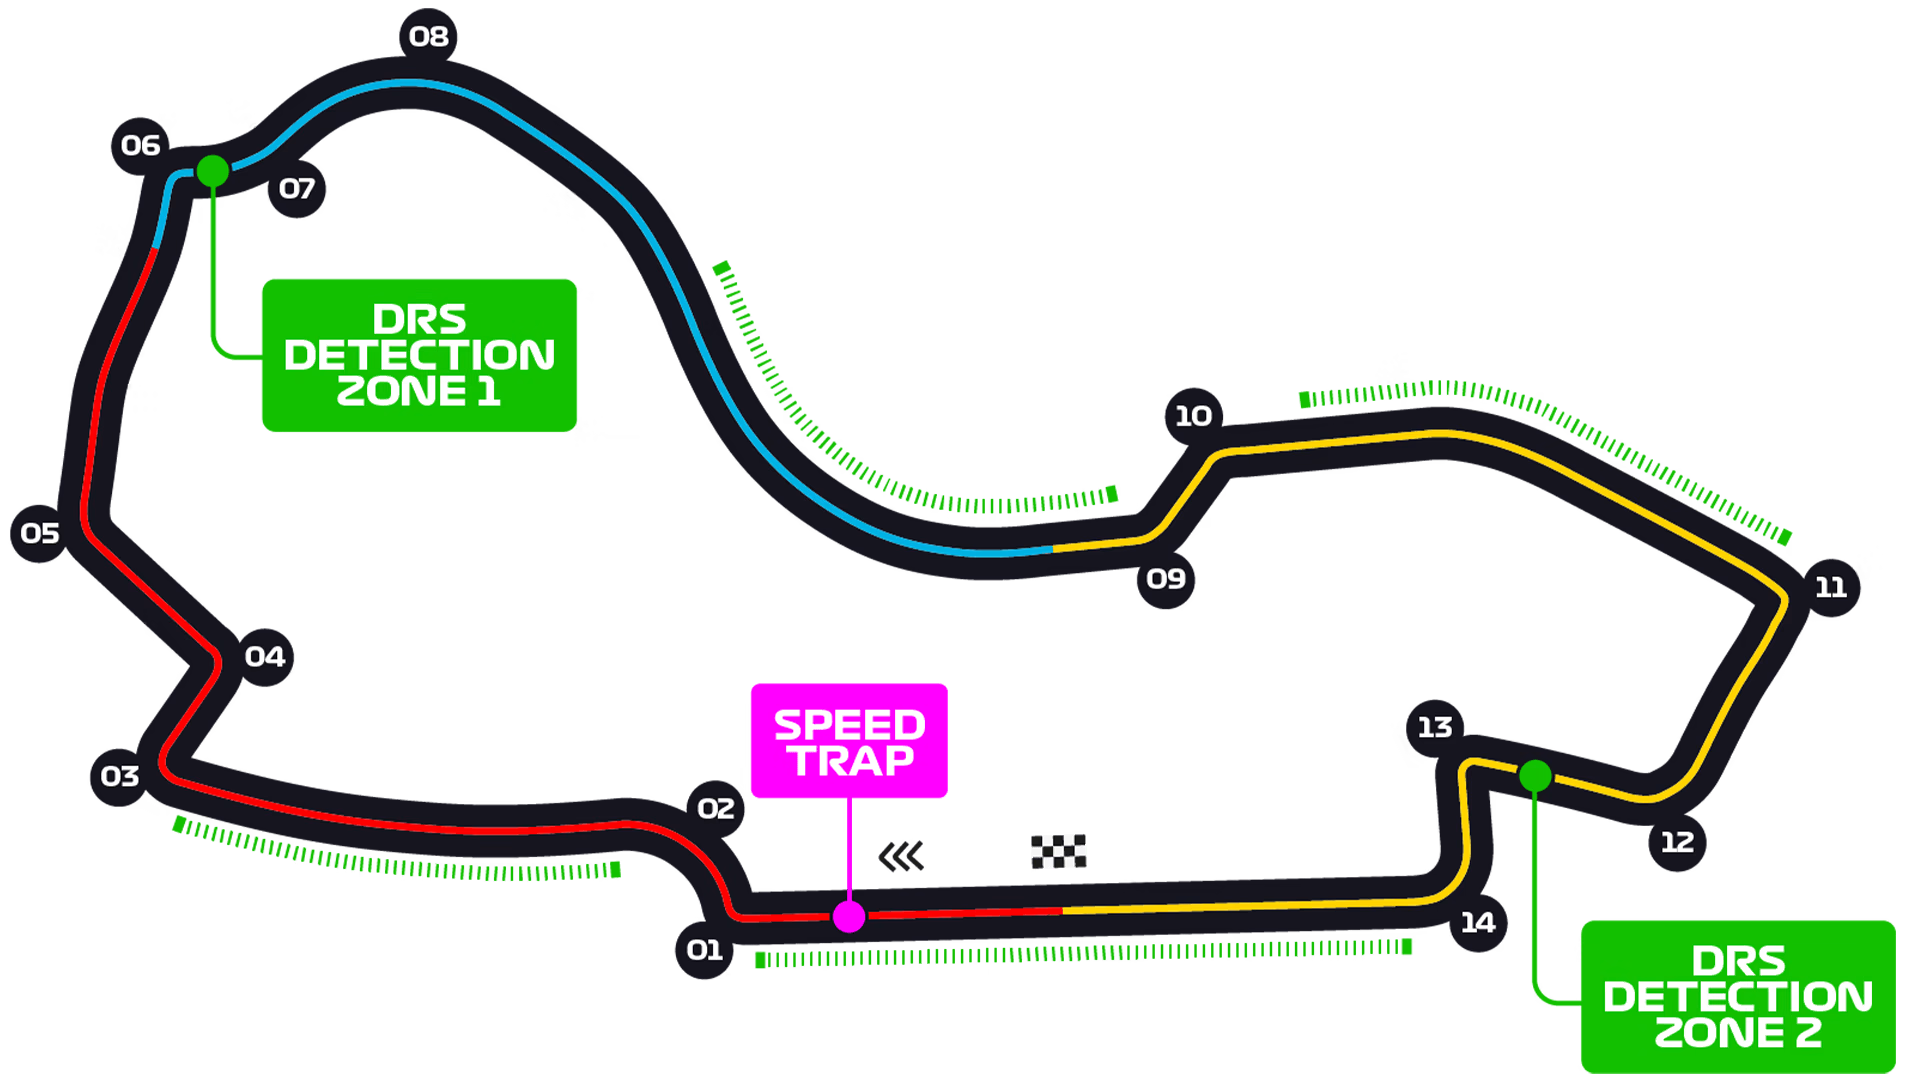
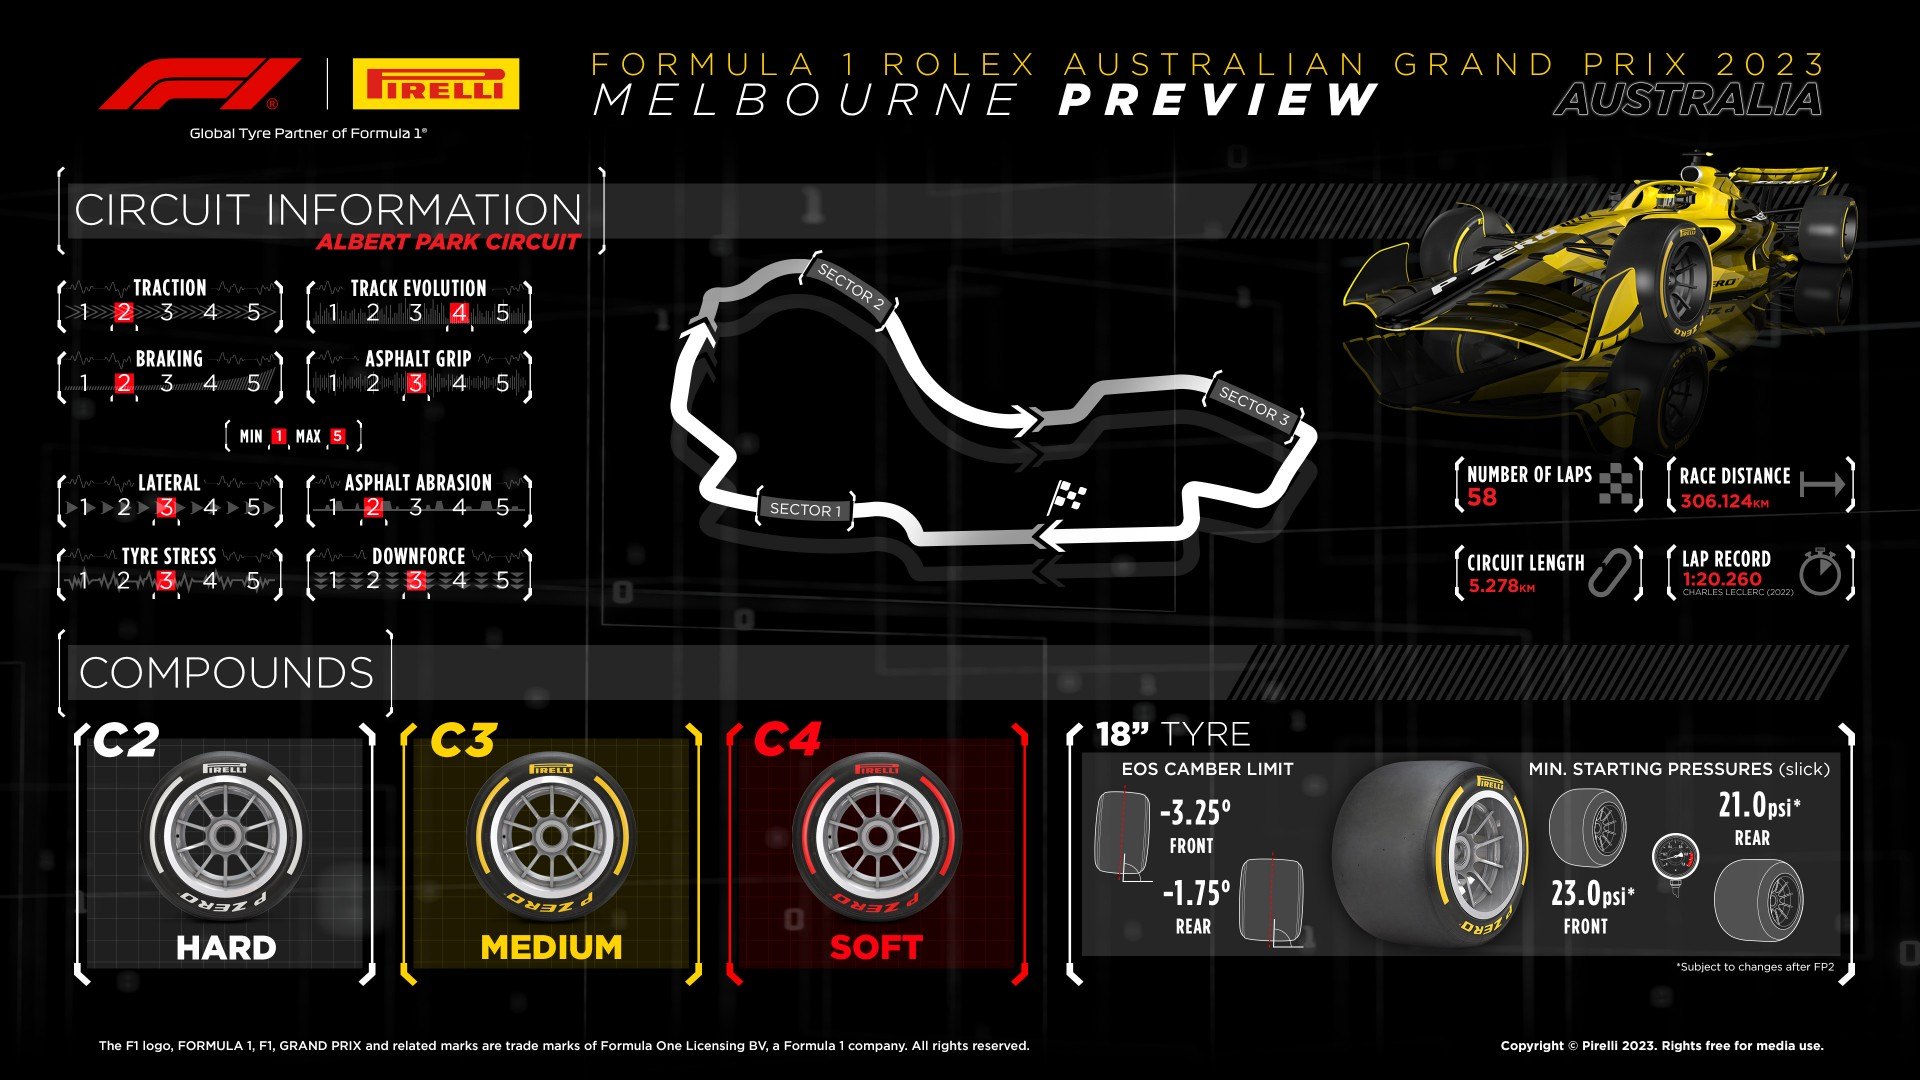
Australia is a 'weird' track, in the sense that is in general not representative to each car's performance. When it was the season-opener, we often waited for the 2nd race to assess each car's performance. The track requires medium downforce levels, and does not stress the tyres too much: consequently, track evolution is high. Lateral performance (cornering) is more important compared to longitudinal perofmrnac (traction and braking). I expect McLaren, in particular, to improve there compared to the much faster Jeddah, which exposed the car's relatively high drag. Ferrari, too, will be able to run a rear wing more in line with the track's characteristics (the wing they run in Jeddah was too draggy for the track)
Thanks again for supporting this project; it means the world to me and allows me to continue dedicating a lot of time to this project to improve constantly and offer you the best content! If you have any questions, please ask, and I will gladly try to answer! And remember to check the Data Repository as well.
Mirco / Formula Data Analysis