

Dear F1 Data Analysts,
We have a new and very young (Sprint) pole sitter! Mercedes had shown great potential in the FP1 long runs, but RUS could not fully express its single-lap performance due to a red flag (same for NOR). ANT showed that the Mercedes engineer successfully tuned its setup to the track while he fully extracted its potential. He was also aided by PIA's mistake in the last corner (as he also admitted): let's take a look at the data to better understand the sessions so far and try to make a prediction!
Track Characteristics
How to read: The track map shows its layout divided into three sectors (S1 in Red, S2 in Blue, and S3 in Yellow). The zones in which the DRS can be used are highlighted in green. In the race, a driver who crosses the DRS Detection Zone within 1s of the preceding driver can use the DRS in all zones up to the next DRS Detection Zone.
Three DRS zones and two long full-throttle sections make this one of the fastest city circuits. Therefore, the track requires having a car that performs well (on average) in the very slow corners of S2 and on the very long straight of S3. Mechanical grip (traction, in particular) and good aerodynamic efficiency are a must; instead, teams can play a bit with the specific level of wing load to use.
Characteristics of each sector:
Sector 1: Tyre-killing sector, with many consecutive high-speed corners. Reducing the pace slightly here will aid with tyre wear significantly, especially at the front (as F1 cars tend to understeer at high speed)
Sector 2: A long, fast section (the 2nd best overtaking spot) followed by some of the narrowest corners of the season. Moderate wear, mostly at the rear due to the traction zones.
Sector 3: A very long straight followed by a slow hairpin and not much else! Minimal tyre wear, while the exit from T16 is crucial for performance. This is the main overtaking spot.

Pirelli has brought one-step softer compounds compared to last year, as they also did in Saudi Arabia: this choice will increase tyre wear a bit, which is still expected to be rather low due to the exceptional durability of the Pirelli tyres and the low-wear nature of a city circuit. As I said previously, the track requires a well-balanced package to be quick: a 3/5 score given to Traction, Braking, and Lateral performance. It's no coincidence that the downforce level used by most teams is average (3/5)

Wing Levels
What it means: Teams can use different rear wings. A more loaded rear wing will produce more downforce at the expense of more drag: the car will have slightly better traction, cornering, and much better braking, but also lower high-speed acceleration and top speed. Generally, it will have less tyre wear, but it will also empty its battery more quickly. A more loaded wing plane is a plane with more camber (more curvature) and a higher angle of attack (the angle of the wing relative to the airflow). The wing load can be increased independently through the lower and upper planes: the DRS only acts on the upper plane, so running a more loaded upper plane and a less loaded lower plane will generally make that car's DRS more effective.
McLaren, Ferrari, and Mercedes reduced their wing load significantly compared to last year. This is especially true for McL and Mercedes: look at how much shallower the lower plane is! Reducing the wing load is in part of choice, but as such it must be enabled by the overall downforce of the car: the fact that McLaren and Mercedes could reduce it so much is a testament to their excellent gains in downforce year-on-year. RBR, instead, seem to have increased the load of its lower plane, as it is now more cambered: they were already one of the teams with the least loaded wing last year, so they had less room for a further reduction. Still, they are now the top team with the most loaded wing, and this opposite trend suggests that their year-on-year downforce gains have been more limited (in fact, RBR was mighty at the start of 2024, and in 2025 they mostly focused on drag reduction)
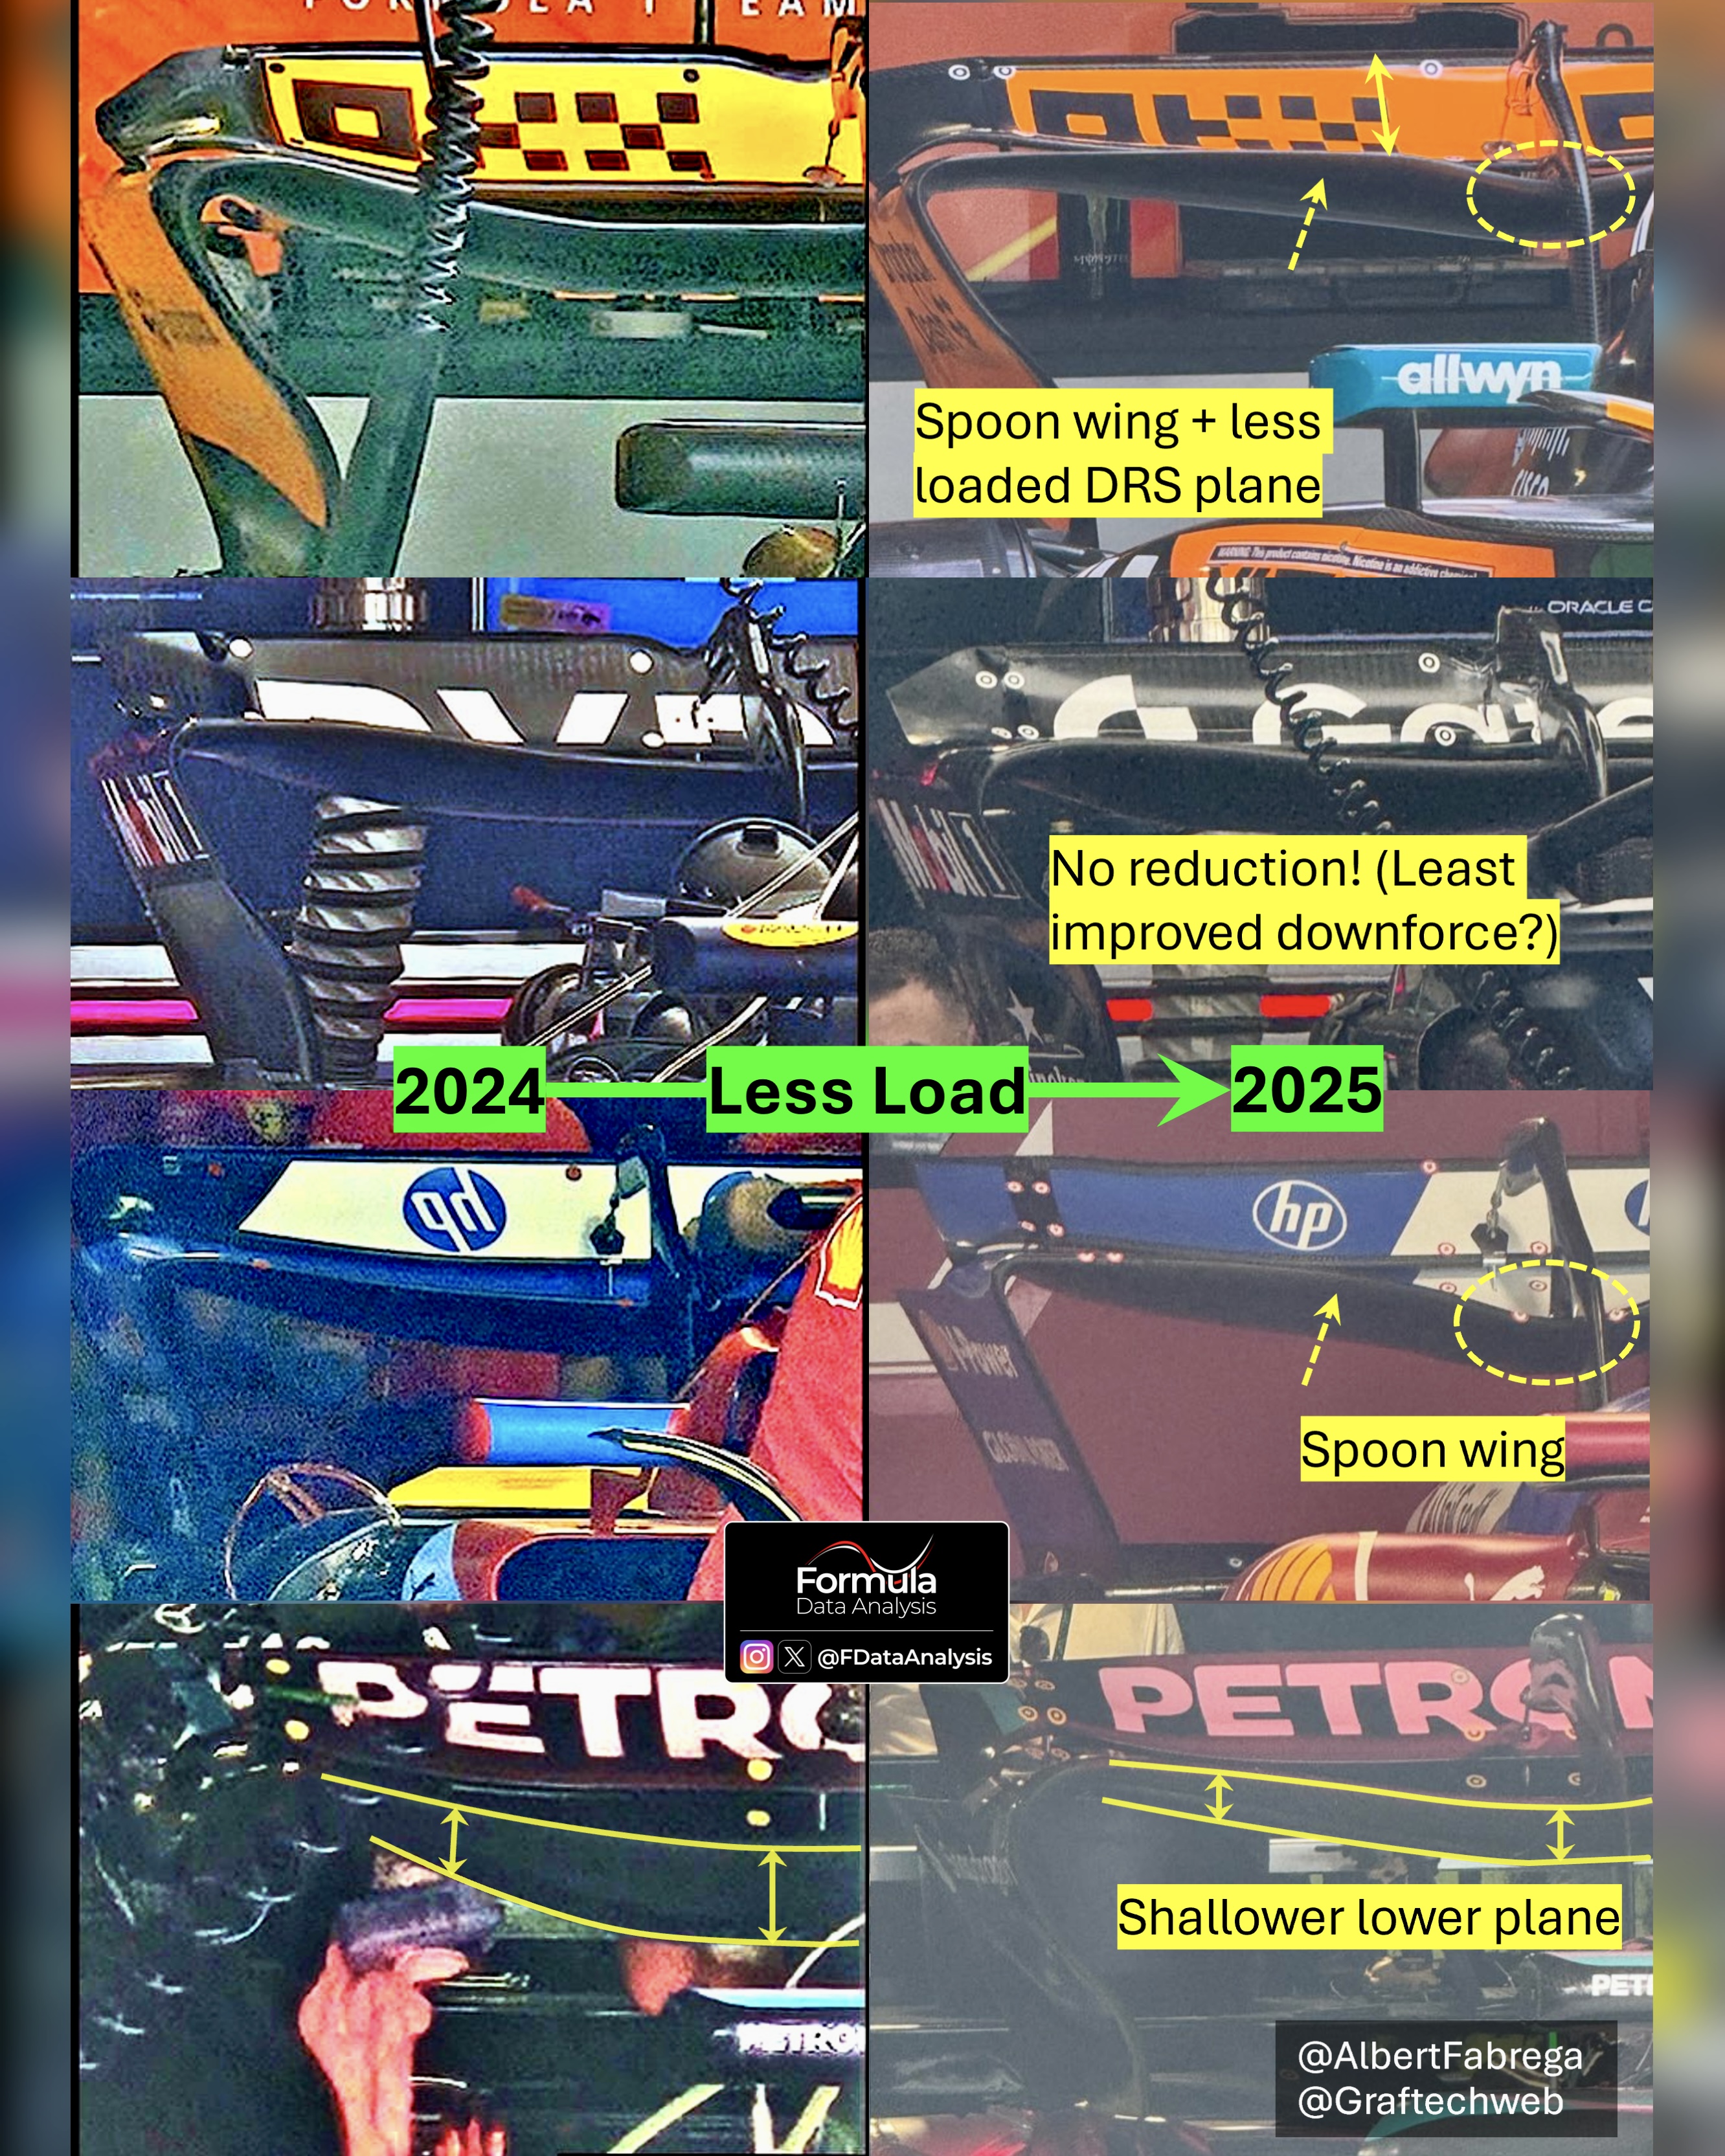
Aston's wing is very loaded, and it should produce very high drag on Miami's long straights! It seemed to work well in SQ, though, as ALO reached SQ3. Minimal load for Alpine and Racing Bulls, but Haas is not that far

Weather Forecasts (by F1)
Sunday will be hotter. Potential risk of rain on Saturday only.
SATURDAY, MAY 3 – SPRINT AND QUALIFYING
Conditions: Partly cloudy. Slight chance of a shower or two during the day. Light easterly wind. Sprint: 27°C // Q: 28°C
Maximum temperature expected: 29 Celsius
Minimum temperature expected: 21 Celsius
Chance of rain: 20%
SUNDAY, MAY 4 – RACE
Conditions: Partly cloudy. Unsettled with a moderate chance of showers in the afternoon. Light easterly wind. Race start: 29°C
Maximum temperature expected: 30 Celsius
Minimum temperature expected: 22 Celsius
Chance of rain: 40%
Single Lap Pace
Best Laptime per Driver
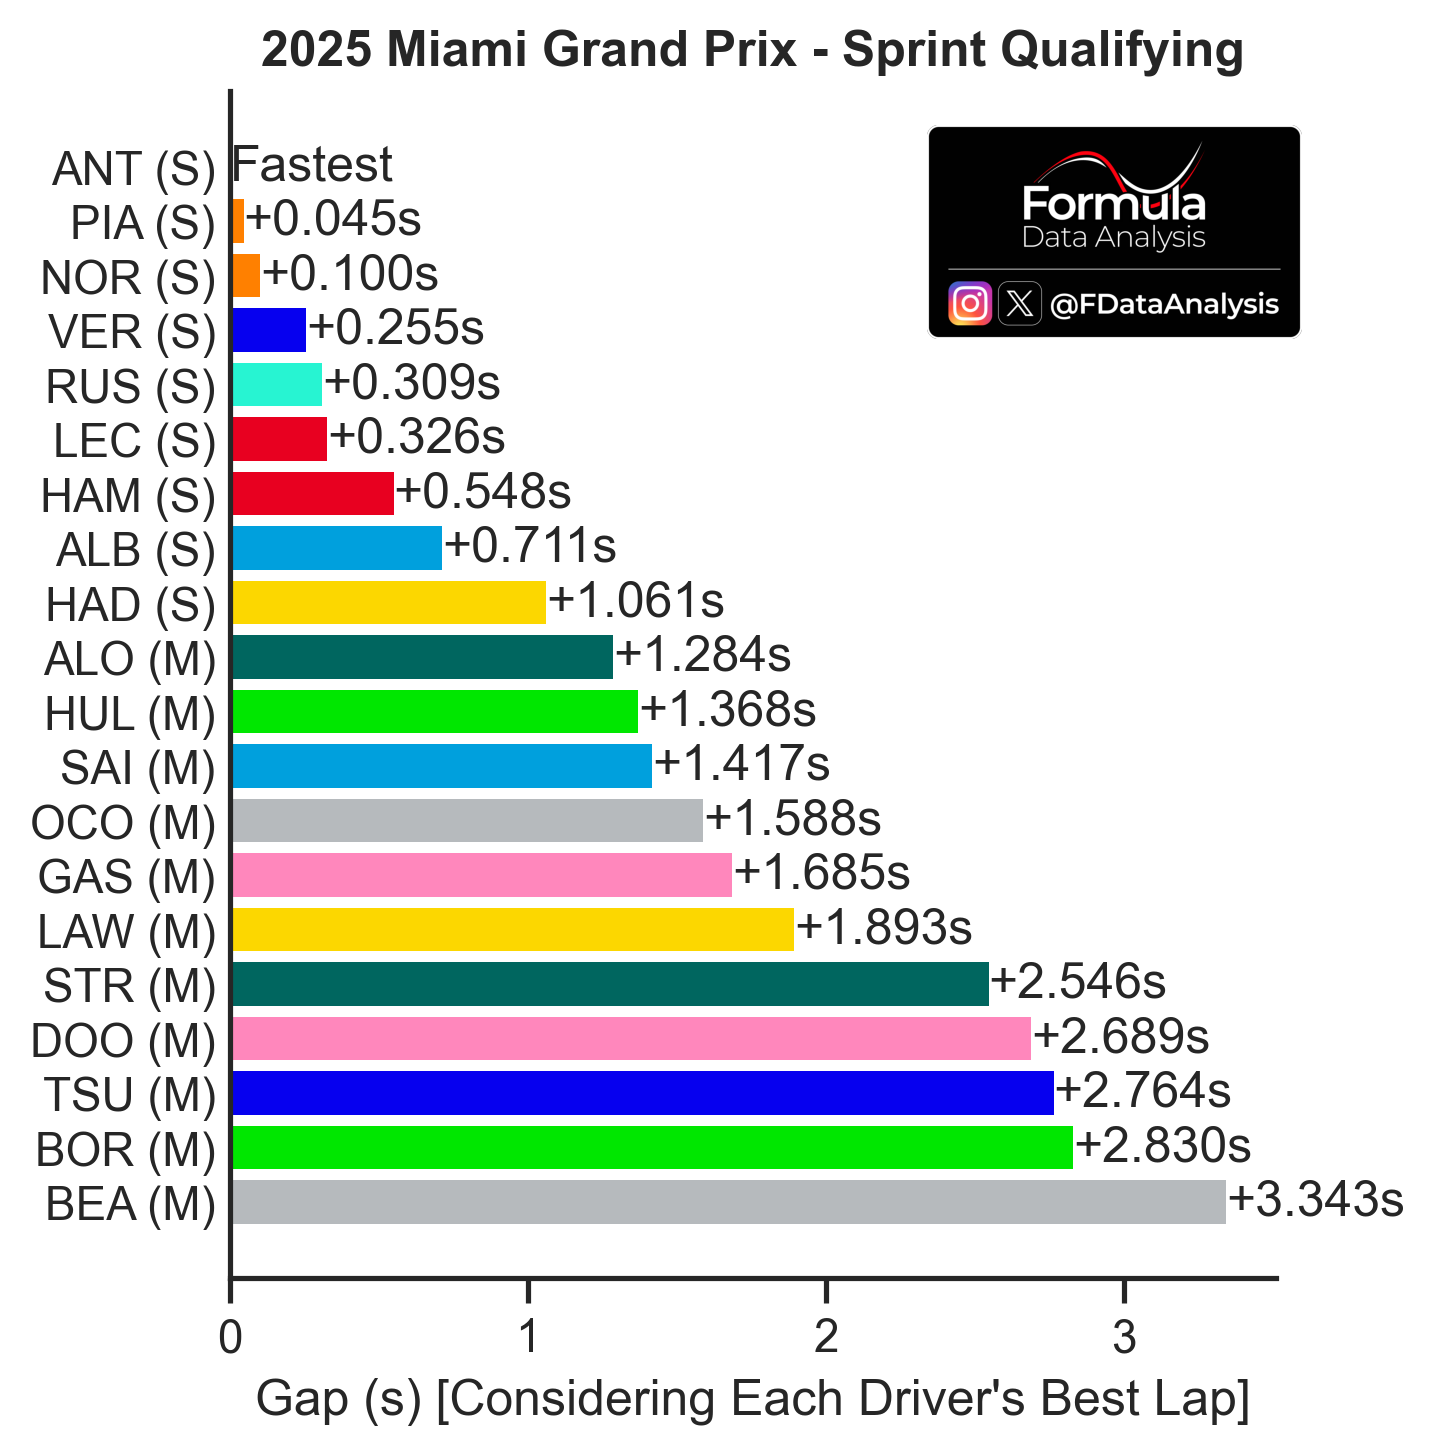
How to read: The graph shows the difference between each driver's fastest lap in the session. The letter to the right of each driver indicates the compound used.
The fight for pole was CLOSE: 3 drivers within one tenth of a second, and 6 in a bit over 3 tenths!
ANT got pole by less than half a tenth, preceding both McL drivers. PIA made a mistake in the last corner, losing a bit over one tenth, which cost him the pole; still, he was quicker than NOR. VER, RUS, and LEC fought for P4. This time, HAM qualified right behind his teammate, but his gap (over 2 tenths) was still significant. ALB, HAD (another very strong showing), and ALO complete the top 10. No matter the driver, the second RBR car seems destined to struggle: TSU only has 2 drivers behind him.
Aero Map
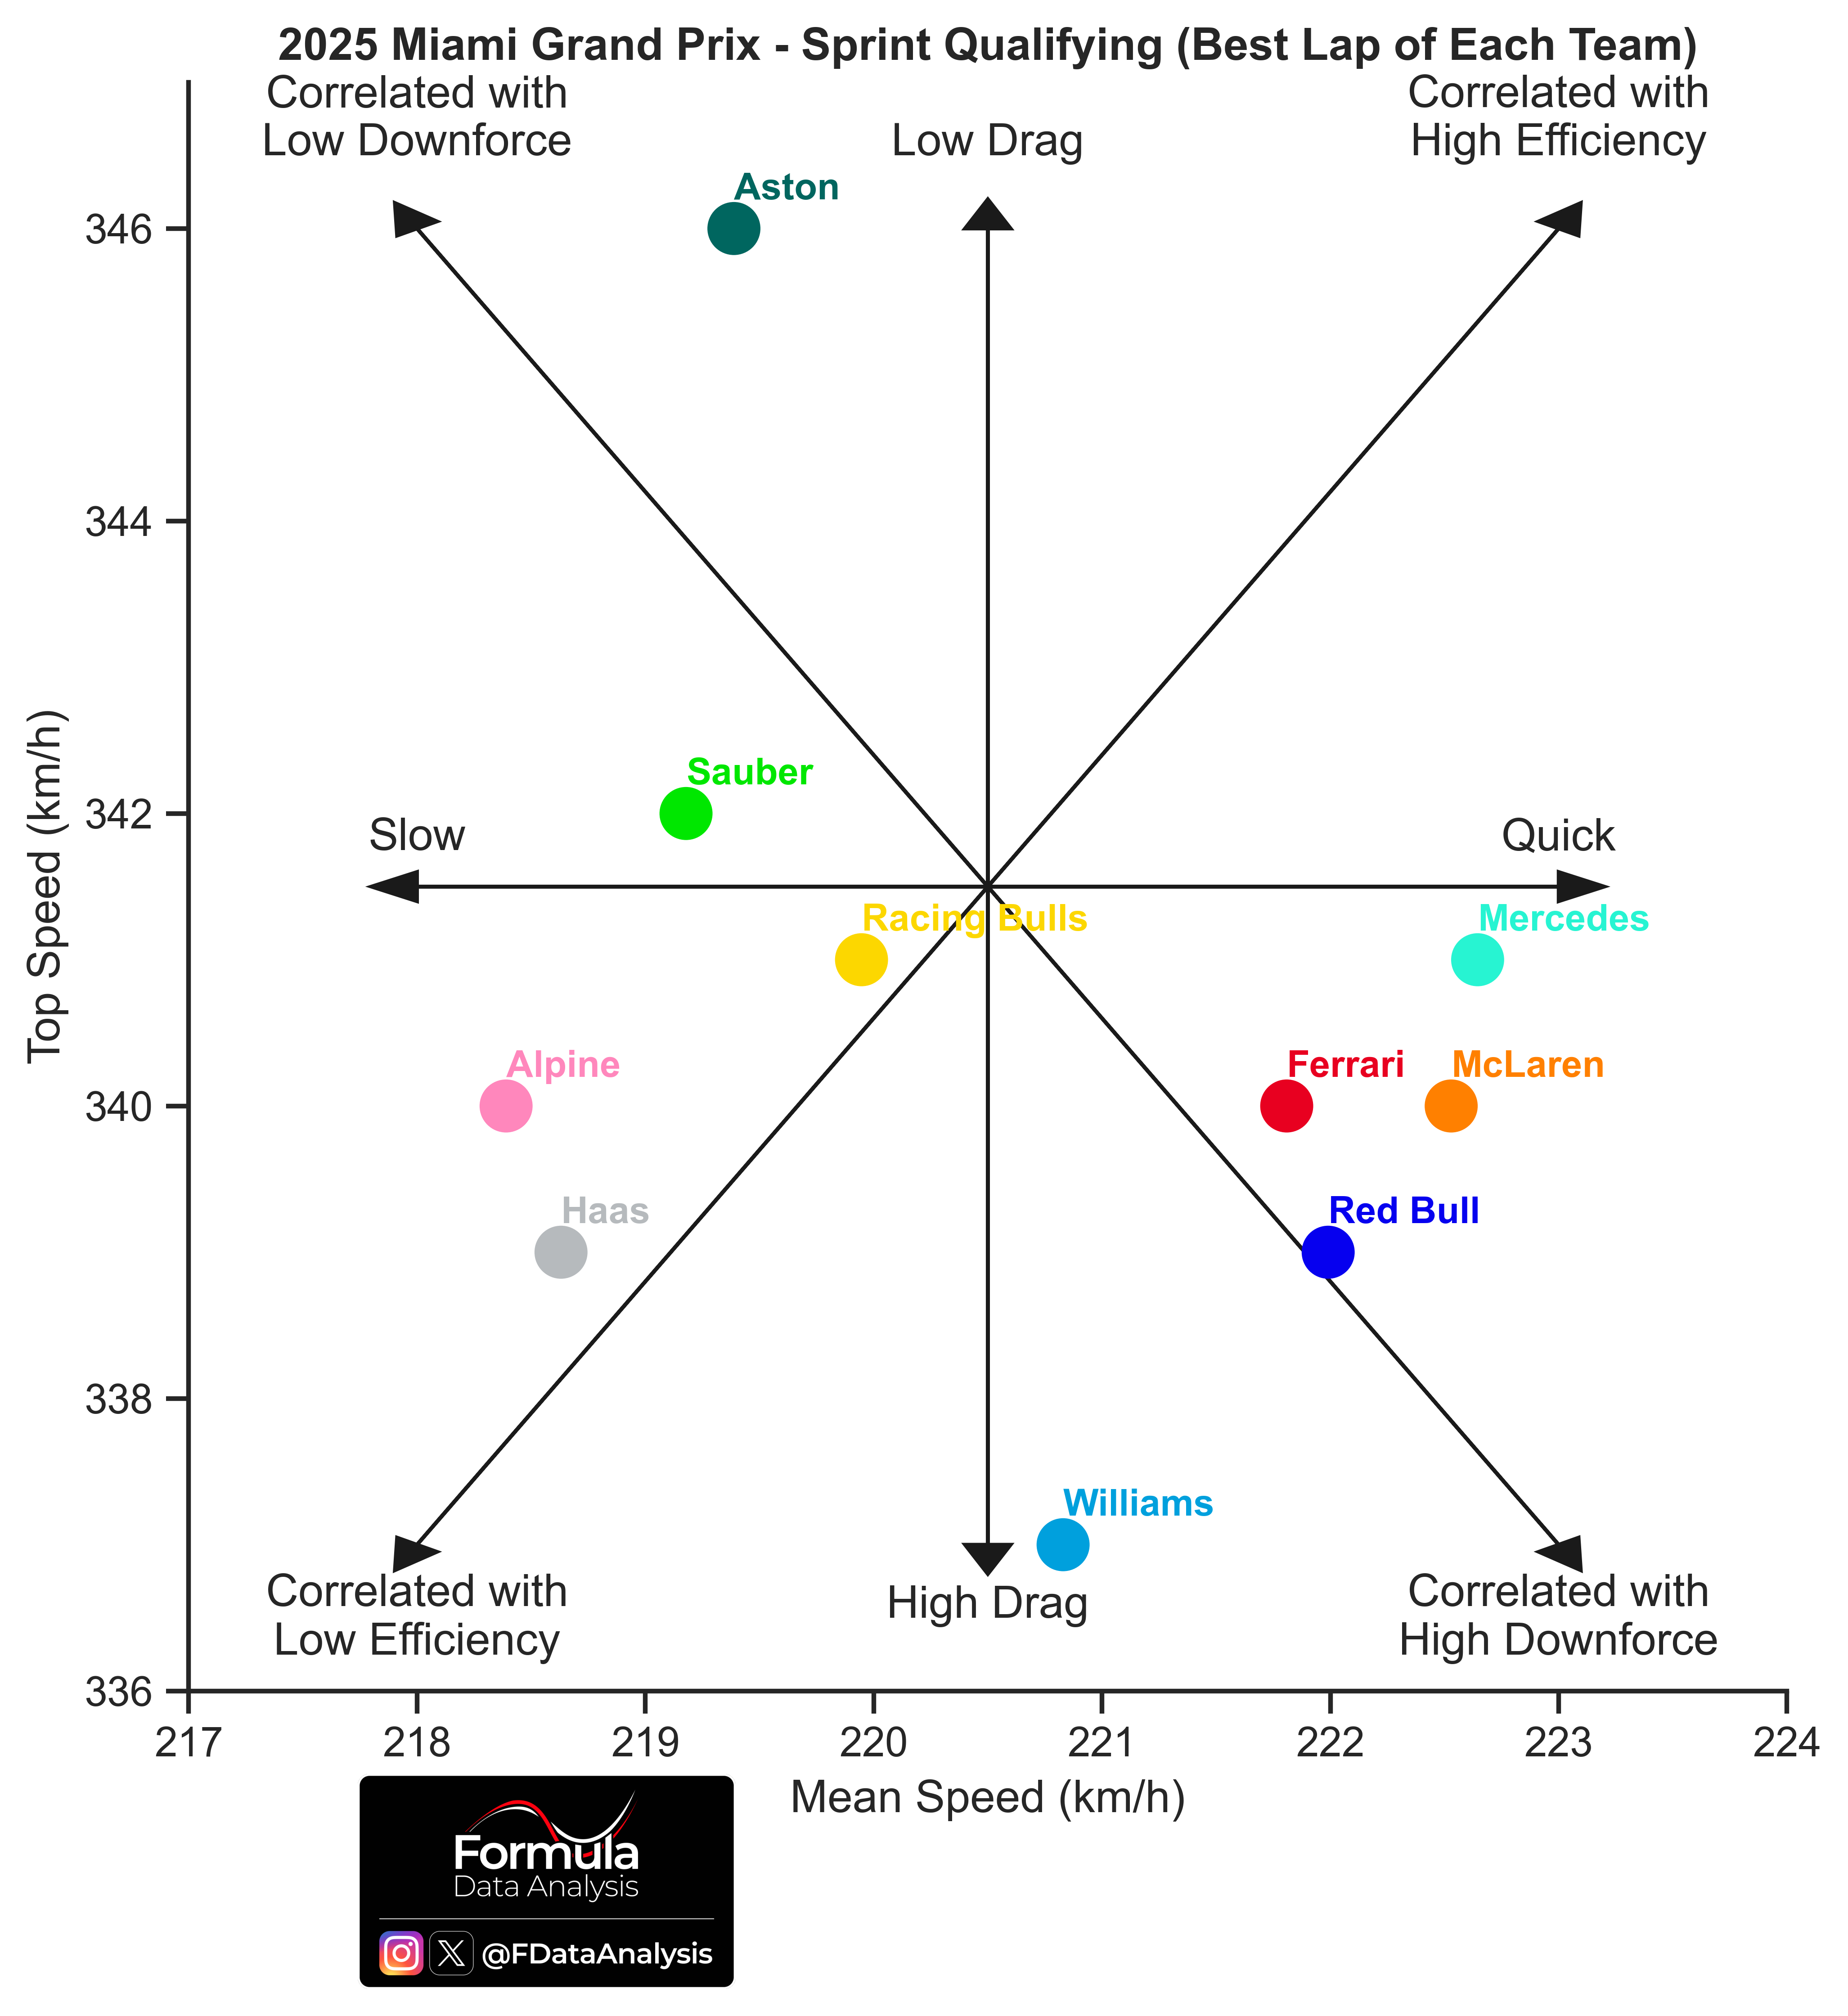
How to read: Average speed on the horizontal axis: the further to the right a team is, the better its performance (the lower the lap time). Top speed on the vertical axis: the higher a team is, the lower that car's drag or the higher that team's engine mode. Therefore, this plot not only shows who was the fastest (those on the right) but also why! (due to very low drag, if they are in the upper portion, or despite that, if they are in the lower portion).
McL eliminated their drag deficit thanks to their less loaded rear wing, but they lost part of their downforce advantage in the process: Mercedes, McL, Ferrari, and RBR behaved very similarly. It's unusual to see RBR have a lower top speed than McL, but it's justified by the different rear wing chosen.
Aston's top speed was boosted by ALO's tow on his best attempt. Williams seem to produce the highest drag around here, yet their performance was good thanks to solid downforce
Top Speeds
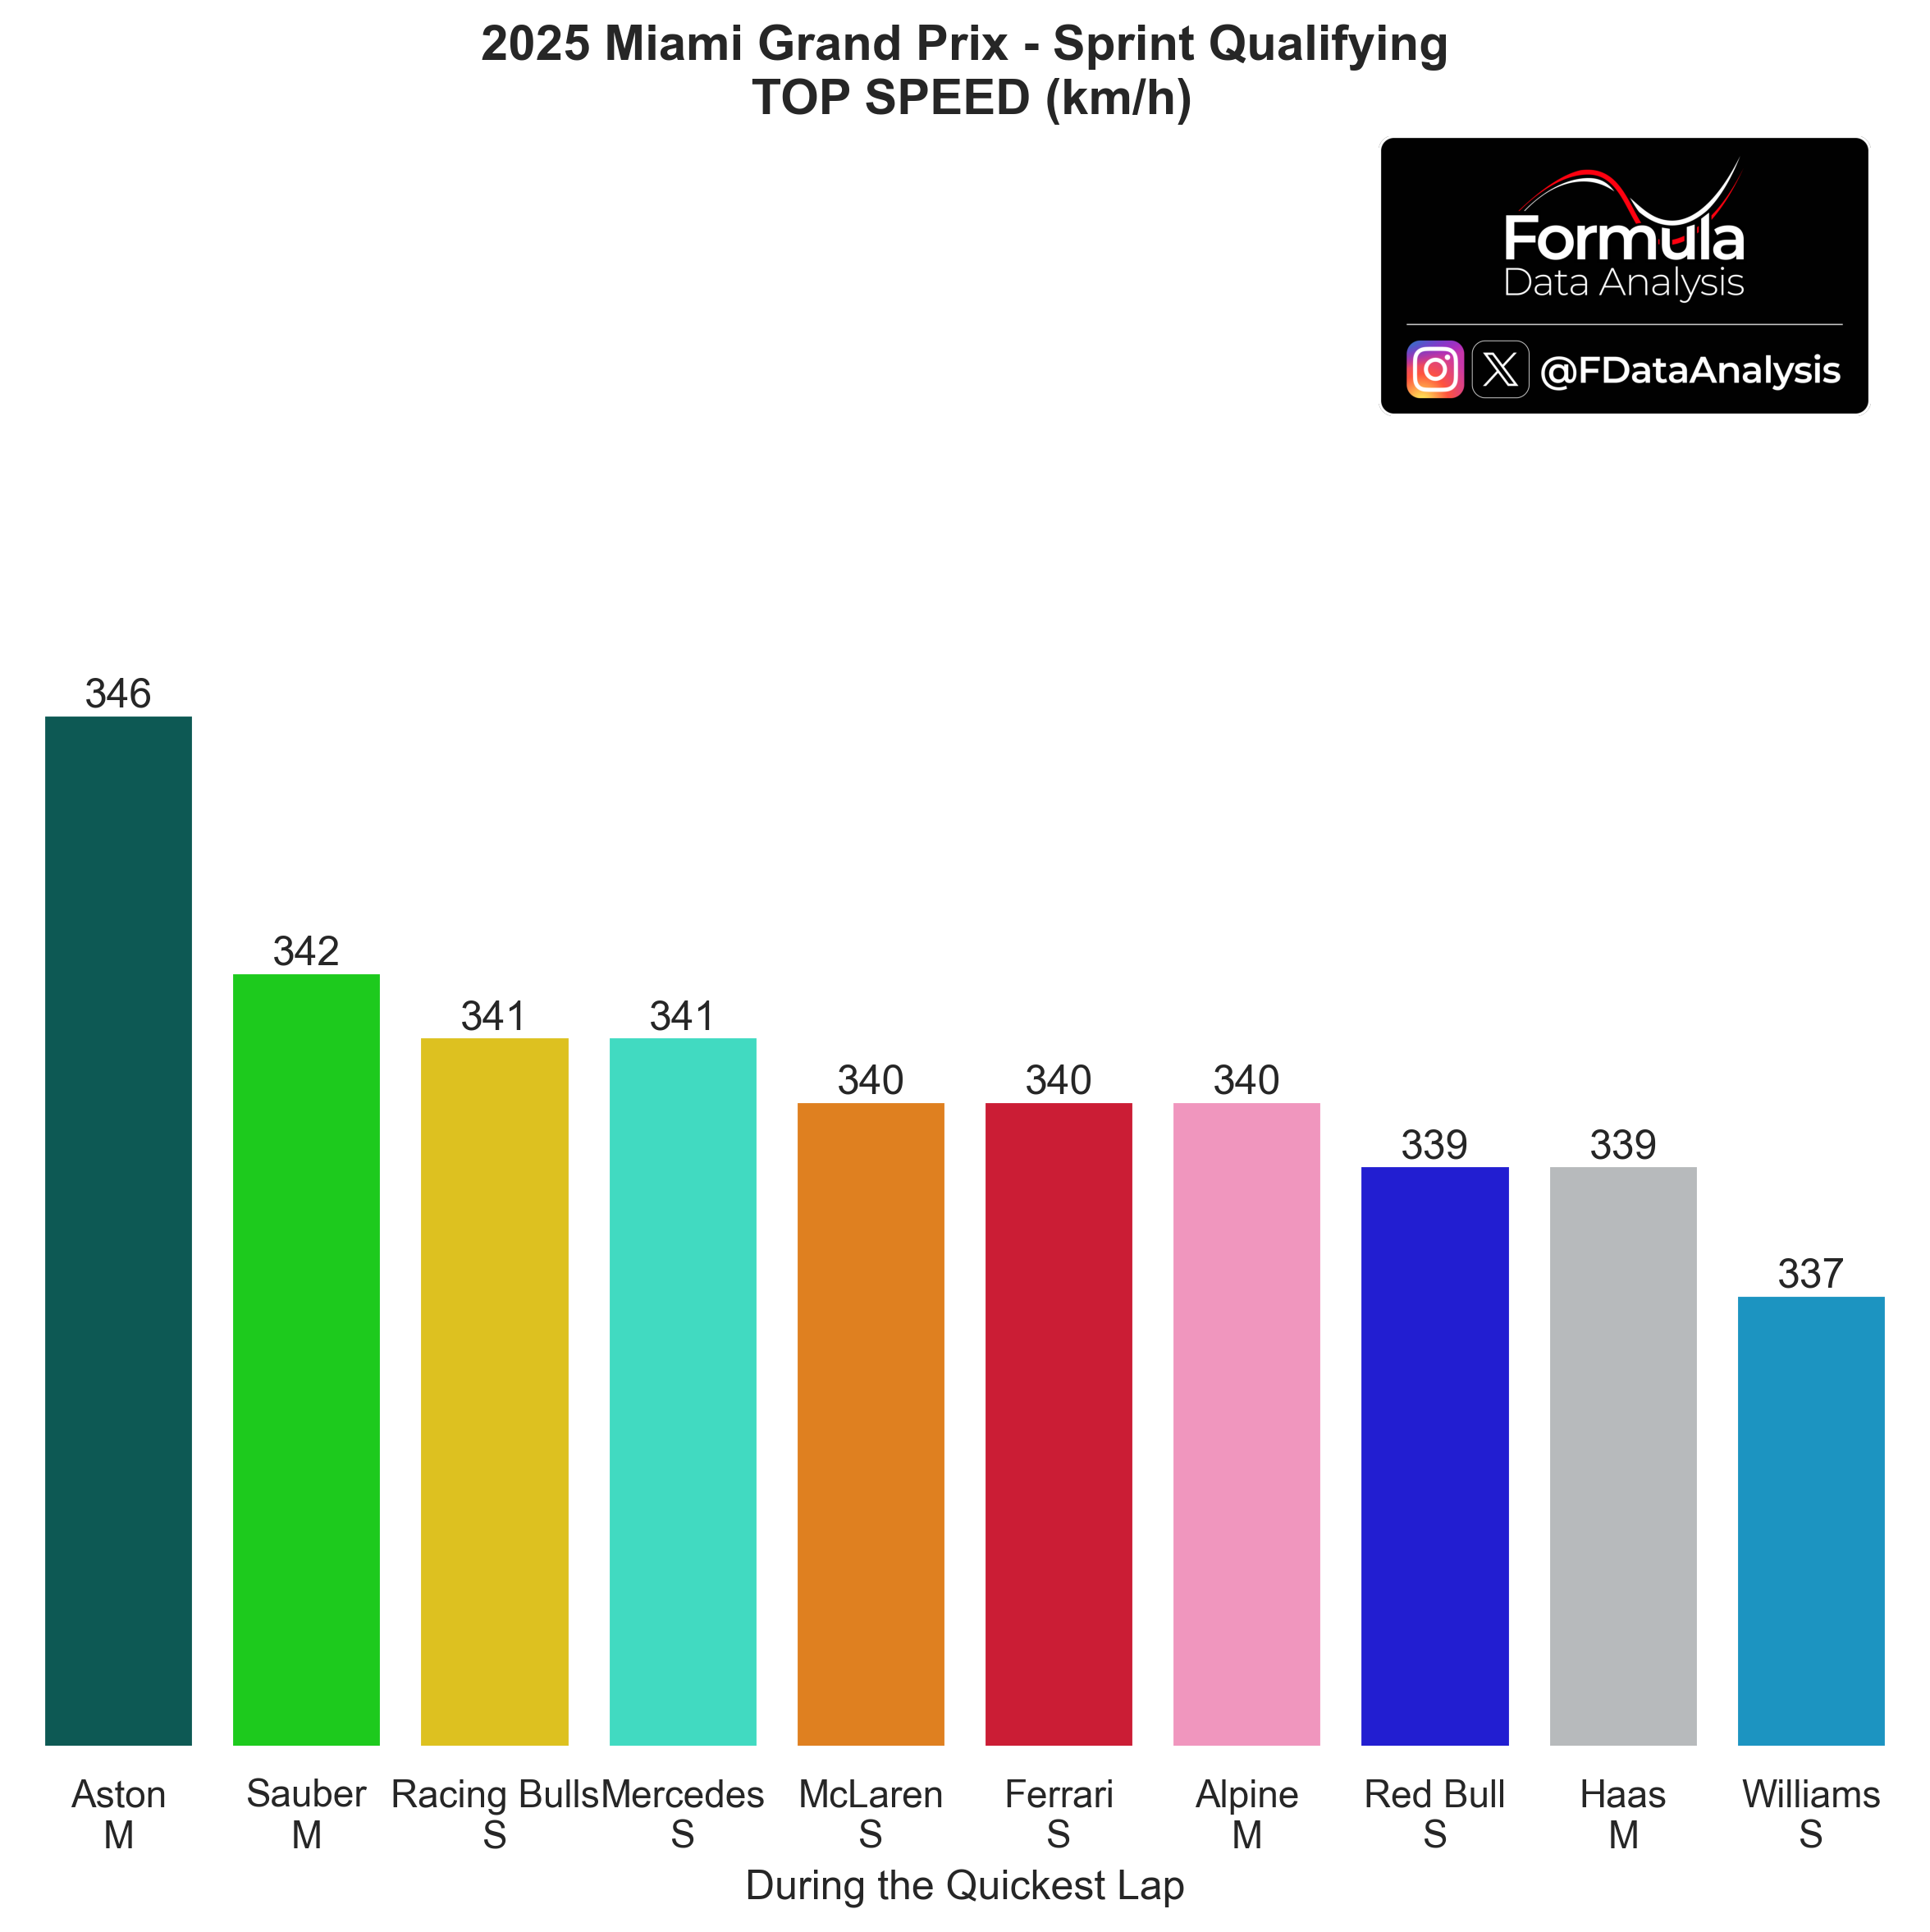
How to read: The higher a team's top speed, the lower that car's drag or the higher that team's engine mode.
Teams are sorted by descending top speed. Once again, disregard Aston's figure: the 'real' value was 341km/h, as I will show later. The 4 top teams were in a narrow 2km/h top speed band!
Same chart, per driver:
ALO's tow was worth 5km/h. SAI and ALB seem to have 2 different setups (more loaded for ALB). As usual, Sauber produced the least drag on average (which helped HUL finish P11!)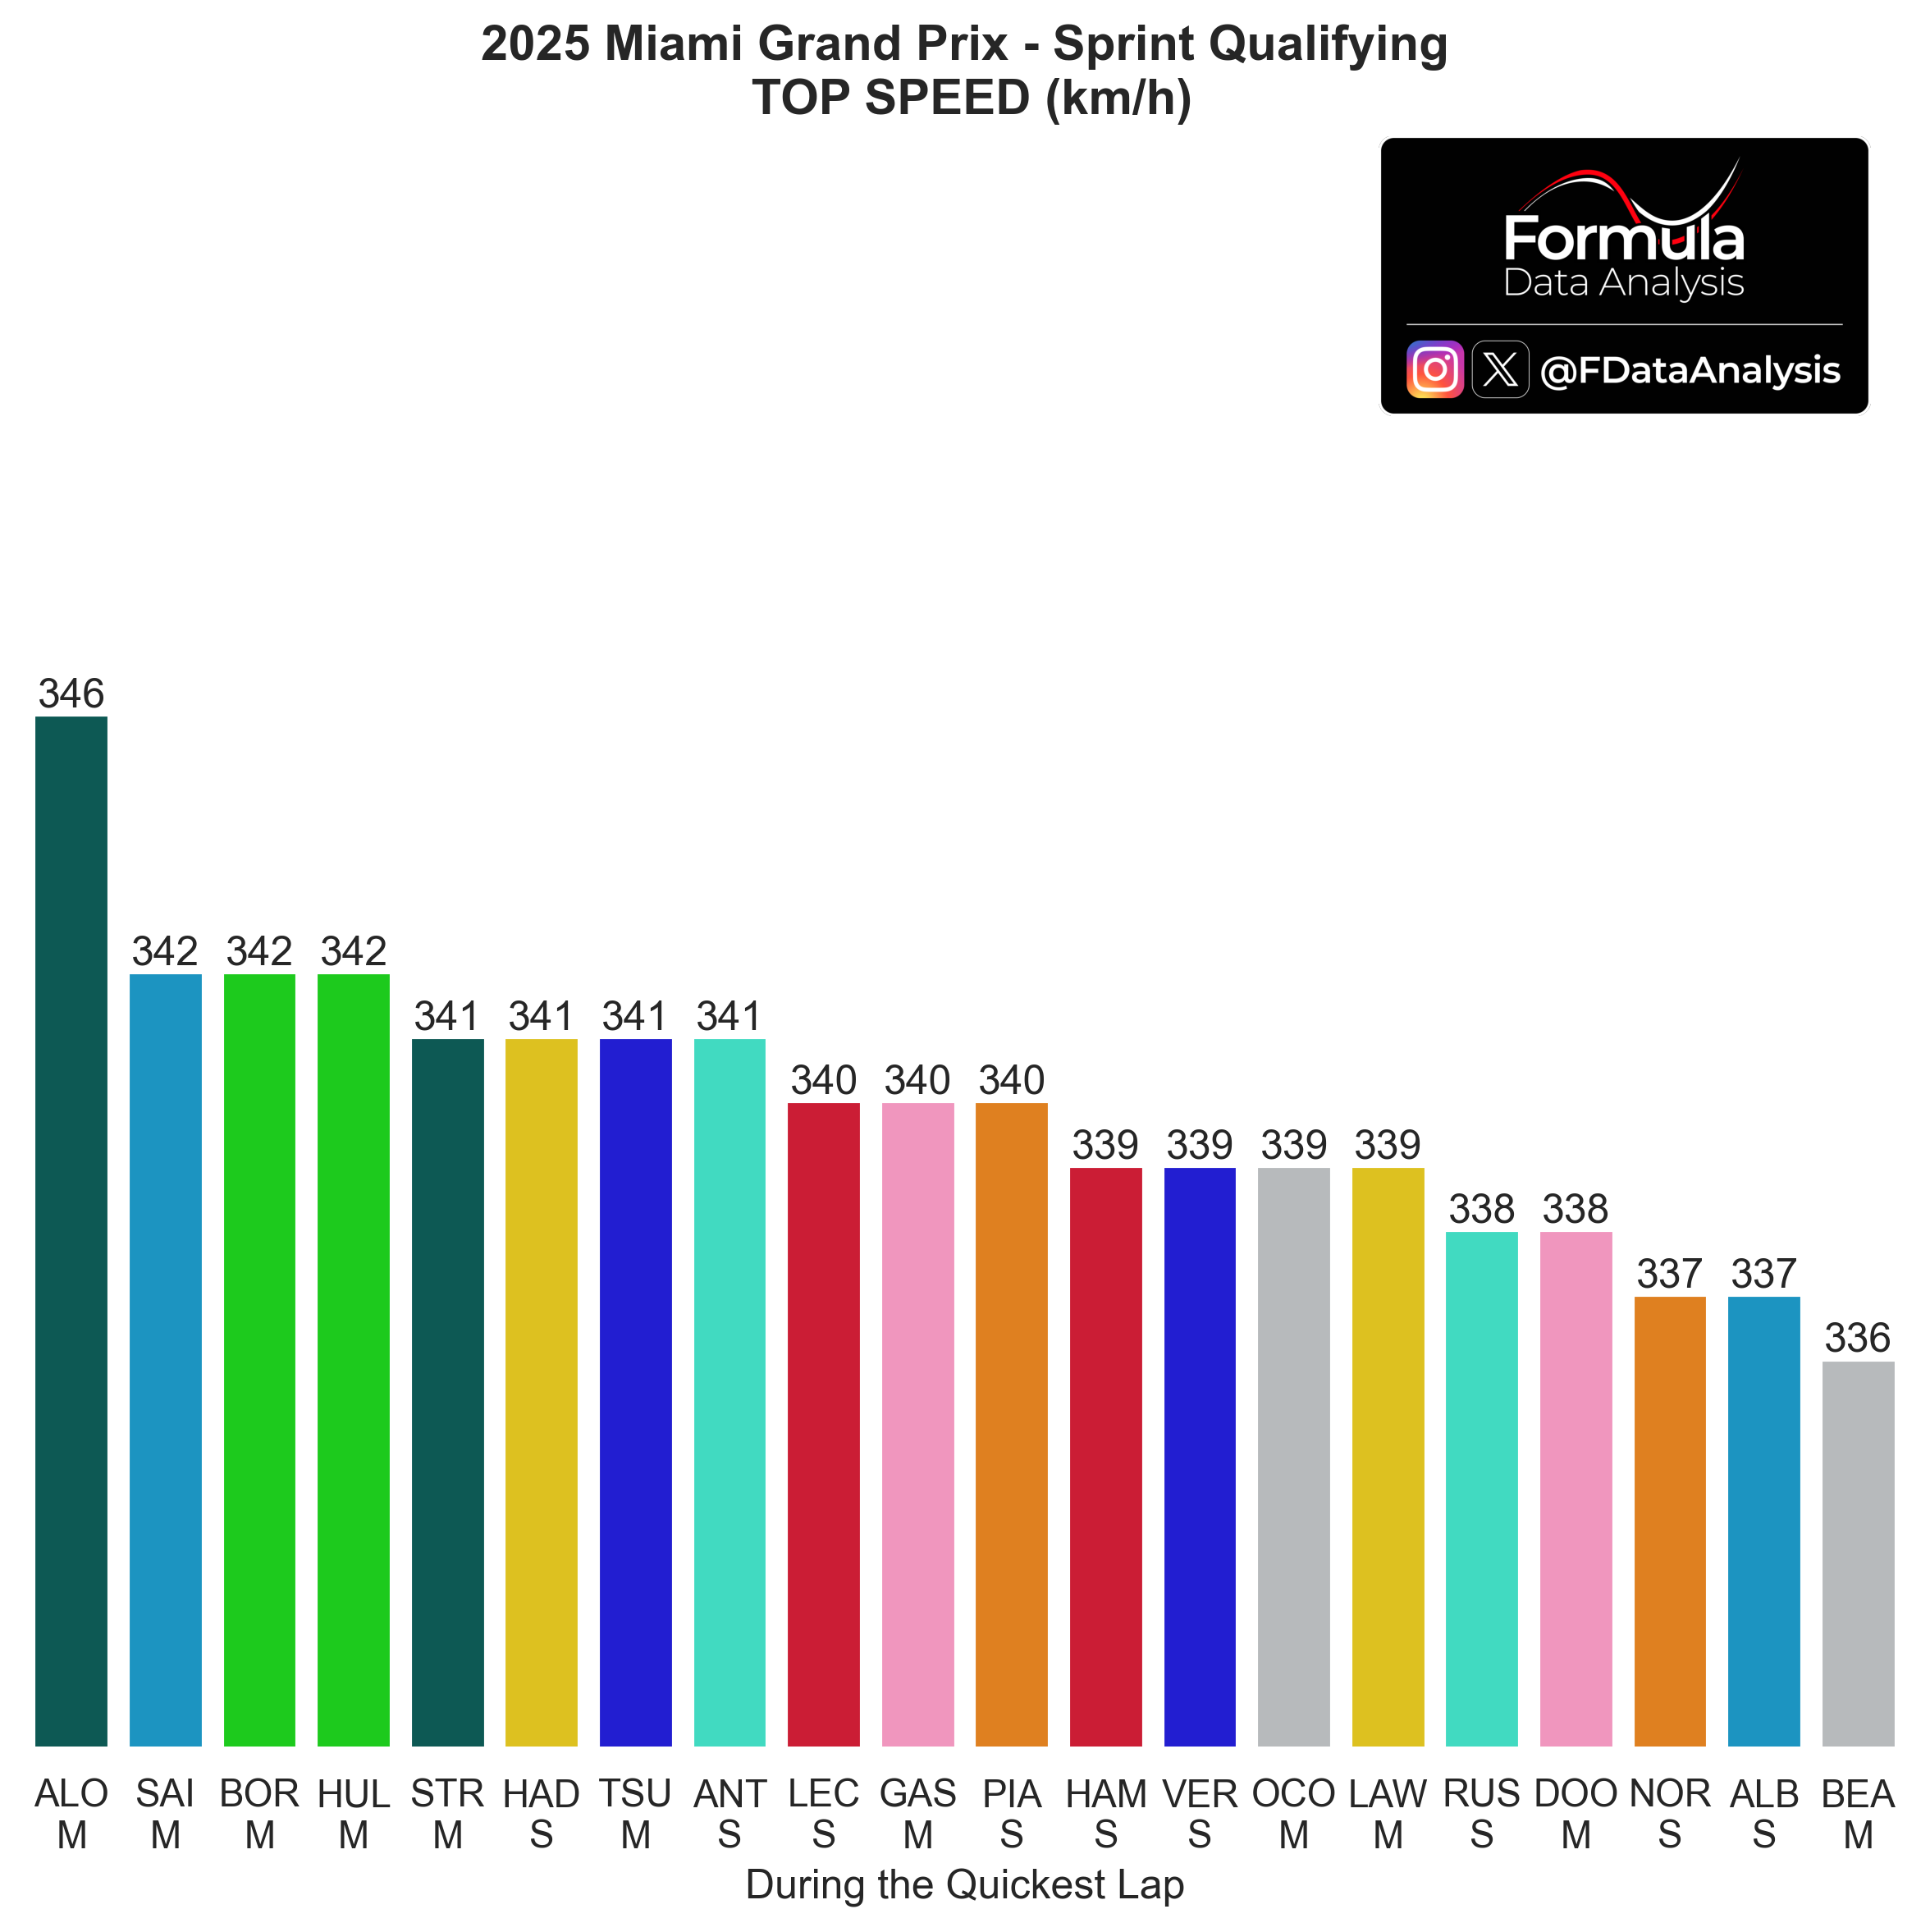
Best Sectors
A summary to remind you of the properties of each one:
Sector 1: Tyre-killing sector, with many consecutive high-speed corners. Reducing the pace slightly here will aid with tyre wear significantly, especially at the front (as F1 cars tend to understeer at high speed)
Sector 2: A long, fast section (the 2nd best overtaking spot) followed by some of the narrowest corners of the season. Moderate wear, mostly at the rear due to the traction zones.
Sector 3: A very long straight followed by a slow hairpin and not much else! Minimal tyre wear, while the exit from T16 is crucial for performance. This is the main overtaking spot.
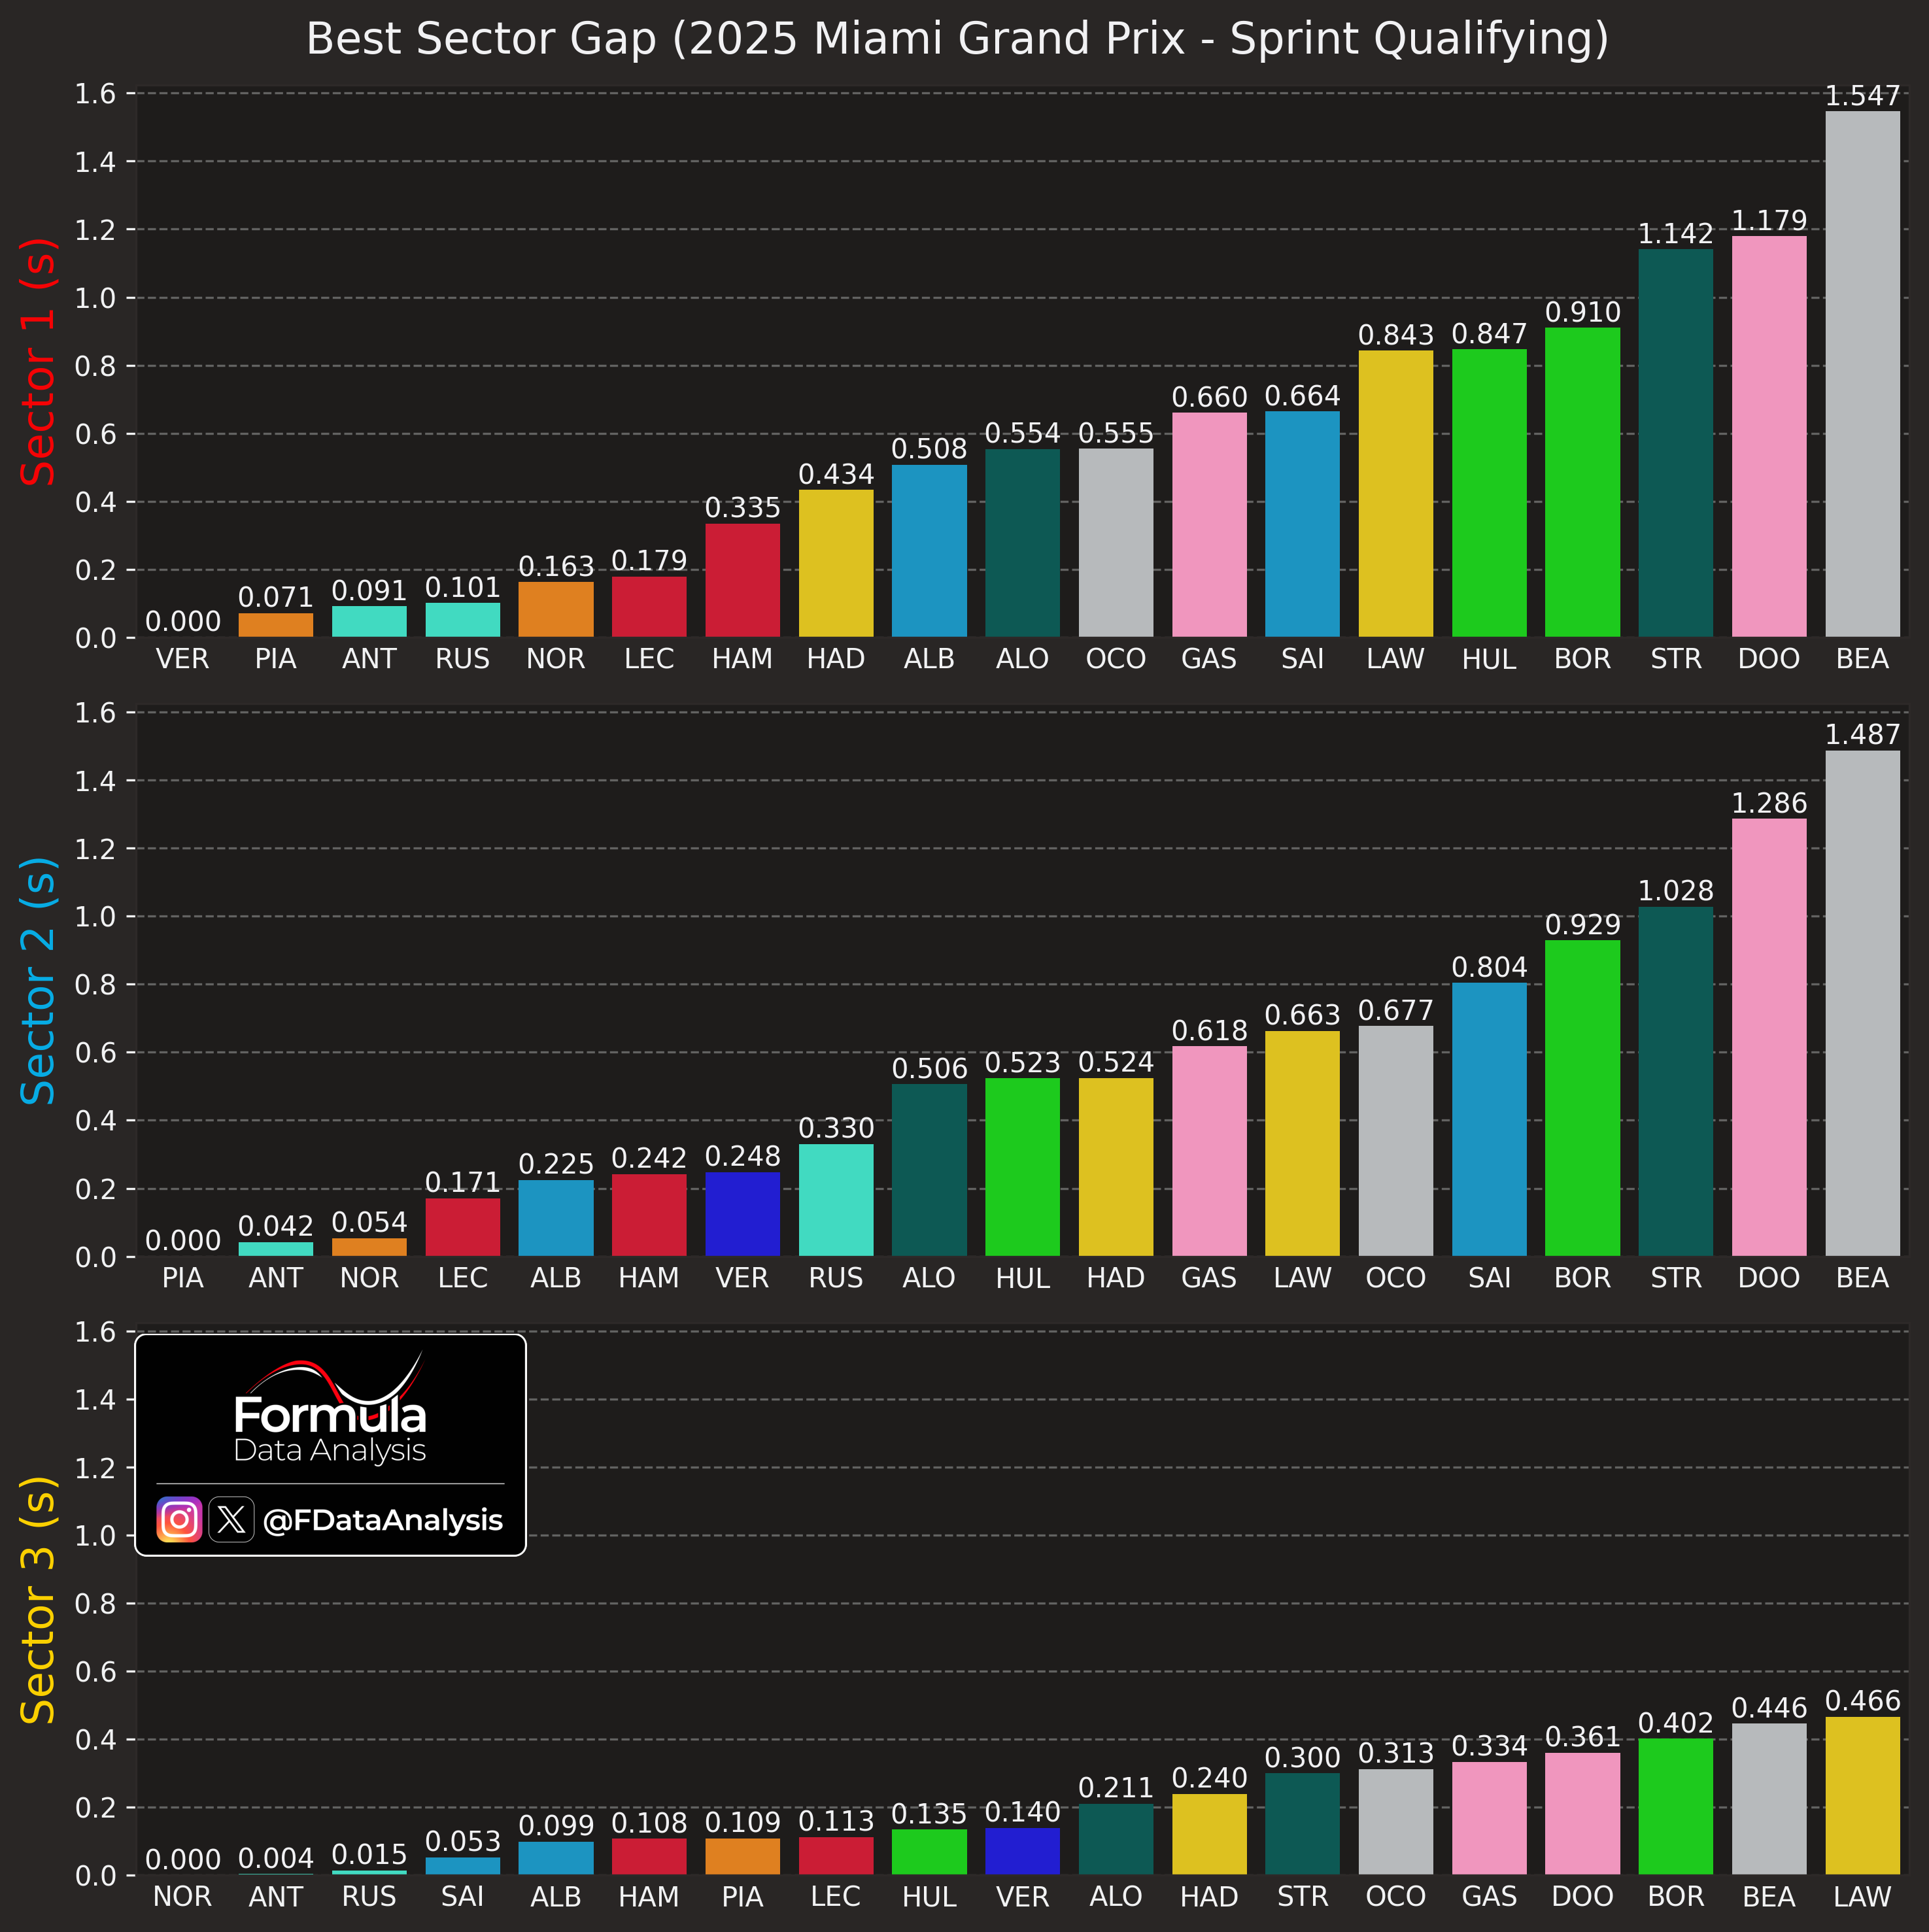
VER was quickest in S1, PIA in S2, and NOR in S3. The fact that NOR was quickest in the third sector despite having the 3rd lowest top speed tells a lot about his car's traction, braking, and cornering performance! (to make up for the time lost on the main straight in just a few corners)
The pole-sitter wasn't quickest in any sector, but competitive in all of them: he was less than one tenth slower than the best driver in each of the three sectors. VER struggled in S2 and S3; NOR in S1, PIA in S3. Ferrari's performance was unimpressive in all sectors. Gaps in S3 were minimal, as the sector mostly consists of a single straight.
Best vs Ideal Lap
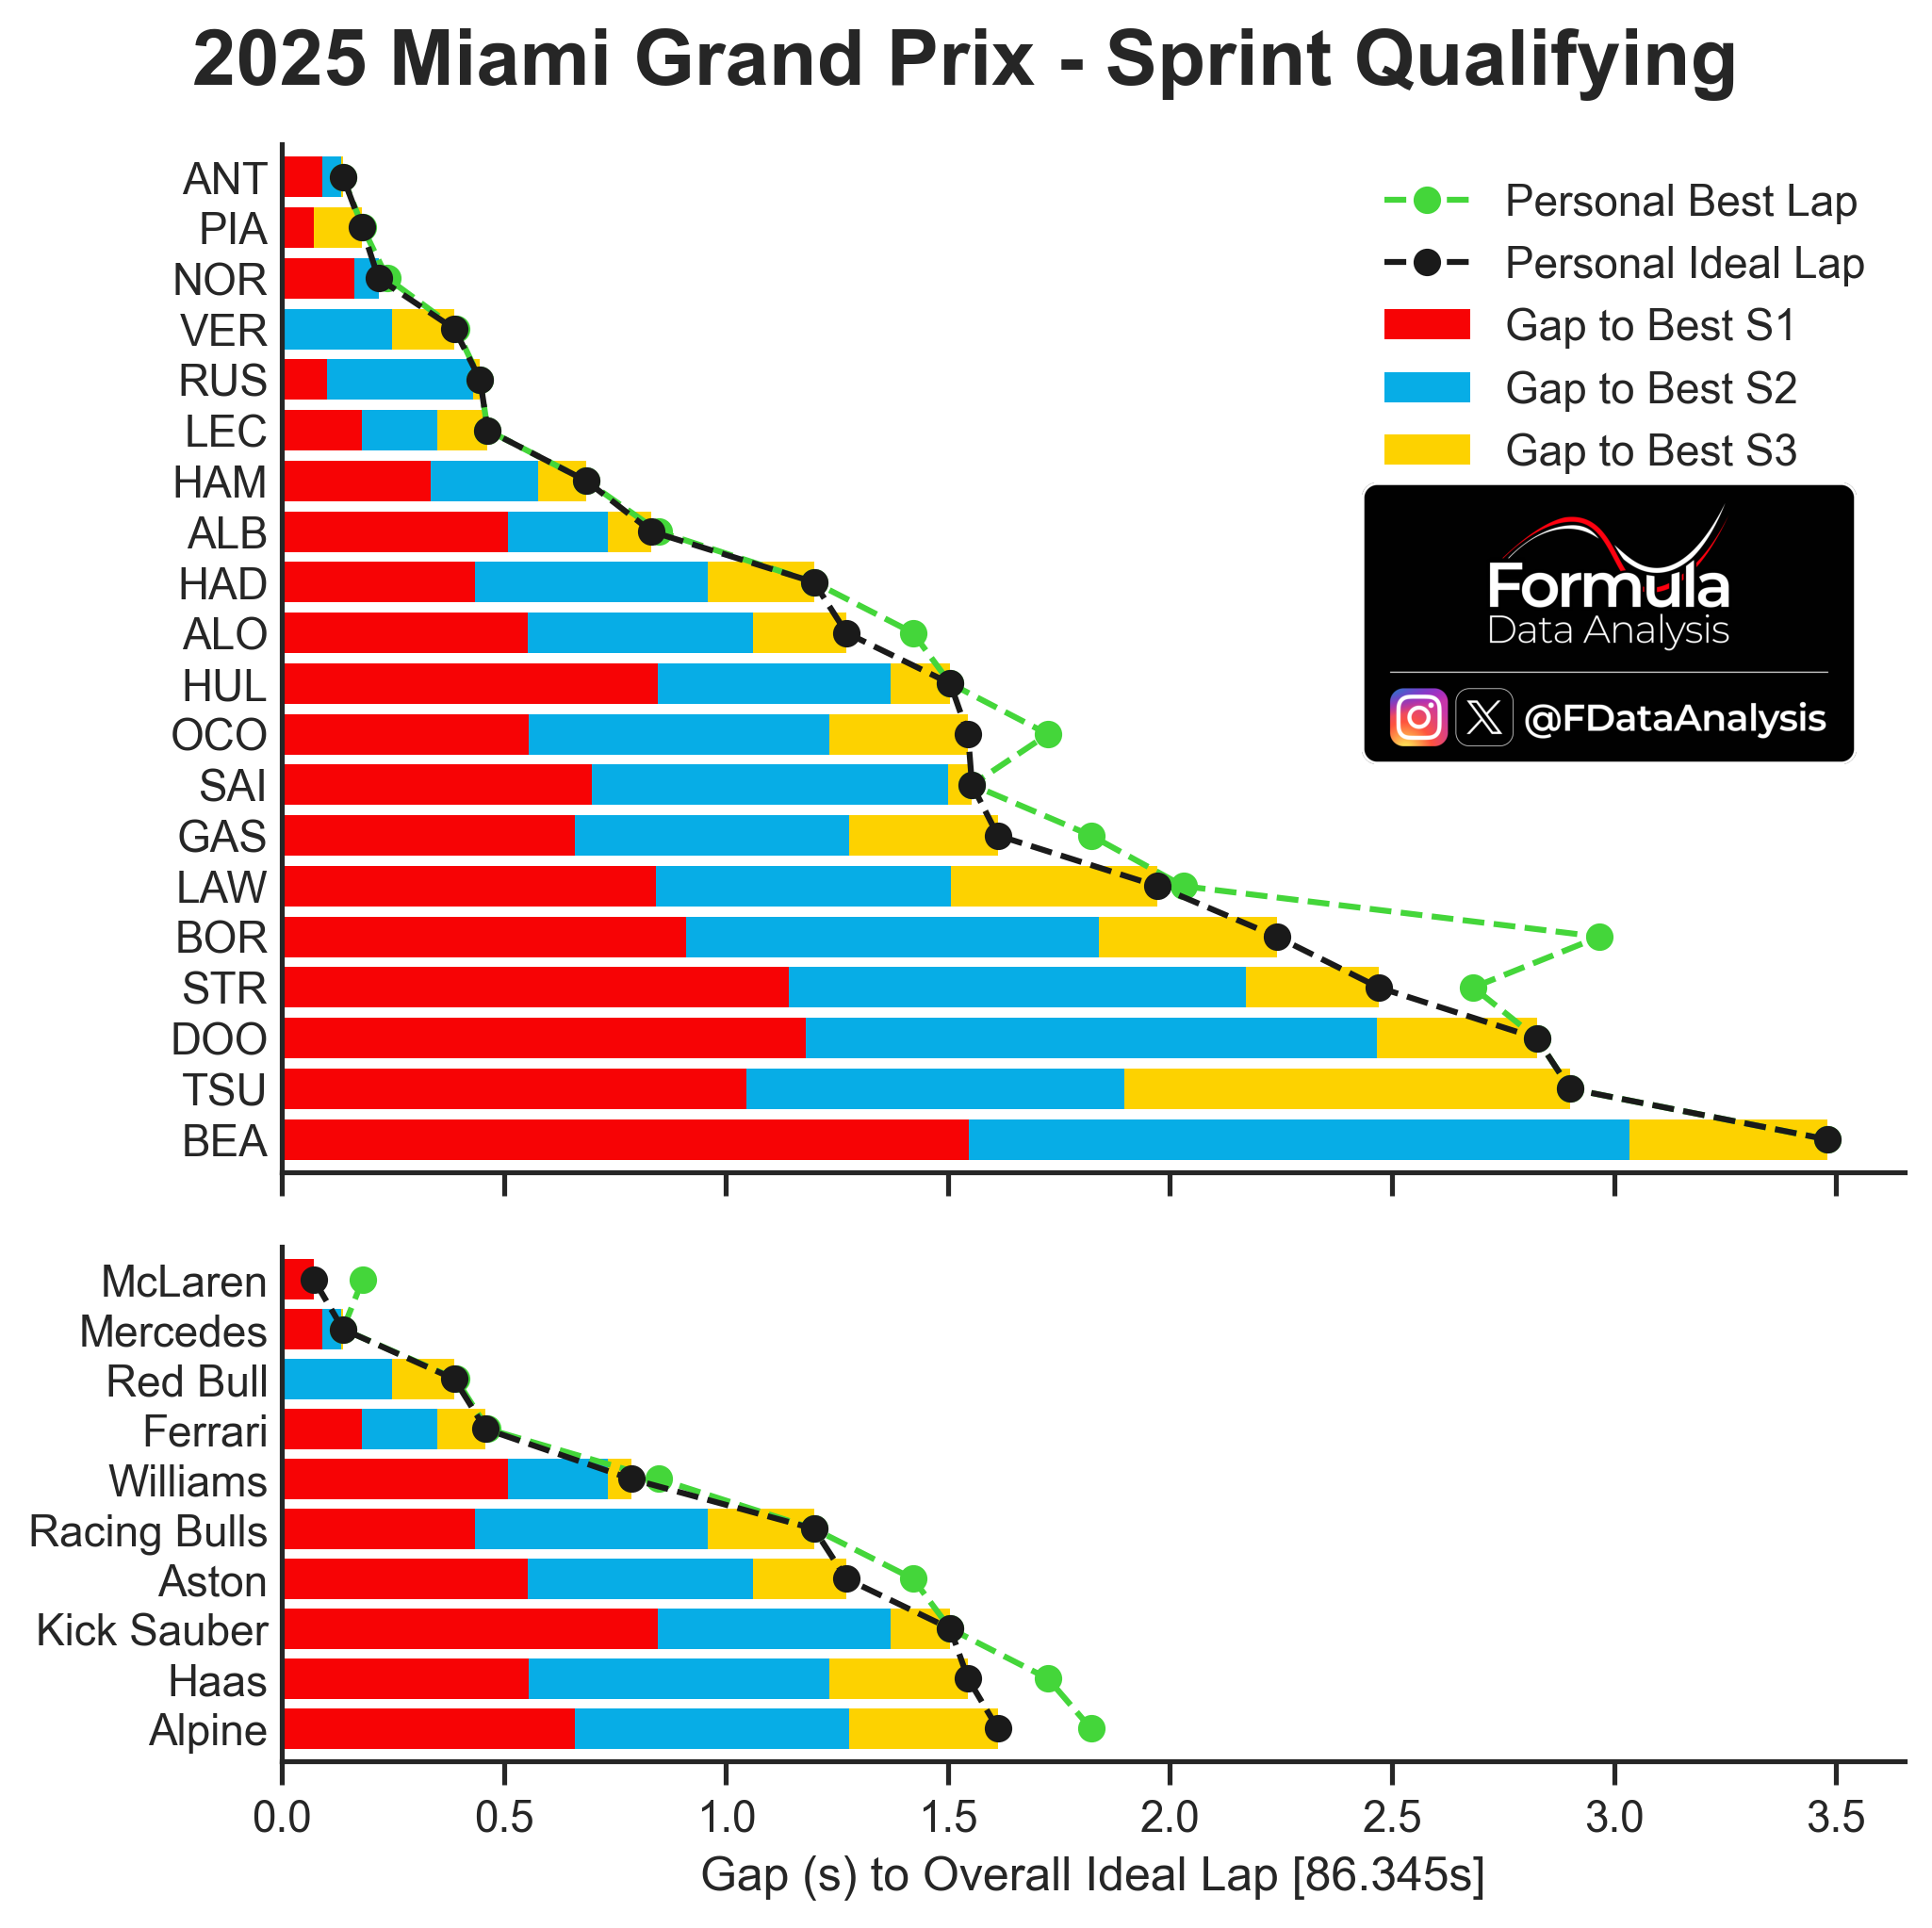
How to read: The graph shows, for each driver and each car, the ‘Personal Ideal Lap’ (the lap time obtained by the sum of that driver’s or team’s best 3 sectors, which might have been achieved in different laps) in black, and the ‘Personal Best Lap’ (the best lap time that the driver or team has effectively achieved in the session) in green. Consequently, the Personal Ideal Laptime is always equal to or lower than the Personal Best Laptime. If the two coincide, it means that the driver or team has produced its best sector times all on the same lap. The farther the Personal Best Laptime is from the Personal Ideal Laptime, the more potential lap time that one driver or team has left on the table. The coloured bars indicate the gap to the absolute best sector time. The ‘Overall Ideal Lap’ is shown at the bottom of the figure and is the sum of the lap times of the overall best sectors, independent of which driver or car achieved them.
Almost all top drivers combined their respective best sectors, so they had little room to improve in SQ. OCO, GAS, BOR, and STR did quick sectors on different laps.
Among teams, McL could have been quicker than Mercedes if only it combined its respective best sectors. This, however, would not be possible in case PIA and NOR were running a slightly different setup.
Teams sorted by ideal laptime:
McL
Mercedes
RBR
Ferrari
Williams
RBs
Aston
Sauber
Haas
Alpine
Even when considering the ideal laps, Mercedes was extremely close to McL! Their pace was real, and not just due to mistakes from McL's drivers.
Throttle use
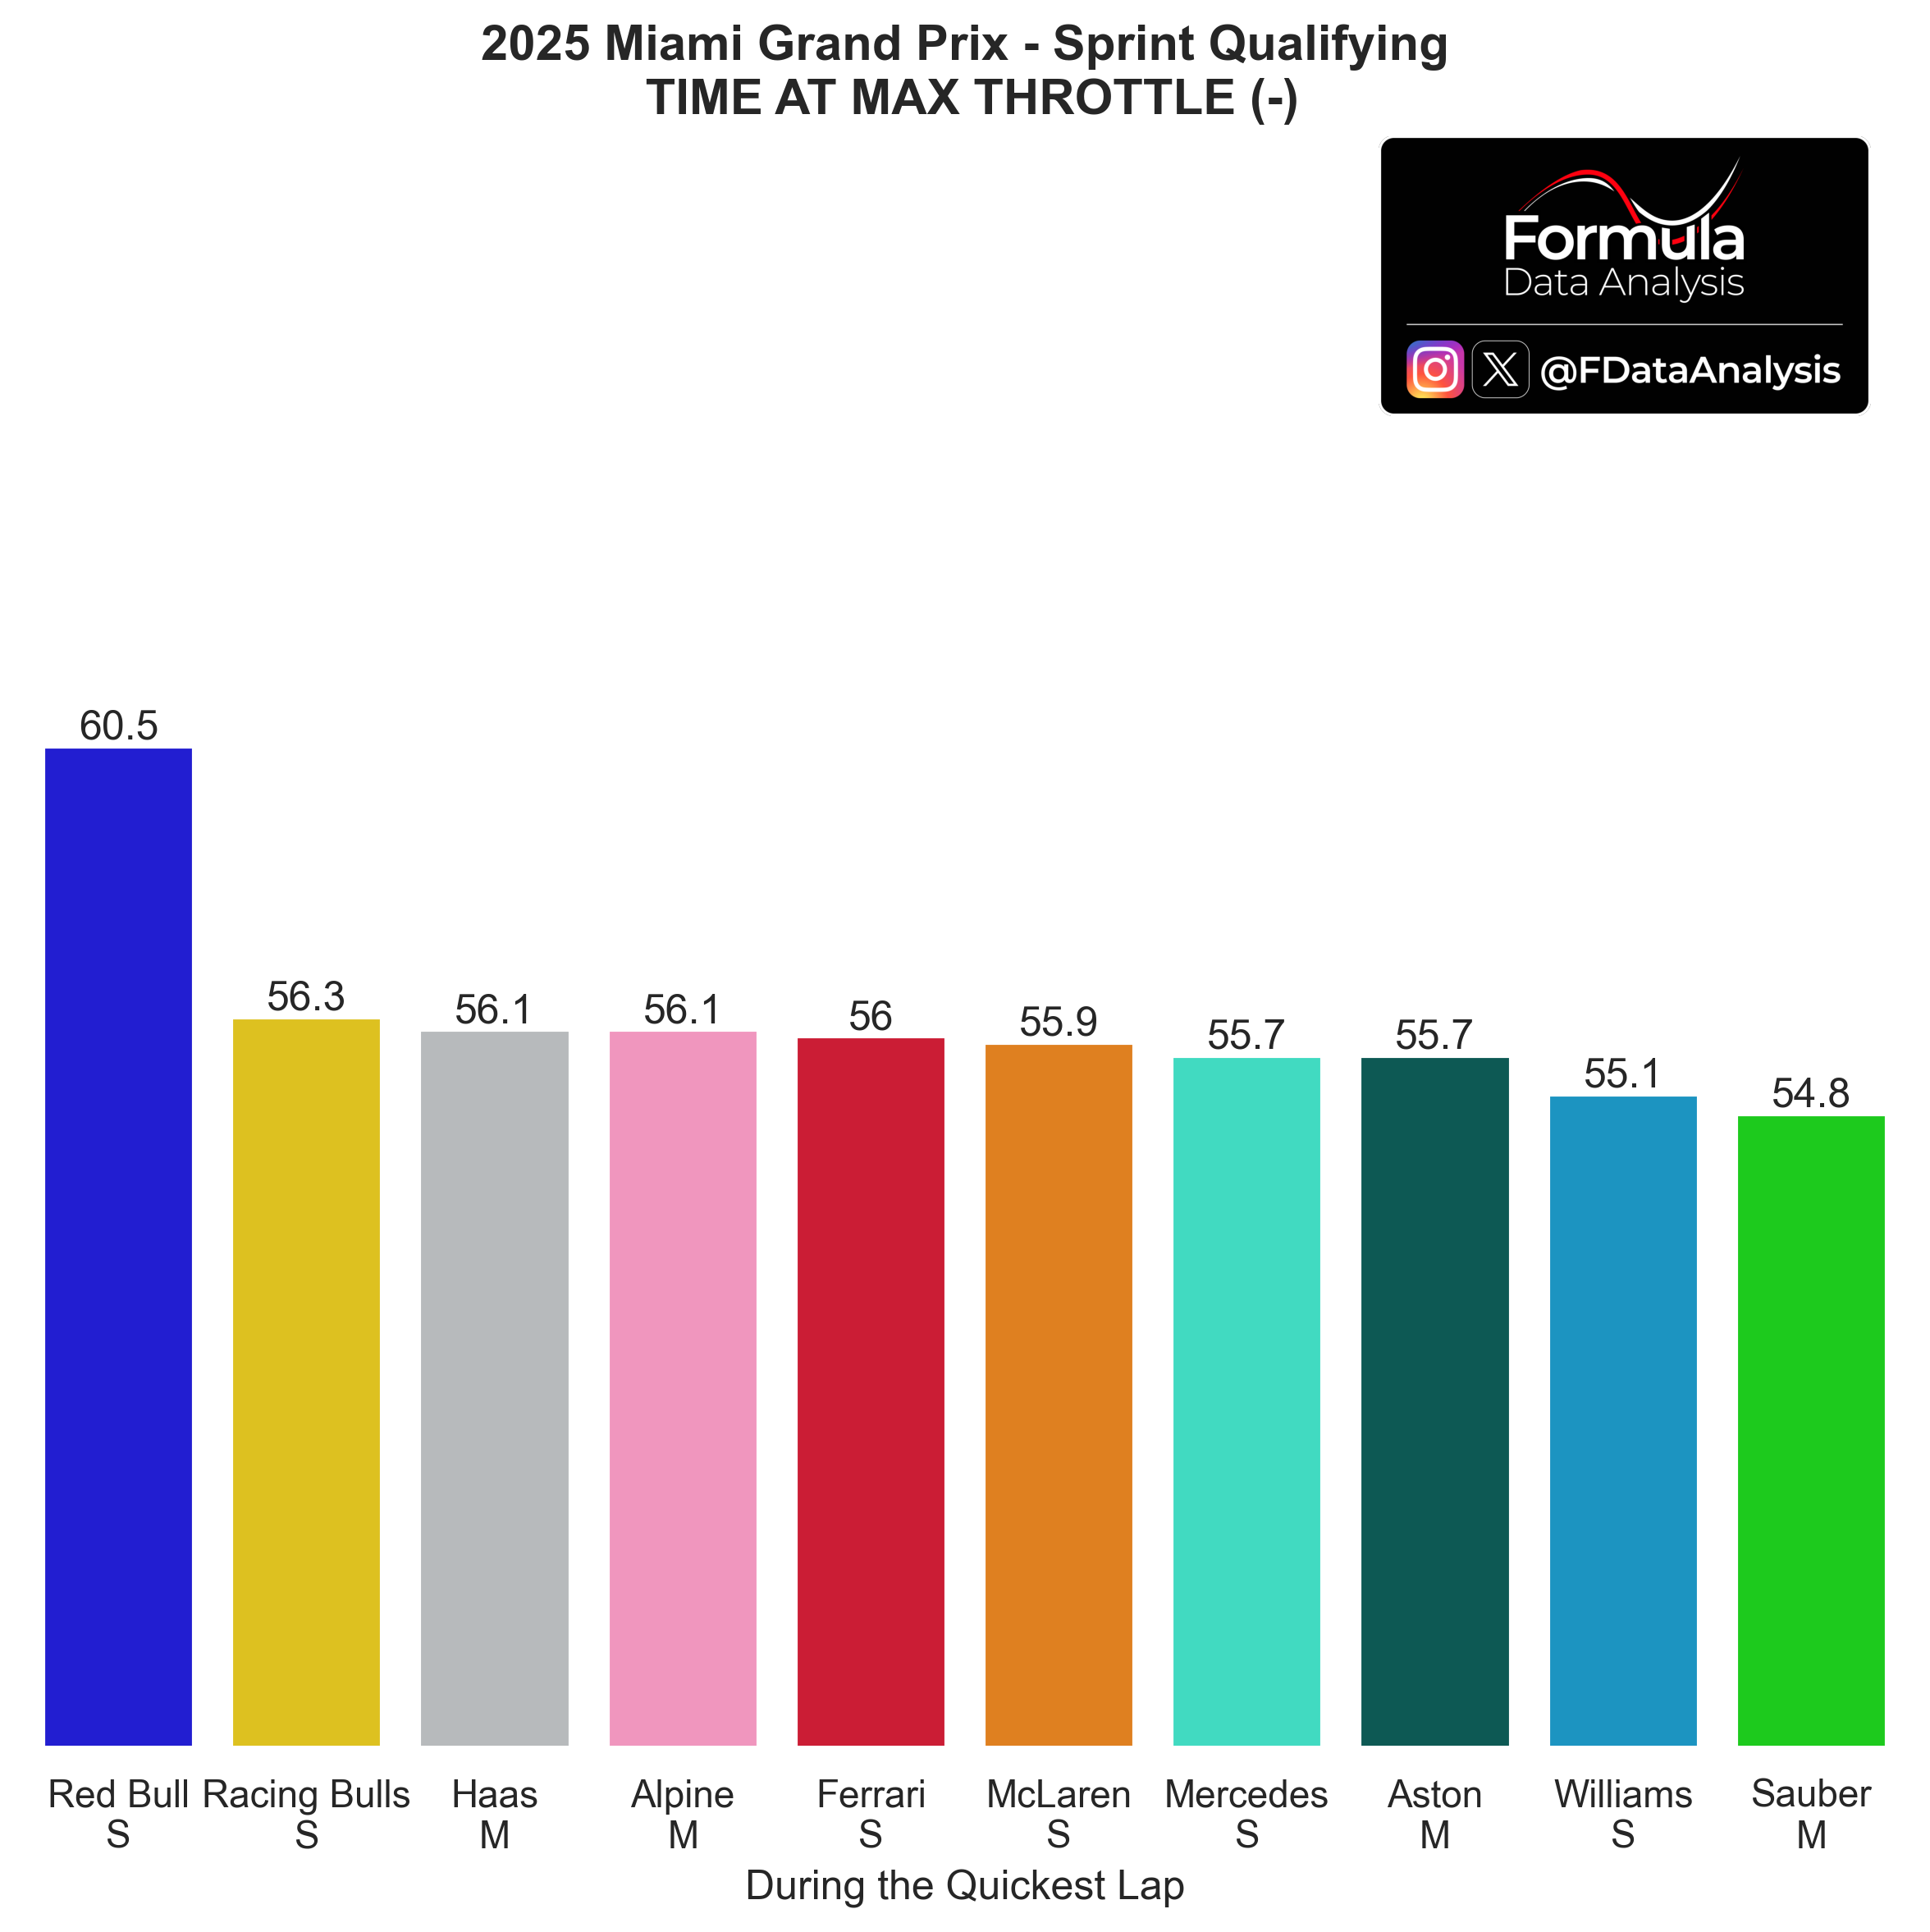
How to read: The graph shows the percentage of the time the driver spent at full throttle. Spending more time at full throttle is correlated with a weaker Power Unit mode, more drag, less fuel, and better grip (especially concerning traction out of the corners). This analysis is used together with the lap time produced by each driver and the corresponding top speed achieved to pinpoint which teams could be on a lower engine mode. For example, if a team produced a lap time worse than usual, but they are topping the charts concerning throttle usage, it's pretty likely that they were running a more conservative engine mode. Looking at the top speed achieved could confirm it.
RBR (VER) could stay full throttle for longer than anyone else! Their more loaded rear wing is helping them put the power down, but as the car was lacking in other areas, it didn't translate into a pole.
Same chart, per driver:
Take the different compound into account, but the fact that VER could stay full throttle for 7.4% of the lap more than TSU tells us that he's able to extract something from his RB21 that other drivers cannot.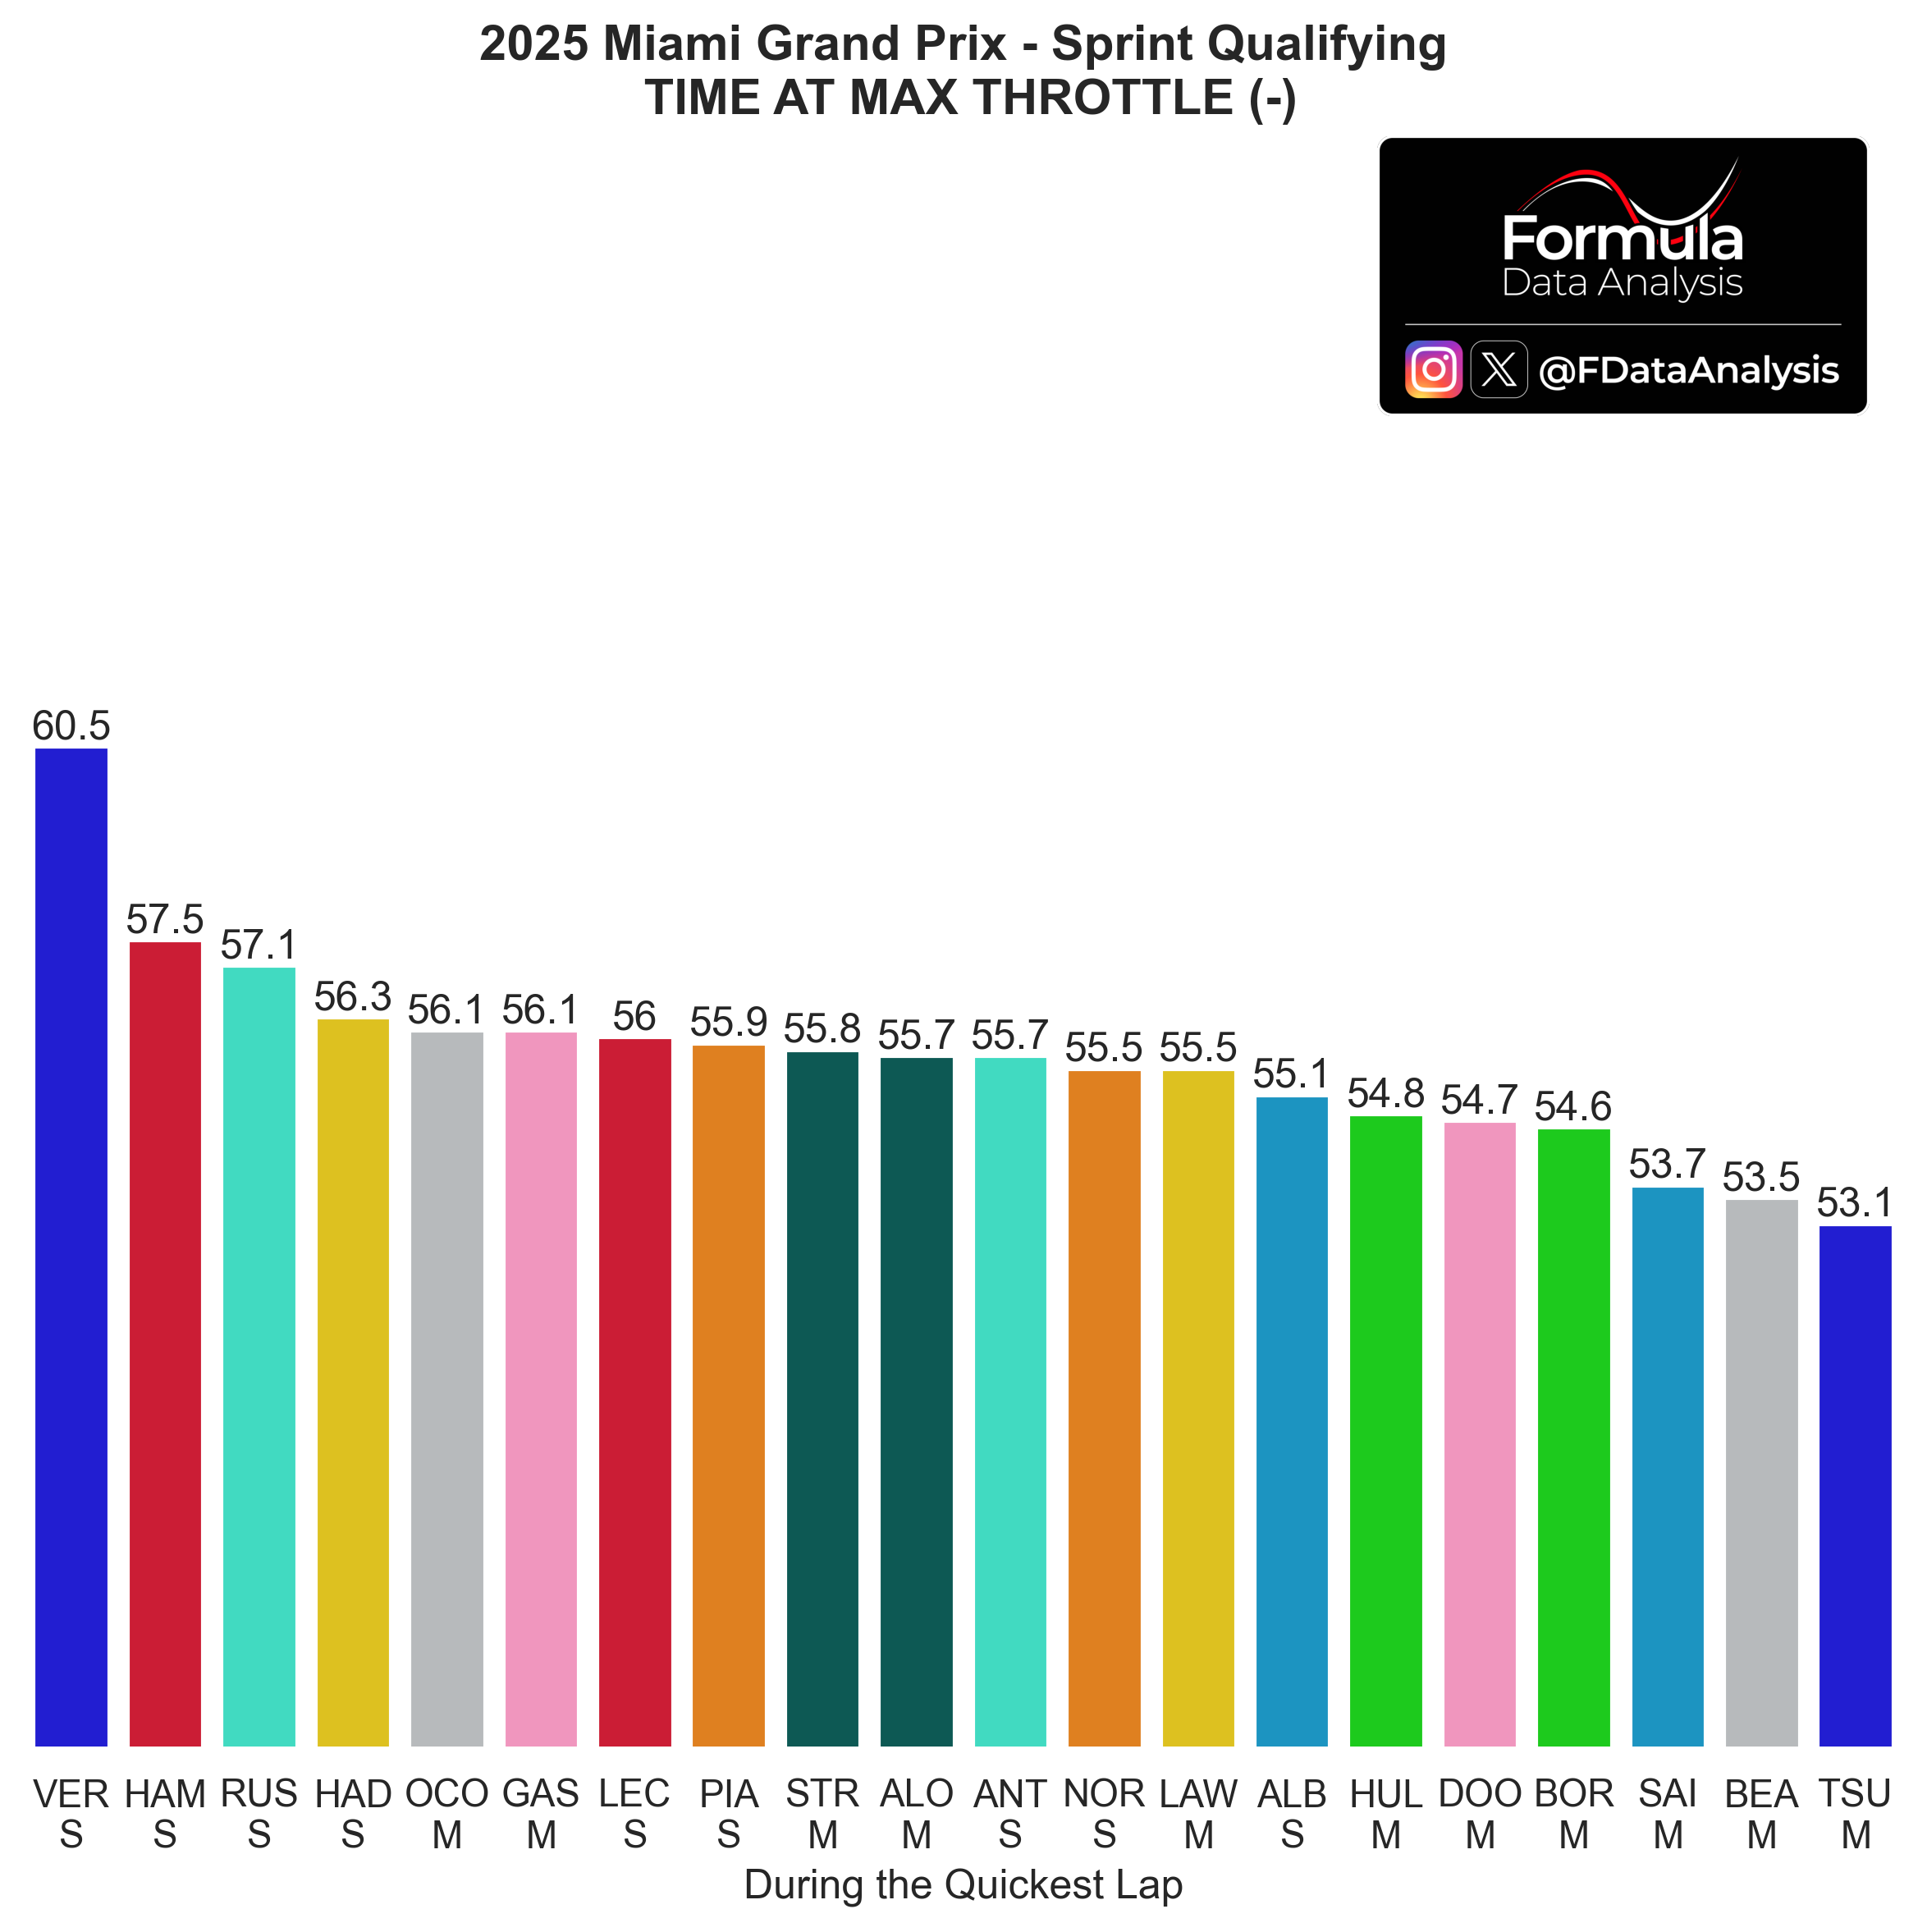
Race Pace
Long Runs

How to read: The chart shows the distribution of lap times during each team's long runs. A long run only includes segments of at least 5 consecutive laps run on the same compound without pitting or slowing down.
HAM completed 4 consecutive laps at a very remarkable pace: 1:29.206 average pace is impressive, but he could have been pushing far more than what it's possible on a longer stint NOR and LEC's long runs are hard to interpret, too, as they started them with a few push laps to then stabilise on higher laptimes. PIA's long run was 4 laps, like HAM, and as consistent yet significantly slower, likely due to a higher fuel load. As always, RBR was running very detuned engine modes and loaded fuel tanks in quali, which explains their slow (yet consistent) laptimes. Mercedes impressed the most, in my opinion: ANT did 12 consecutive laps and RUS 15, with minimal tyre wear and very consistent laptimes. Expect ANT to be able to defend his position from the two fierce McLaren drivers!

Bottom 5 Teams, based on last year's WCC
Extreme consistency by BEA, who was likely running to a target laptime. HAD progressively improved his pace to then set his push lap, and then eased off to transition towards a more traditional long run.
Overview of all teams: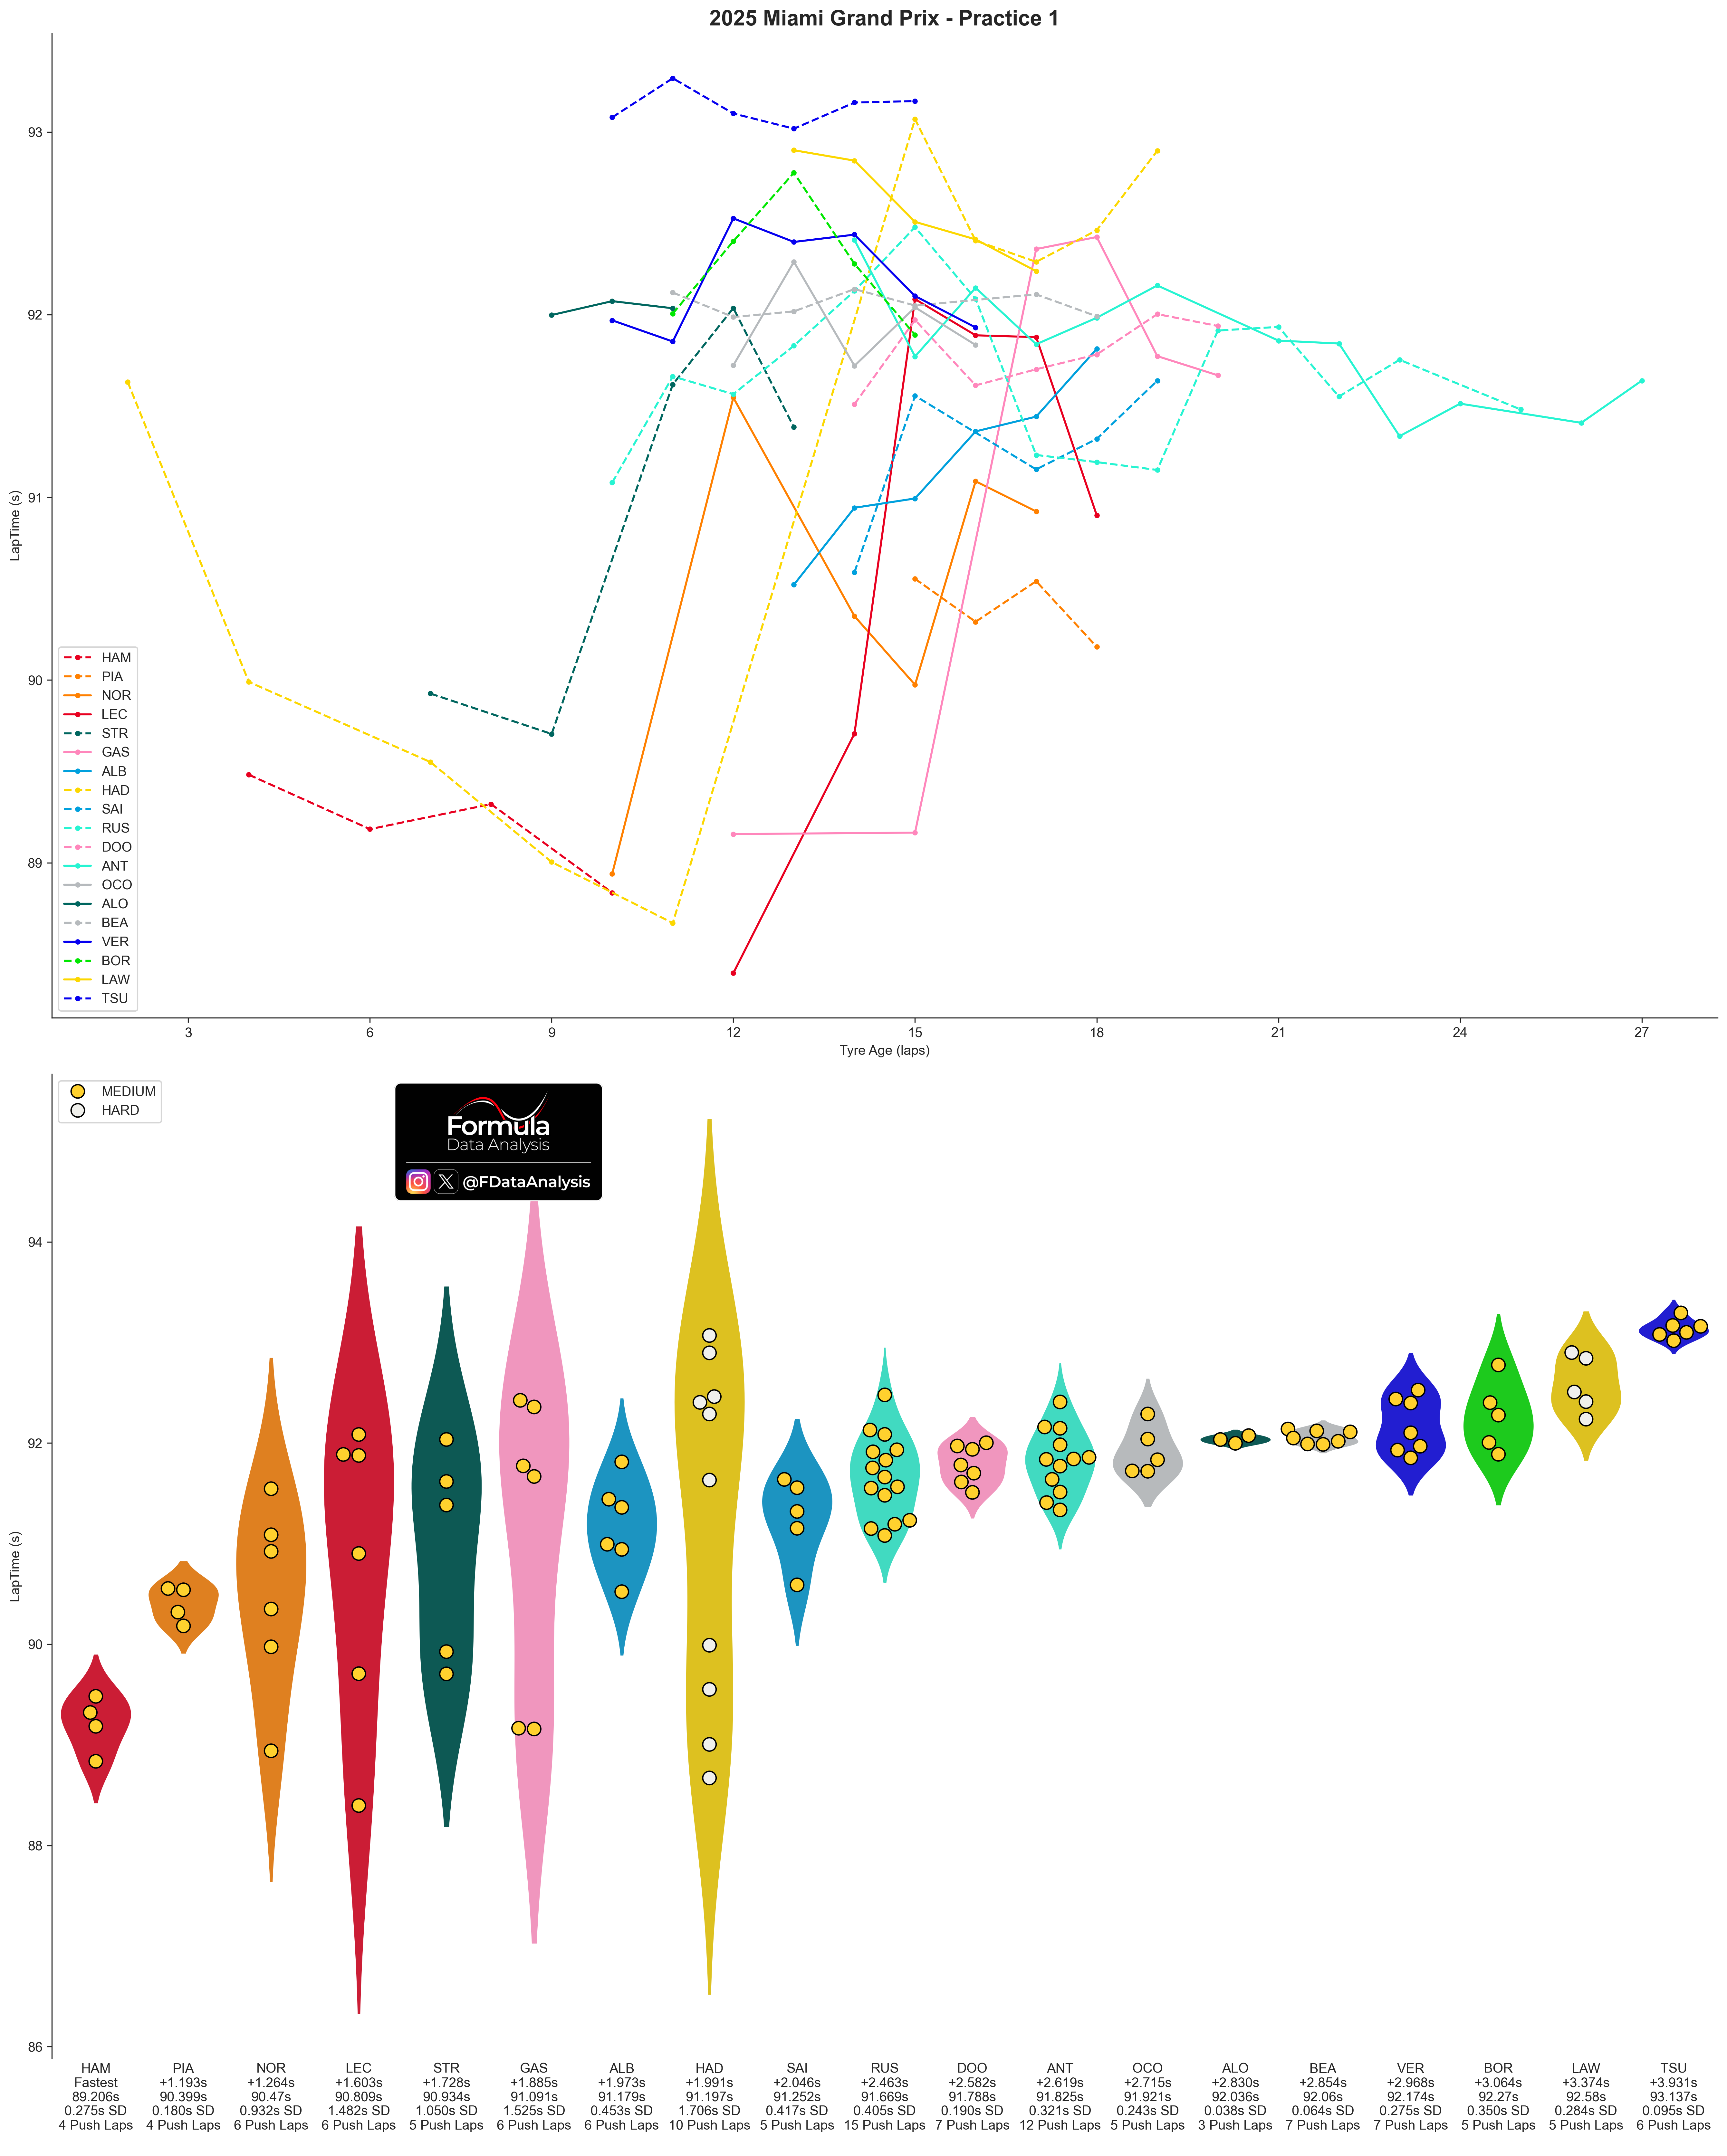
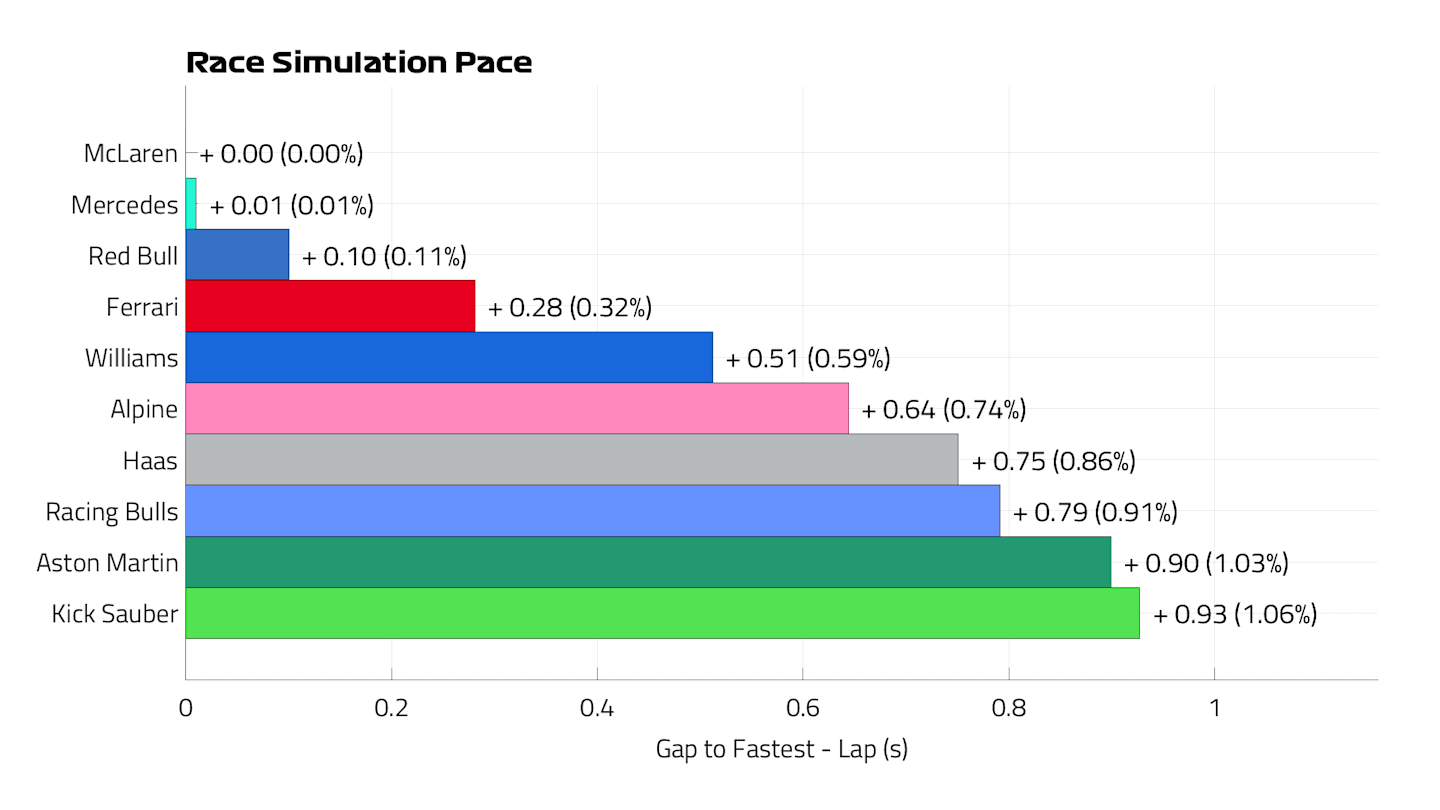
F1's (Lawrence Barretto's) race simulation based on FP1:
Everything I've seen so far makes me agree with this prediction about the top 4 teams: expect McL and Mercedes to have very similar pace, RBR (VER) to be right behind them, and Ferrari to struggle a bit more, but to be safely in front of all the other teams. Sauber's low downforce should not help them manage their tyres over a stint, so their placement as last is correct in my opinion.
Pace Last Year
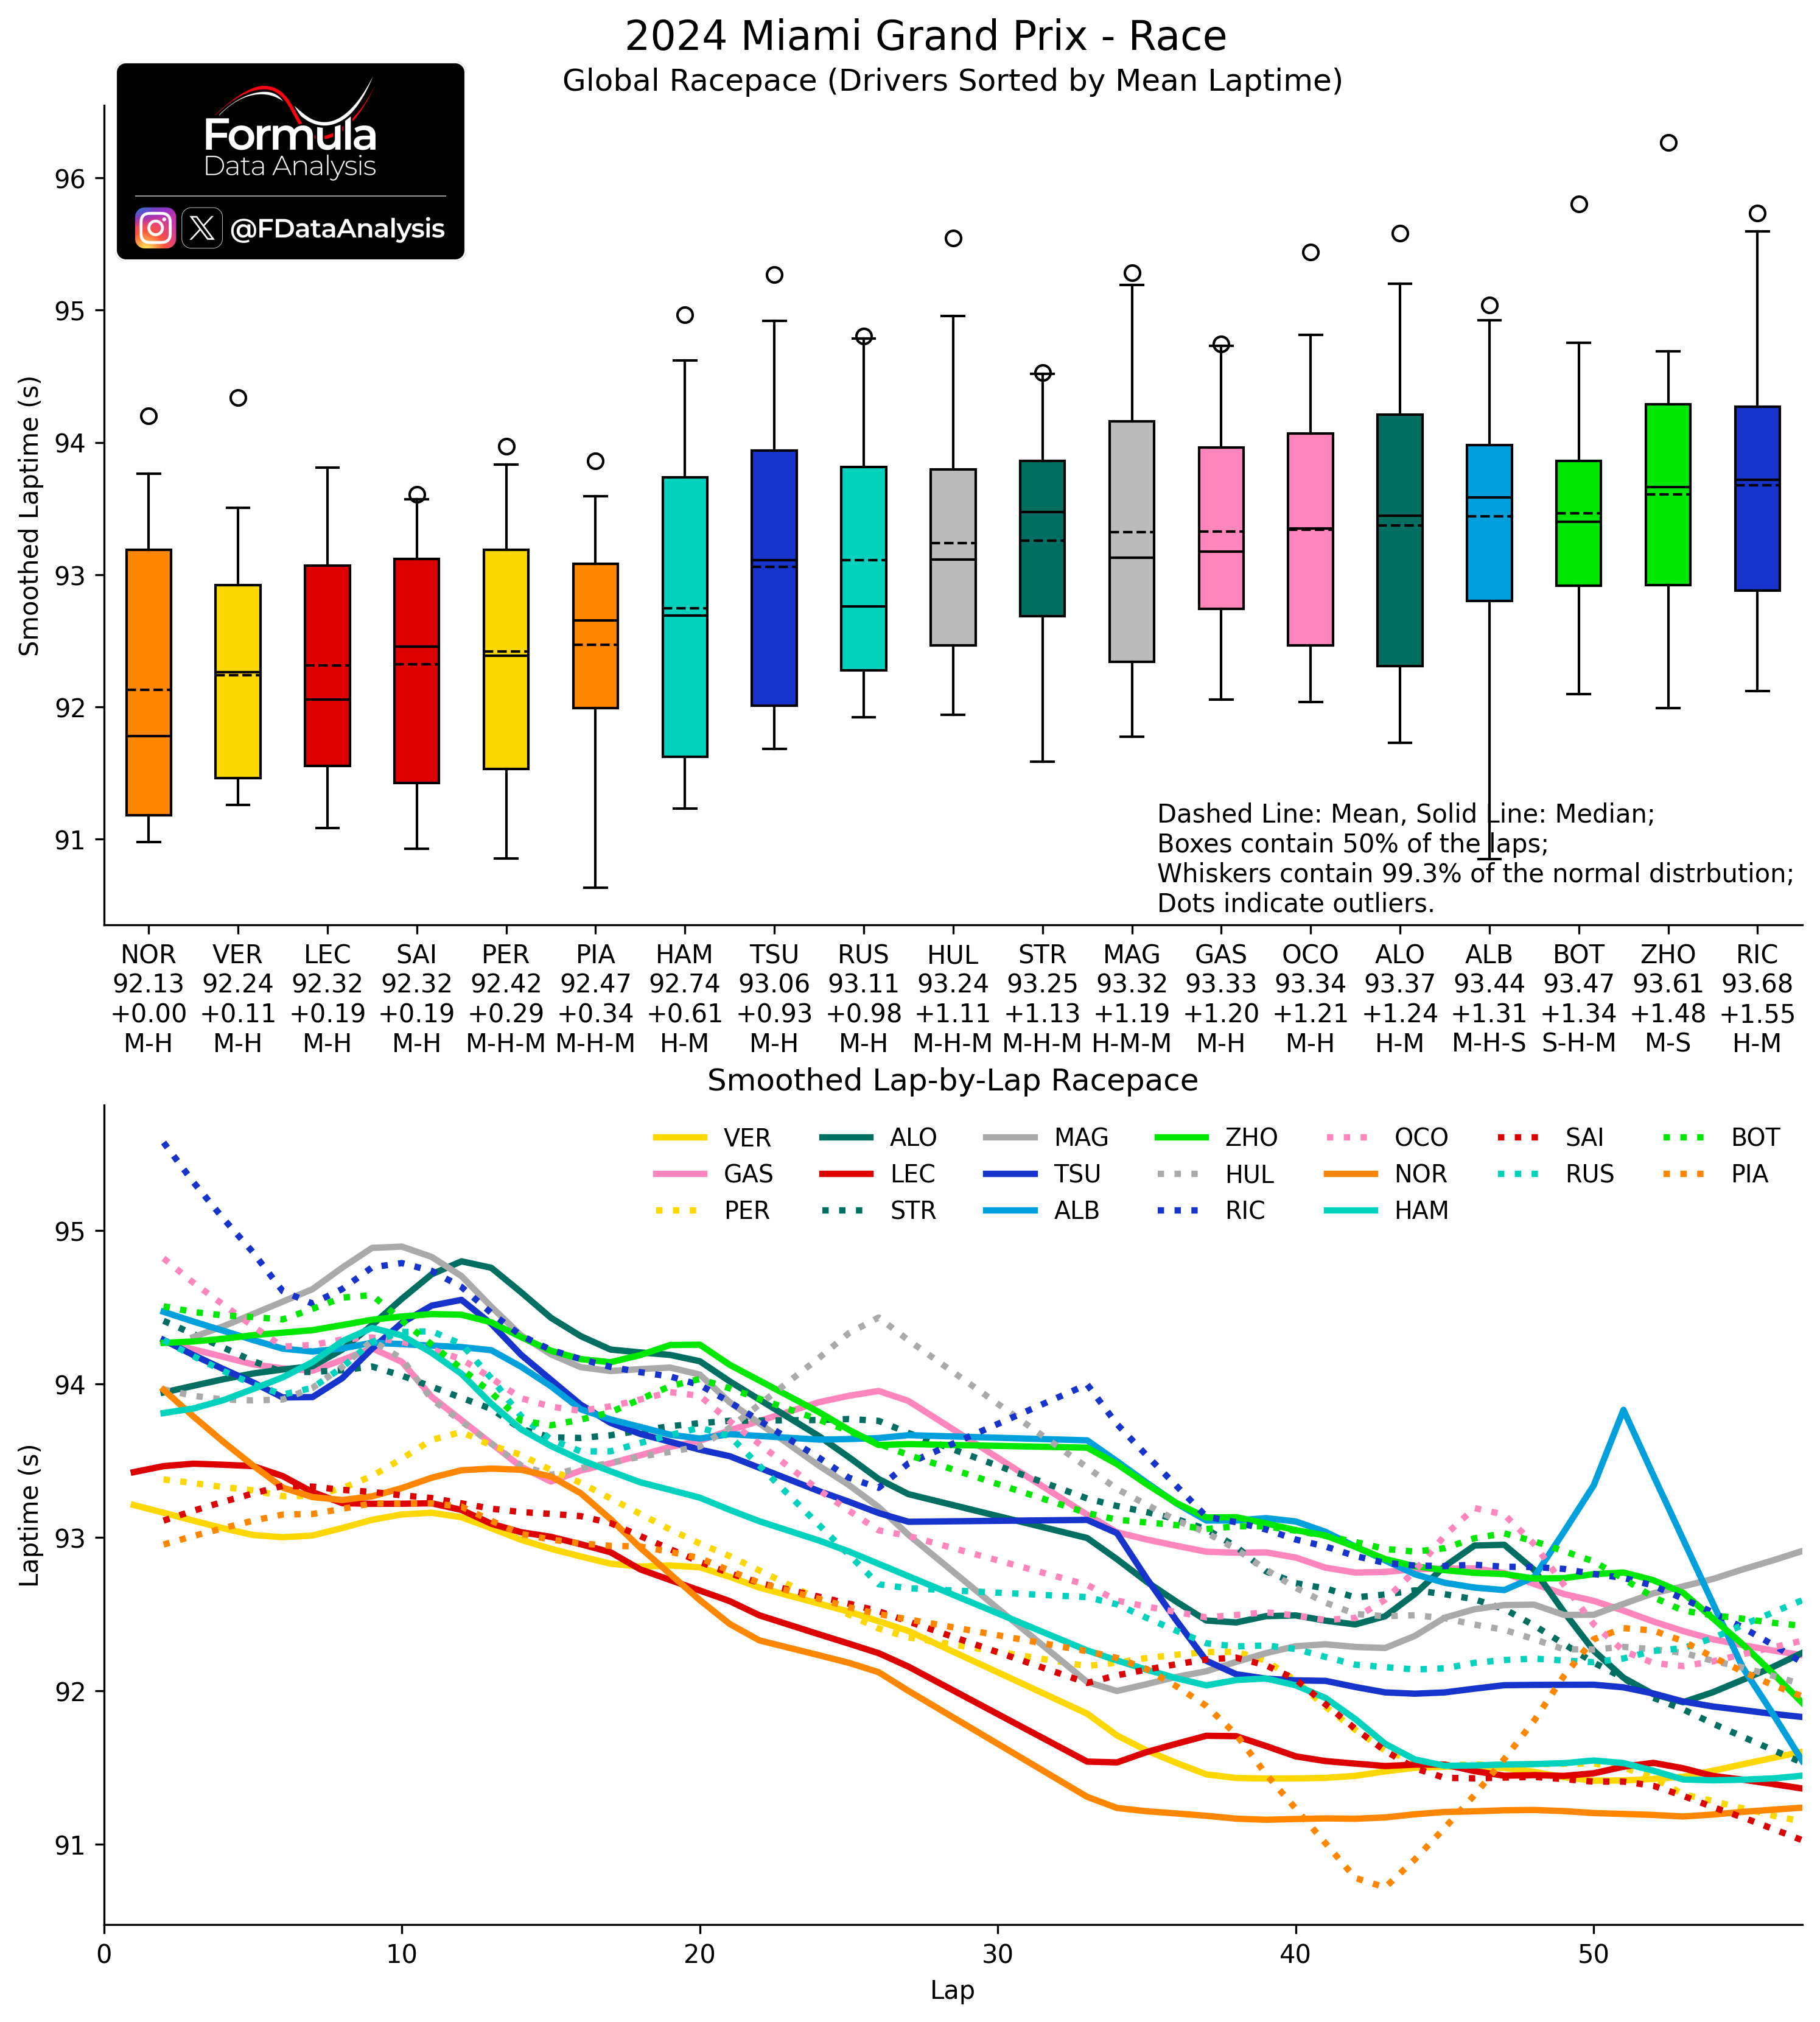
How to read: The upper plot shows the synthesis of each driver's pace during the race. The lower plot shows the (smoothed) evolution through the laps. Each bar contains the central 50% of the distribution: the shorter it is, the more consistent the pace. Inside it, the solid line indicates the MEDIAN (how quick was the TYPICAL lap), while the dashed line indicates the MEAN (how quick was a lap ON AVERAGE). The whiskers include all the laps from a driver which are not uncharacteristically slow for that driver: the lower whisker, in particular, shows that driver's quickest lap. The mean lap time is indicated below each driver's name, and below that is the gap to the quickest driver. The bottom line indicates the tyres used.
McLaren, Red Bull, and Ferrari were all on similar pace levels, which was great to see. Verstappen’s performance was affected by floor damage, but even factoring that in, the other two teams were right there with him. McLaren’s upgrade package (fully on NOR’s car, partially on PIA’s) looked very promising already. Perez, with no damage, was still behind NOR and both Ferraris, but not by much.
PIA looked solid, especially considering he wasn’t on the full-spec car used by NOR, but it’s worth noting that his extra tyre set made his pace seem a bit stronger than it probably was. Behind him came HAM, and then TSU a bit further back, who topped a group whose pace was heavily shaped by Miami’s relentless traffic.
My prediction
Quali
Overall, this is my expected running order concerning quali (considering the placement of the best driver of each team, so the ultimate car’s potential). Teams on the same line are too close to call:
McL, Mercedes
RBR (VER)
Ferrari
Williams
Racing Bulls
Aston, Sauber
Alpine, Haas
Sprint and Race Pace
This prediction describes the pace expected for each team, independent of their starting position. Teams on the same line are too close to call:
McL, Mercedes
RBR (VER)
Ferrari
Williams
Racing Bulls, Alpine
Aston, Haas
Sauber
Let's see which pecking order will take place! What's your prediction?
Thanks for your support, as always, and enjoy the race weekend! And check the data repository for more analyses.
Mirco / Formula Data Analysis