

Dear F1 Data Analysts,
Welcome to my home Grand Prix! (The first of the two: I live closer to Imola than to Monza, yet my work office is also just 2km away from the Monza track...) And for the occasion, I've made this article free for everyone ;)
Imola is one of the most legendary tracks in Europe, and among those on the calendar, one of those with the richest (and most dramatic) history: from Ratzenberger's and Senna's fatal crash in 1994, to the Alonso-Schumacher duel in 2005. The track is tricky, as anyone who has tried it on Assetto Corsa can confirm, as it's not easy to understand the best way to approach several of its corners; a so-called 'technical' track.
I'm going to explain the context first, and next show you the data so far to try to determine the pecking order: it will be a long article, and I'm sure you'll enjoy it!
Track Characteristics
How to read: The track map shows its layout divided into three sectors (S1 in Red, S2 in Blue, and S3 in Yellow). The zones in which the DRS can be used are highlighted in green. In the race, a driver who crosses the DRS Detection Zone within 1s of the preceding driver can use the DRS in all zones up to the next DRS Detection Zone.
Even though the track is demanding skill-wise, it is not in terms of mechanical stress on the cars: the lateral and longitudinal forces and accelerations achieved are below those of most other racing tracks on the calendar. One peculiarity: the track features just one DRS zone: teams have to trim their upper plane to achieve a good top speed on most parts of the track, and overtaking will be pretty hard. As overtaking is hard, track position is important: this factor will reduce the likelihood of a two-stopper (contrasting with the fact that Pirelli is bringing one-step softer tyres compared to last year: C4-C6 instead of C3-C5)
Characteristics of each sector:
Sector 1 (red): Two straights connected by a chicane (T2-3), and followed by another one (T5-6). The first, longer straight is a DRS zone (and the main overtaking spot on the track)
Sector 2 (blue): A demanding section consisting of a hairpin and several medium-speed corners with significant changes in slope. The slow T12 leads to a short straight.
Sector 3 (yellow): A slow chicane which leads to a straight. The lap ends with 2 left-hand, 90-degree corners.
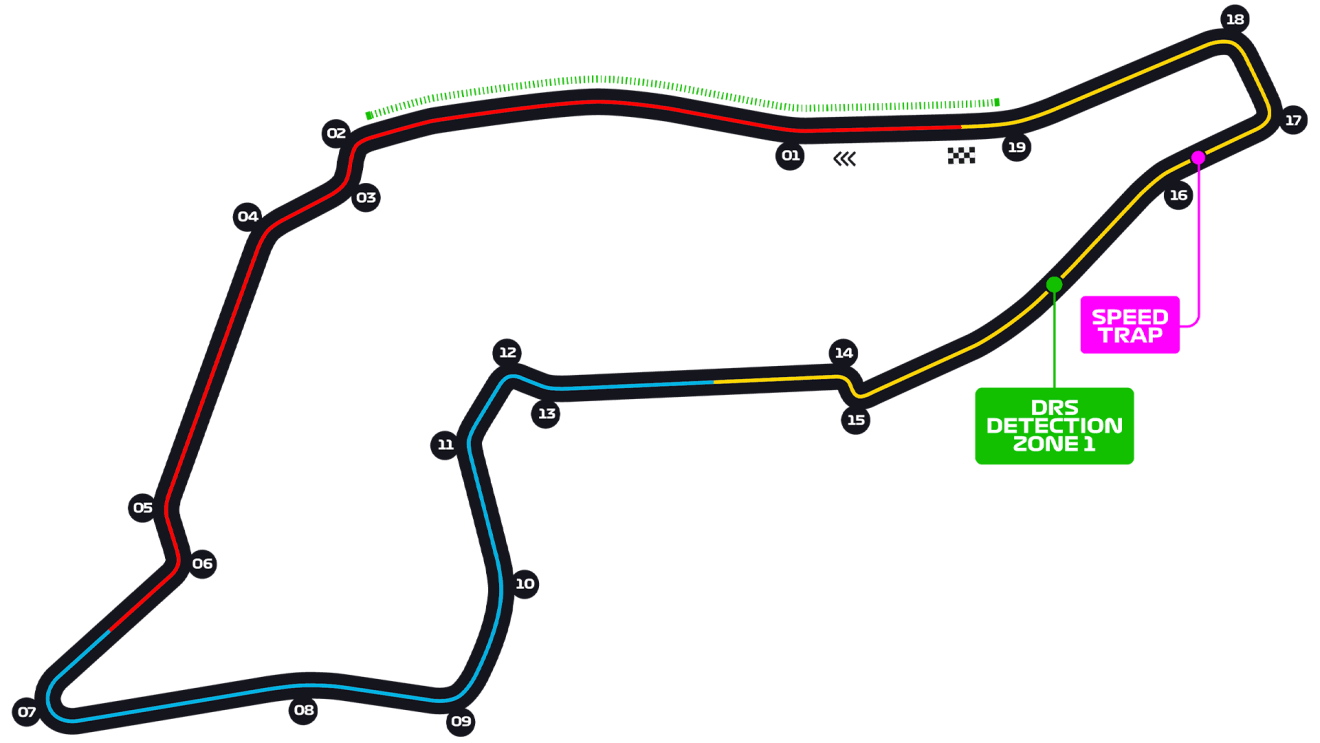
The three sectors are not all that different: each one requires some degree of agility (for the direction changes), lateral grip, and braking/traction performance. S2 is the only one that does not emphasise drag, due to the lower top speed reached there. Overall, however, drag does not play a huge role here, and it only slows down the car significantly in sector 1 (especially when DRS is inactive).
The low-to-moderate forces required for the tyres through a lap allowed Pirelli to bring the softest compounds to the track: the C6 will debut here! The compound was never used before (as no team tested it in the pre-season tests), and Imola is probably not the best track for it (as Monaco and Singapore, with their lower average speeds and therefore aerodynamic load, can better exploit its grip without the risk of overheating it or causing excessive wear). For this reason, Pirelli expects teams not to use it for the race, and only employ it to get extra performance in qualifying. Interestingly, the track features medium-low grip AND medium-low track evolution. This is unusual, as normally a less grippy track surface improves the grip as more rubber is laid onto it. Therefore, Q1 should already provide us with a clearer picture of who is looking good in Q3 and who will struggle instead.

Wing Levels
What it means: Teams can use different rear wings. A more loaded rear wing will produce more downforce at the expense of more drag: the car will have slightly better traction, cornering, and much better braking, but also lower high-speed acceleration and top speed. Generally, it will have less tyre wear, but it will also quickly empty its battery. A more loaded wing plane is a plane with more camber (more curvature) and a higher angle of attack (the angle of the wing relative to the airflow). The wing load can be increased independently through the lower and upper planes: the DRS only acts on the upper plane, so running a more loaded upper plane and a less loaded lower plane will generally make that car's DRS more effective.
Pirelli described Imola as a 3/5 downforce track, and the teams' wings choices reflect that: most opted for medium downforce wings, although some (Racing Bulls) went for medium-low while others (Aston) opted for a medium-high load spec.
Imola confirms the difference in design philosophy already seen in Miami: McLaren and Mercedes use a spoon-shaped lower plane, while RB's leading edge is horizontal throughout the wingspan. Mercedes is a bit of a middle ground. The idea behind a spoon-shaped wing is to generate downforce in the central part of the plane while reducing the load in the least efficient part of it (close to the endplates, where the high-pressure air tries to bleed towards the lower-pressure part, increasing drag and reducing downforce). Red Bull, however, seems to make their different design work, too (otherwise they would not choose it race after race!)

Wings in Miami, for comparison:
McLaren has increased their wing load. Ferrari, Mercedes, and RBR instead seem interested in running a very similar configuration to the one seen in Miami, even though Imola is a track more suited to higher downforce. In Miami, however, McL was the outlier: this change makes them more aligned with their competitors.

Weather Forecasts (by F1)
FRIDAY, MAY 16 – FP1 AND FP2
Conditions: Overcast from midnight to dawn with a moderate chance of light rain until 8:00. Improvement expected then with a sunny and mainly dry day. Moderate northeasterly wind with gusts up to 35kph until mid-afternoon, decreasing then. FP1: 19°C // FP2: 18°C
Maximum temperature expected: 19 Celsius
Minimum temperature expected: 13 Celsius
Chance of rain: 40%
SATURDAY, MAY 17 – FP3 AND QUALIFYING
Conditions: Partly cloudy at first, becoming mainly sunny with a few cumulus clouds in the afternoon. Light southwesterly wind backing easterly in the afternoon. FP3: 20°C // Q: 20°C
Maximum temperature expected: 21 Celsius
Minimum temperature expected: 10 Celsius
Chance of rain: <20%
SUNDAY, MAY 18 – RACE
Conditions: Sunny at first becoming partly cloudy from noon with threatening convective clouds. Slight chance of one or two showers up to level 3 spreading from inland hills from 13:00 to 20:00. Light southwesterly wind. Race start: 22°C
Maximum temperature expected: 22 Celsius
Minimum temperature expected: 12 Celsius
Chance of rain: 20%
Significant chance of rain for Friday (40%), low for Saturday (<20%), but it could come back for the race (20%). Imola is a tricky track, even more so in the wet!
Single Lap Pace
Best Laptime per Driver
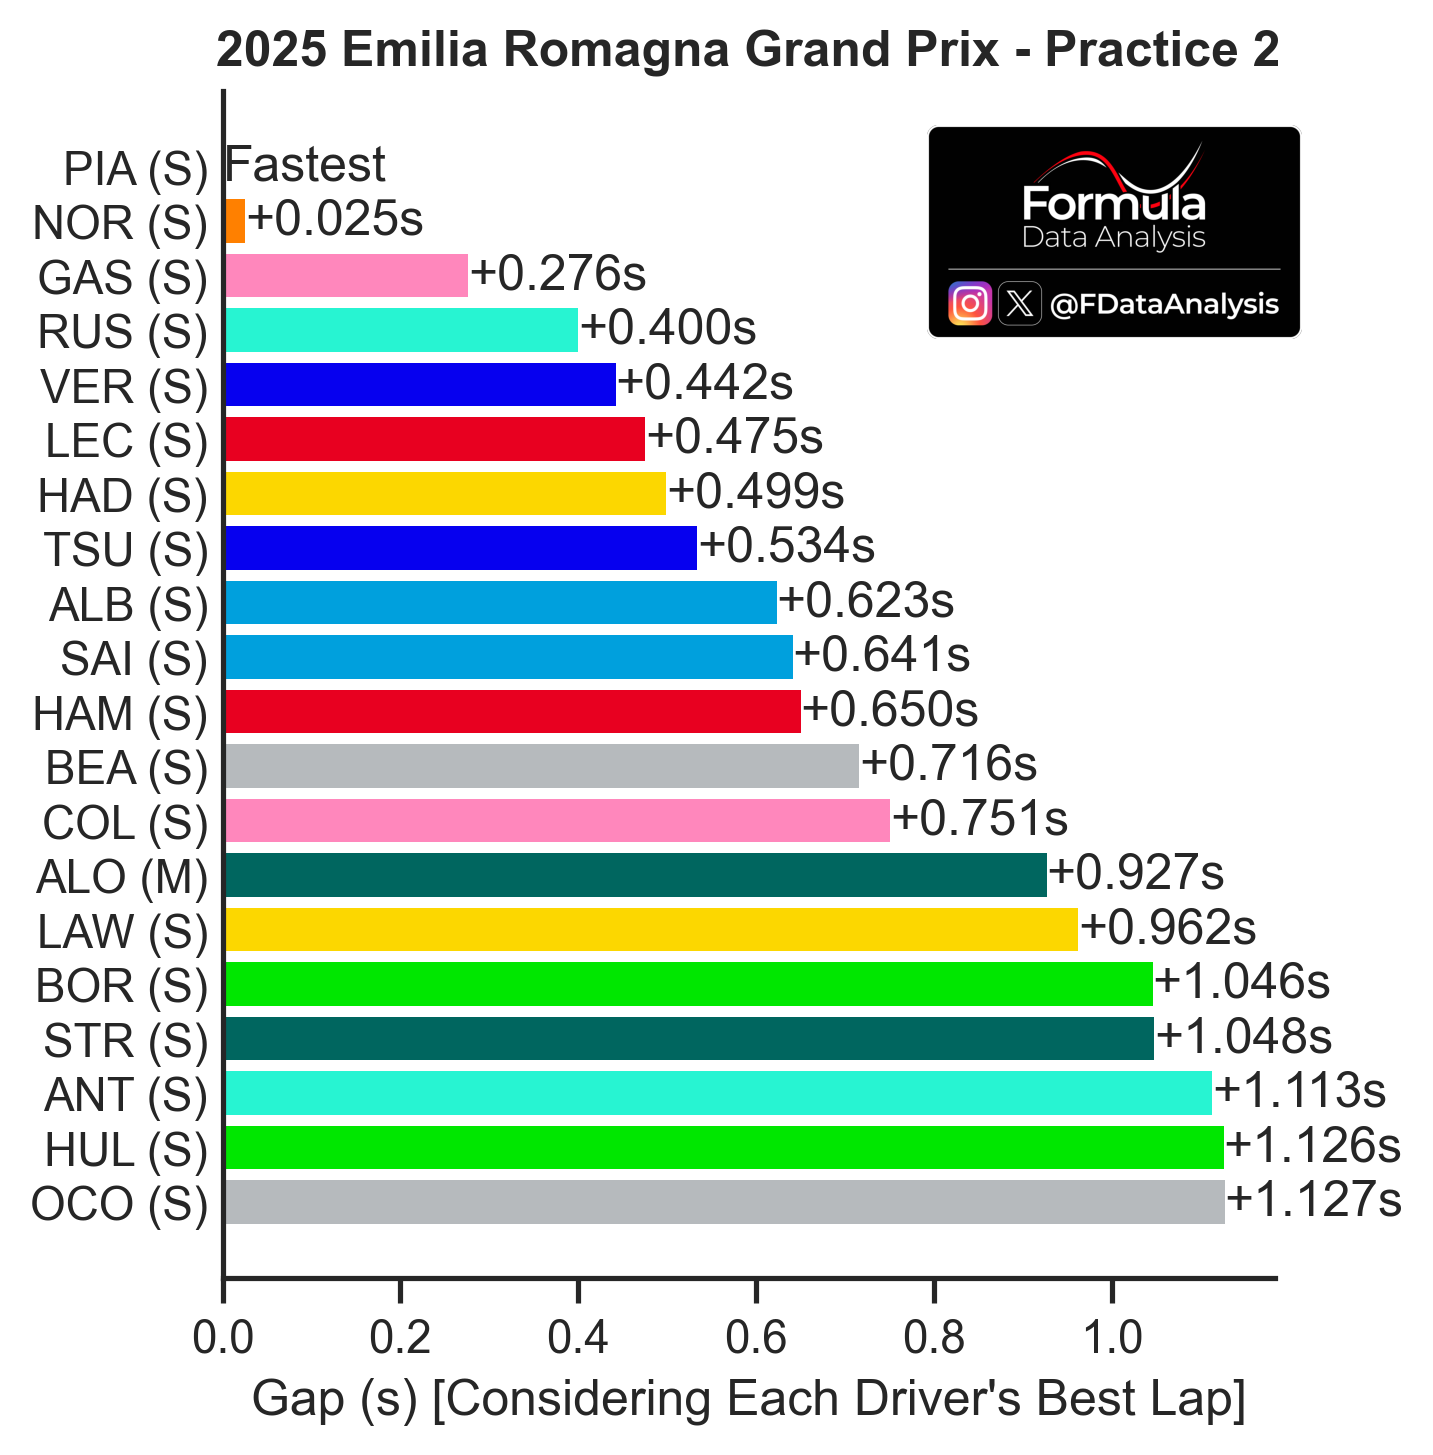
How to read: The graph shows the difference between each driver's fastest lap in the session. The letter to the right of each driver indicates the compound used.
Only ALO set his best lap on Mediums; everyone else used the C6, which makes the comparison clearer.
McLaren topped the standings, and not by a small margin: even NOR was still two and a half tenths quicker than the next best driver (GAS)
Gasly recovered from his FP1 accident and defined this one as the 'best Friday of the year': he thanked the good feeling he had with the car for that, which also reflected on his big gap to just-returned COL.
RUS was the 3rd quickest, then LEC, HAD, and TSU all within a big over one-tenth. William's performance was solid: 9th and 10th quickest.
Sauber has been struggling the most in FP2, yet BOR was 'just' a bit over 1s slower than PIA: the field is pretty tight.
Aero Map
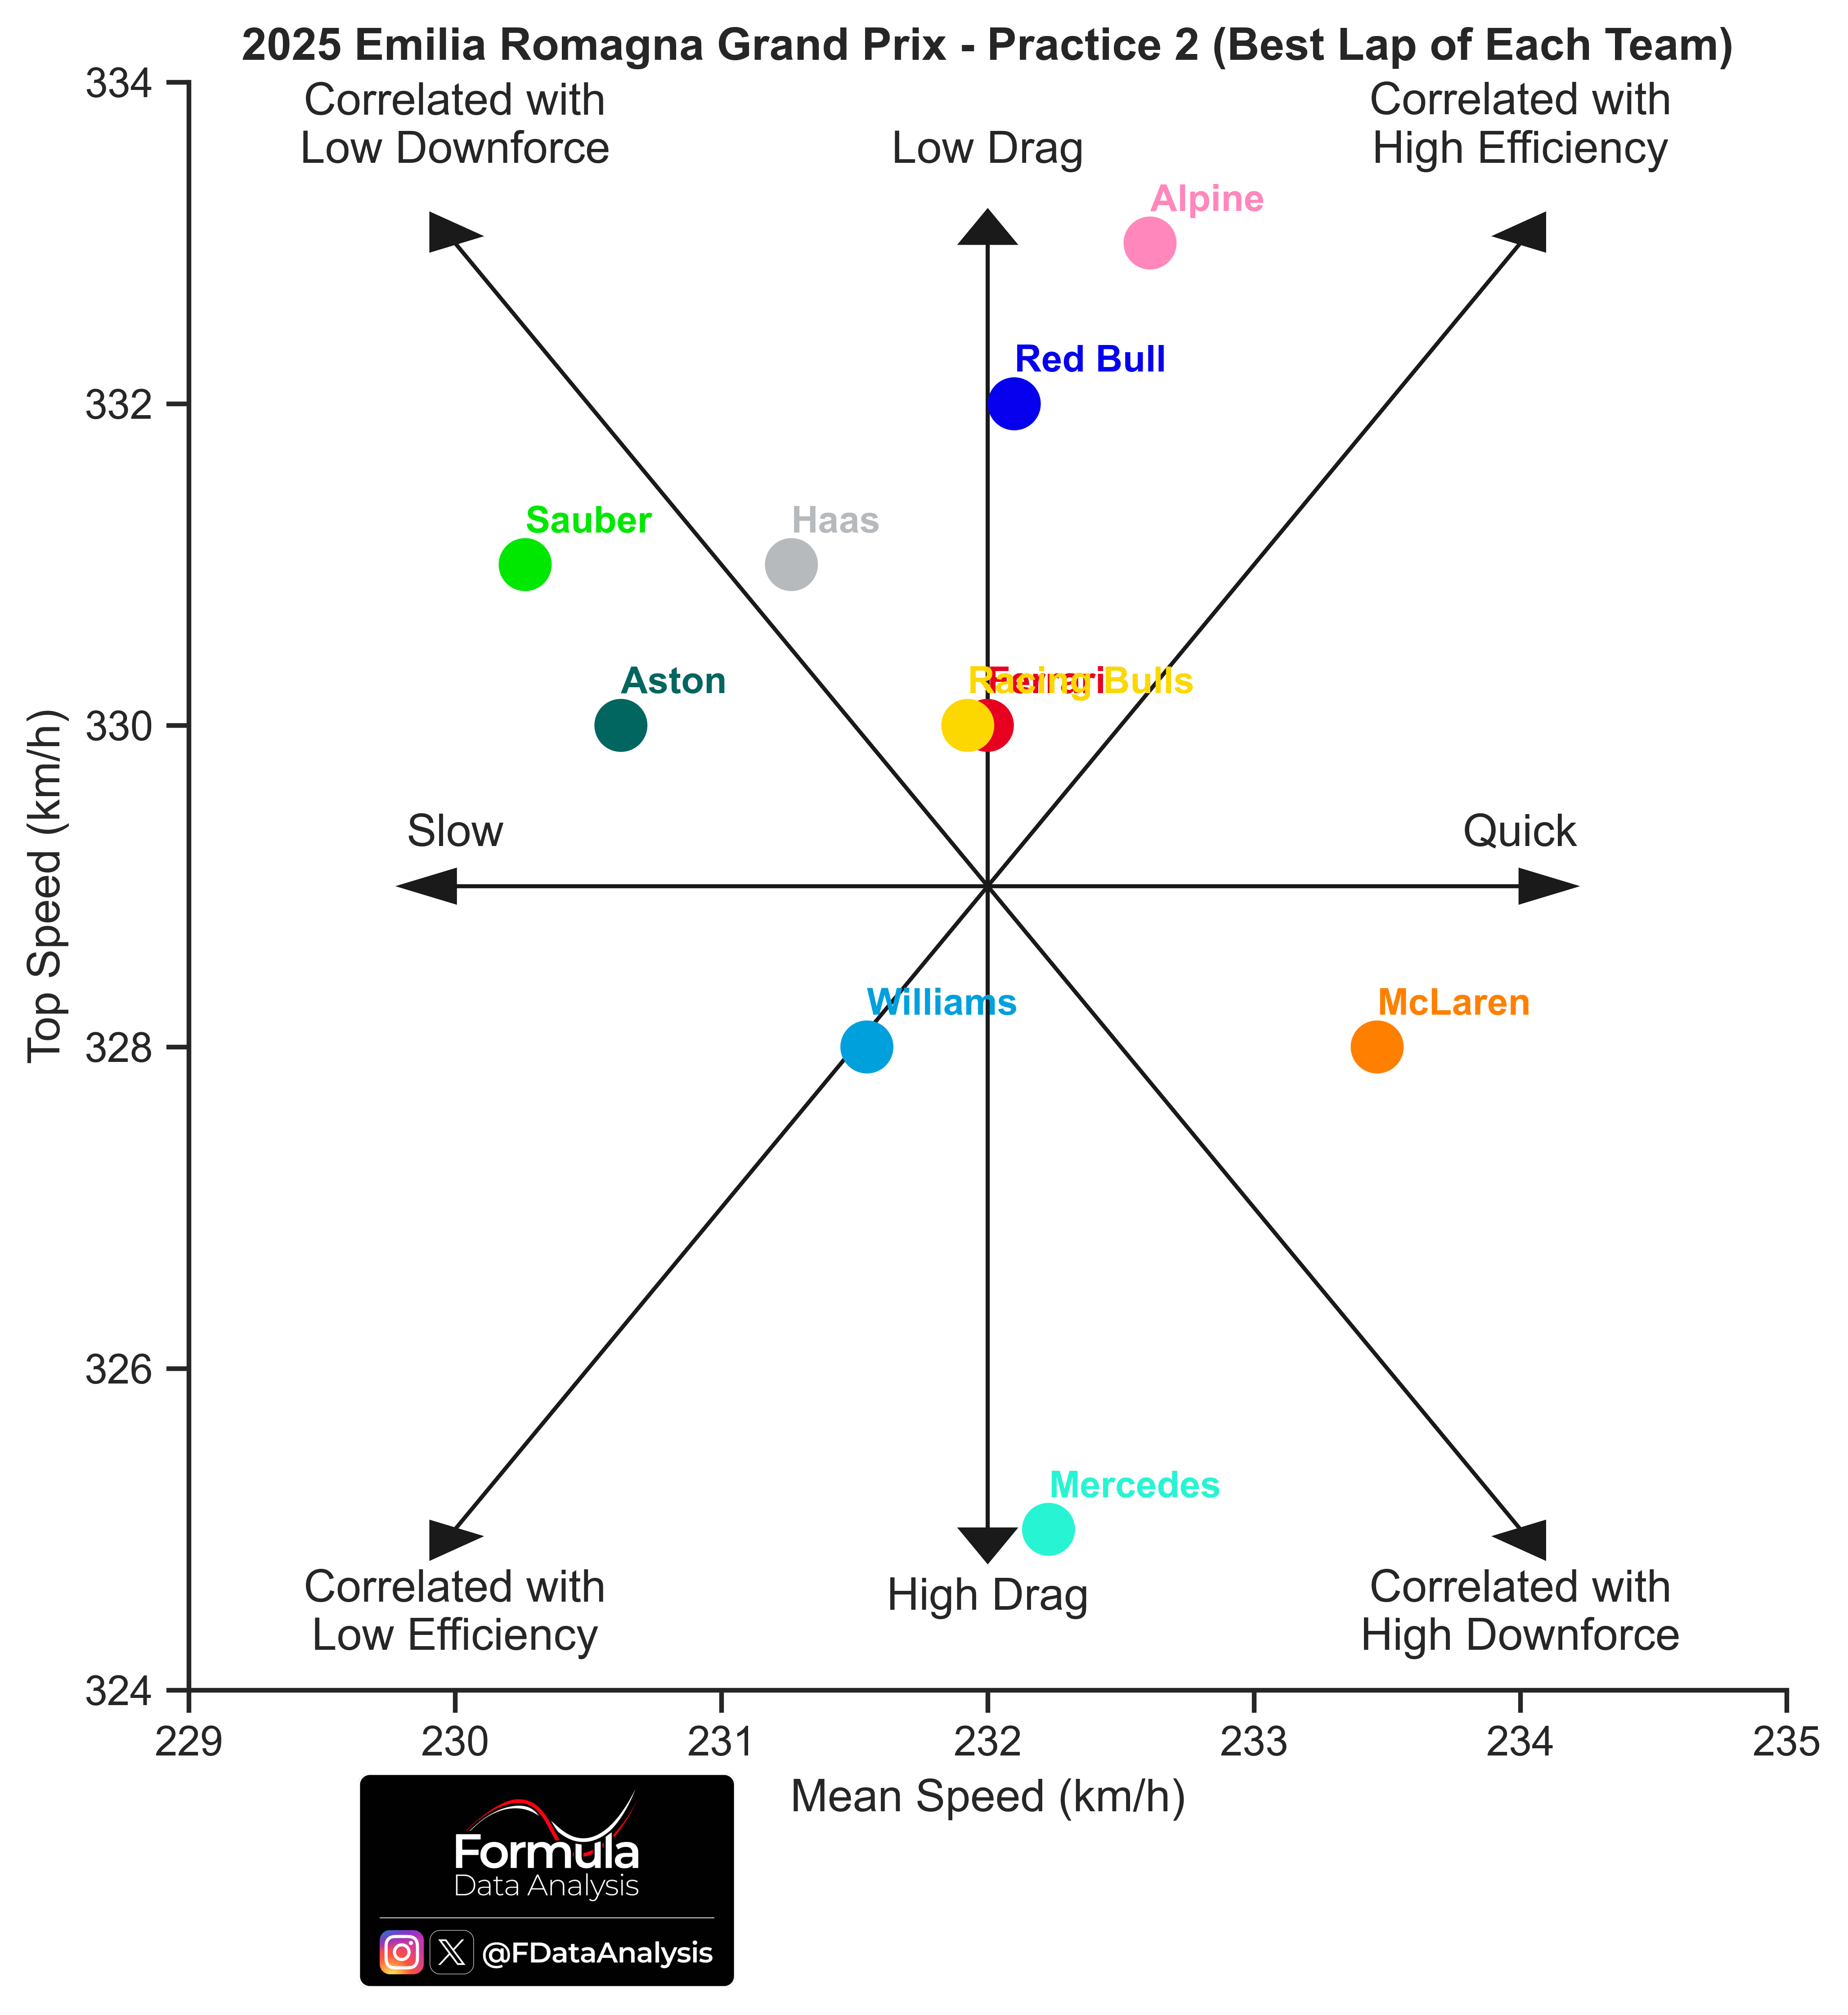
How to read: Average speed on the horizontal axis: the further to the right a team is, the better its performance (the lower the lap time). Top speed on the vertical axis: the higher a team is, the lower that car's drag or the higher that team's engine mode. Therefore, this plot not only shows who was the fastest (those on the right) but also why! (due to very low drag, if they are in the upper portion, or despite that, if they are in the lower portion).
Alpine topped the speed trap, but their performance wasn't due to low drag: they were the team which deployed the most energy in the DRS zone on the main straight. This made GAS gain 0.116s vs PIA on their respective best laps: they two had identical straightline performance until 317km/h, but then GAS further gained 16km/h (just 11km/h for PIA). Still, even taking that into account, alpine's performance seems solid in Imola.
McLaren was quickest, yet their top speed was unimpressive: they gained a lot of time in all the phases except for the straights, where they limited their losses. Mercedes, instead, had a very modest top speed: their performance in the fast corners was excellent, but they might suffer in the race if they don't decide to reduce drag a bit. Yet, RUS' deployment looked very weak, so they could have more pace in hand relative to the others than it looks.
Very solid top speed for RedBull; Ferrari didn't have a particularly impressive top speed (not bad, though), and their laptimes were unimpressive too.
Top Speeds
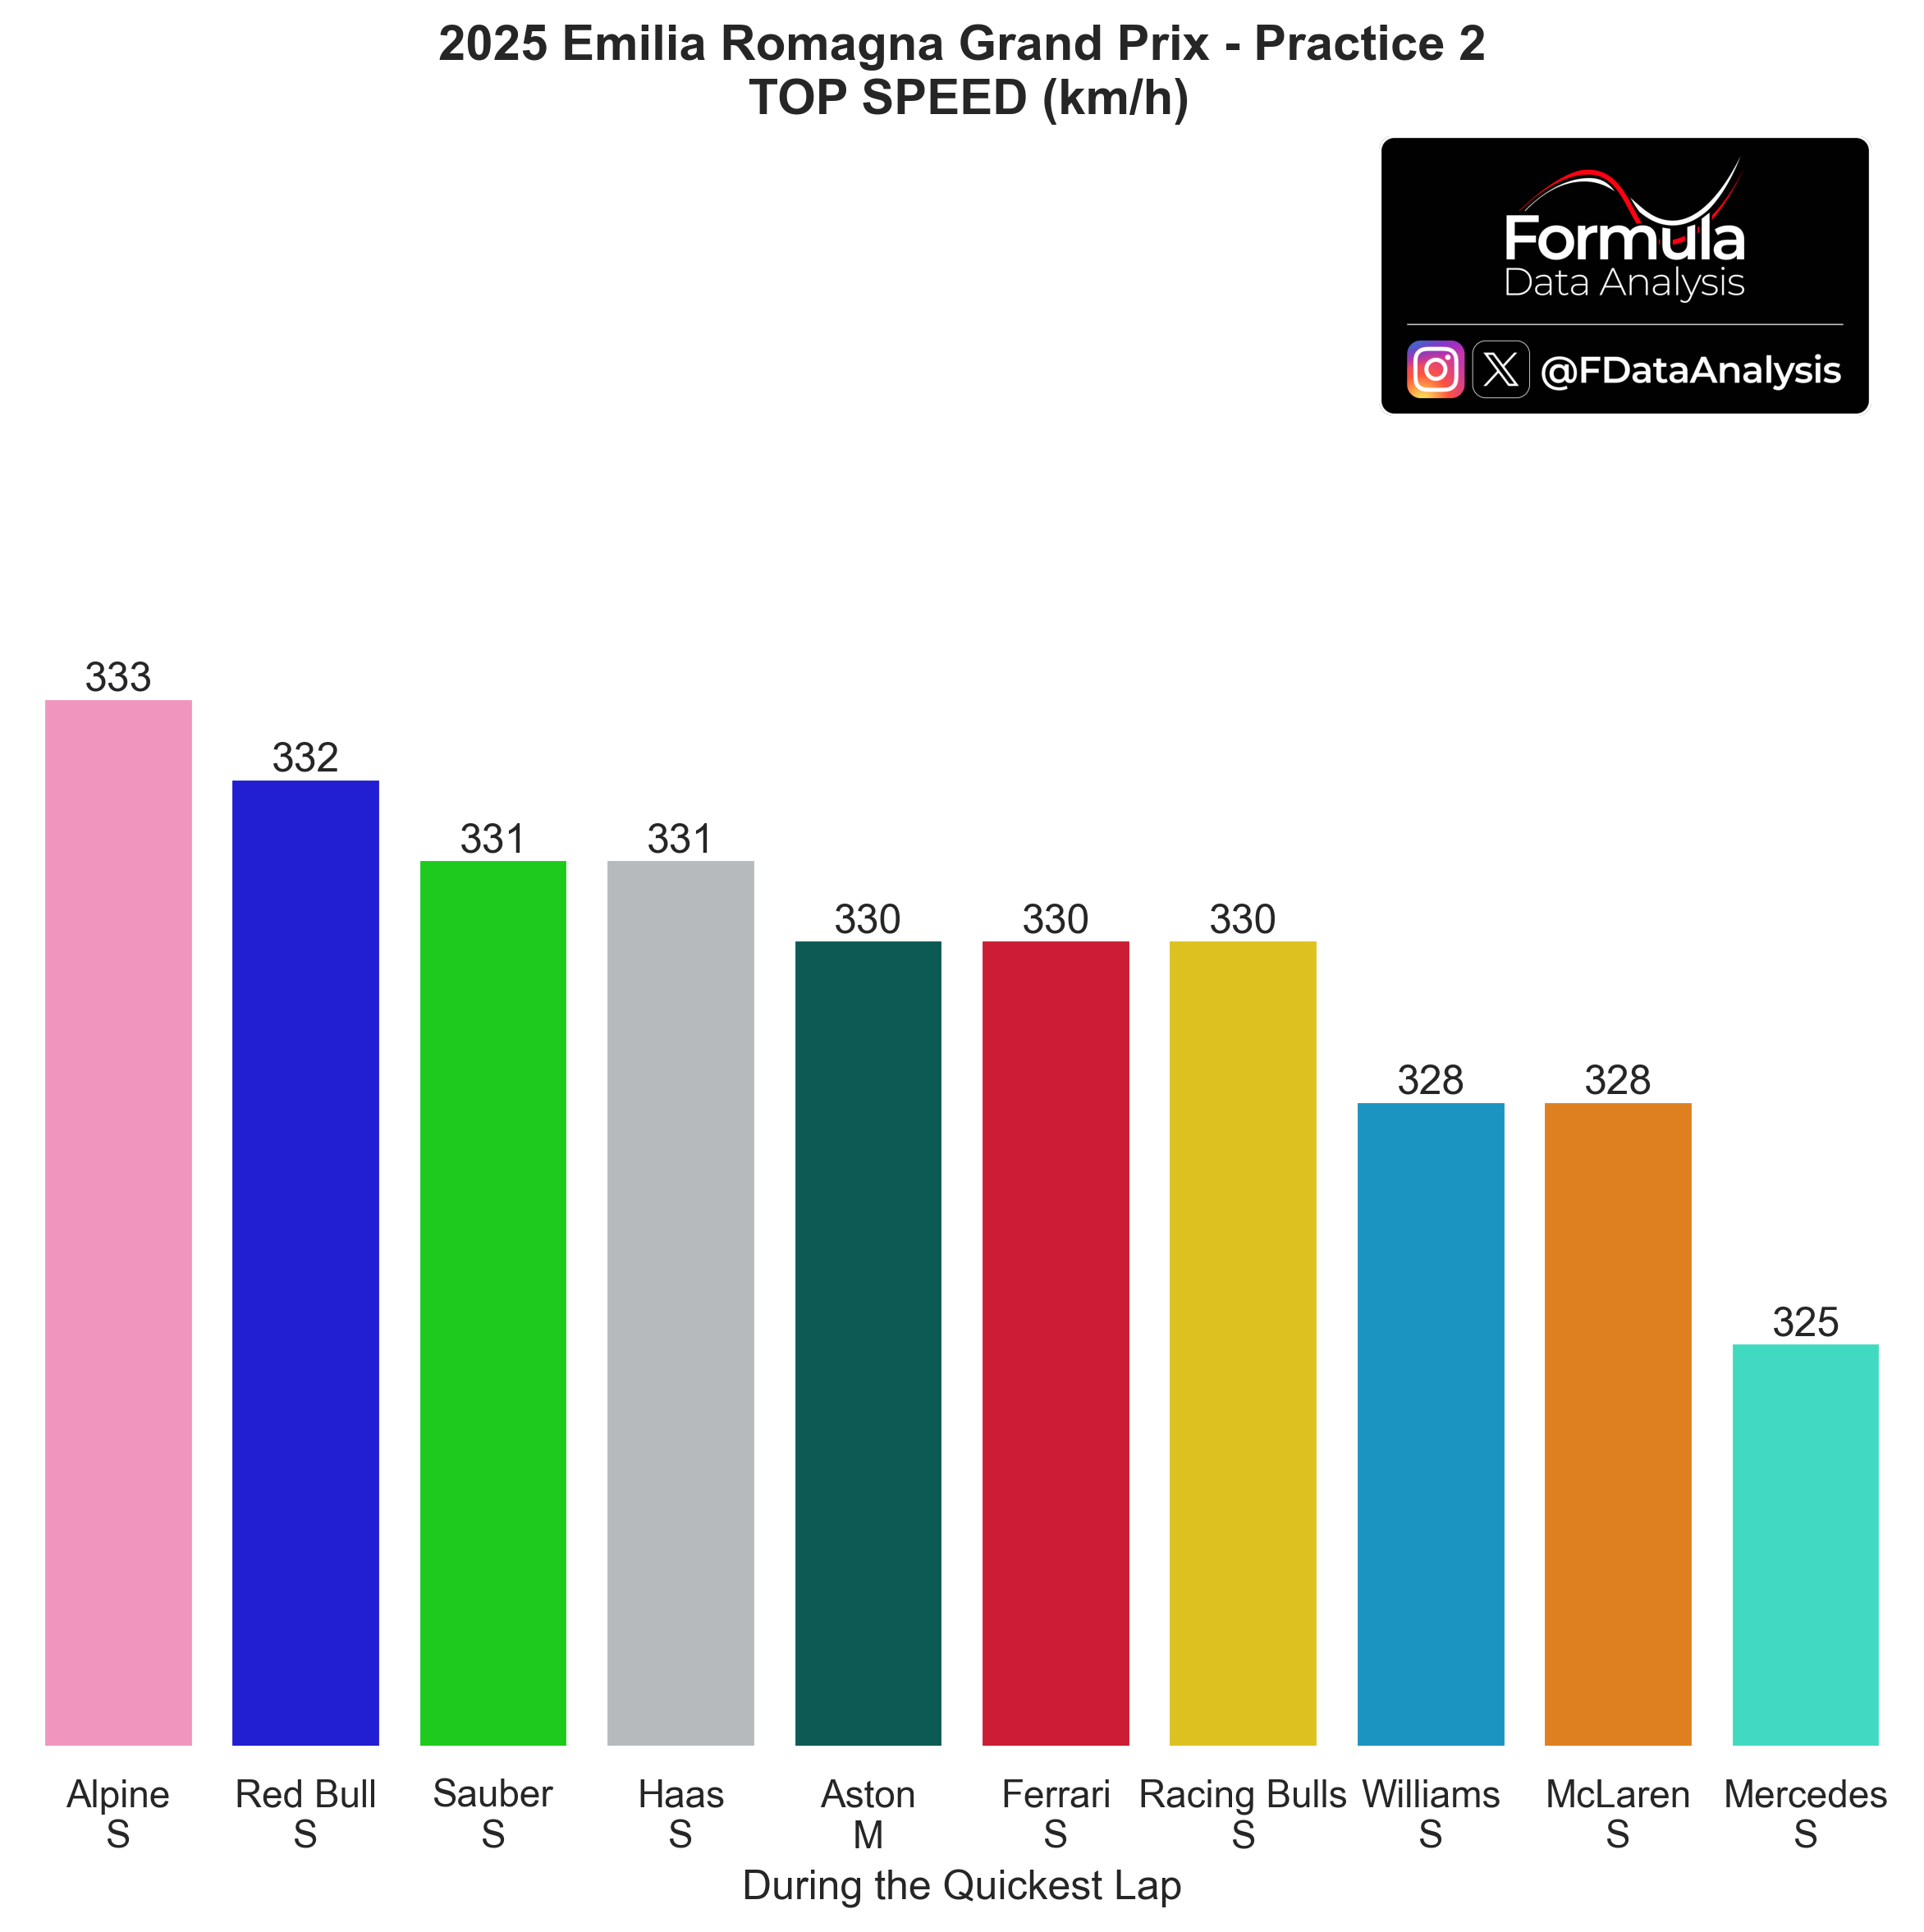
How to read: The higher a team's top speed, the lower that car's drag or the higher that team's engine mode.
8km/h difference across the field: if we take into account the different ERS deployment between Alpine and Mercedes, the gap looks narrower.
Same chart, per driver:
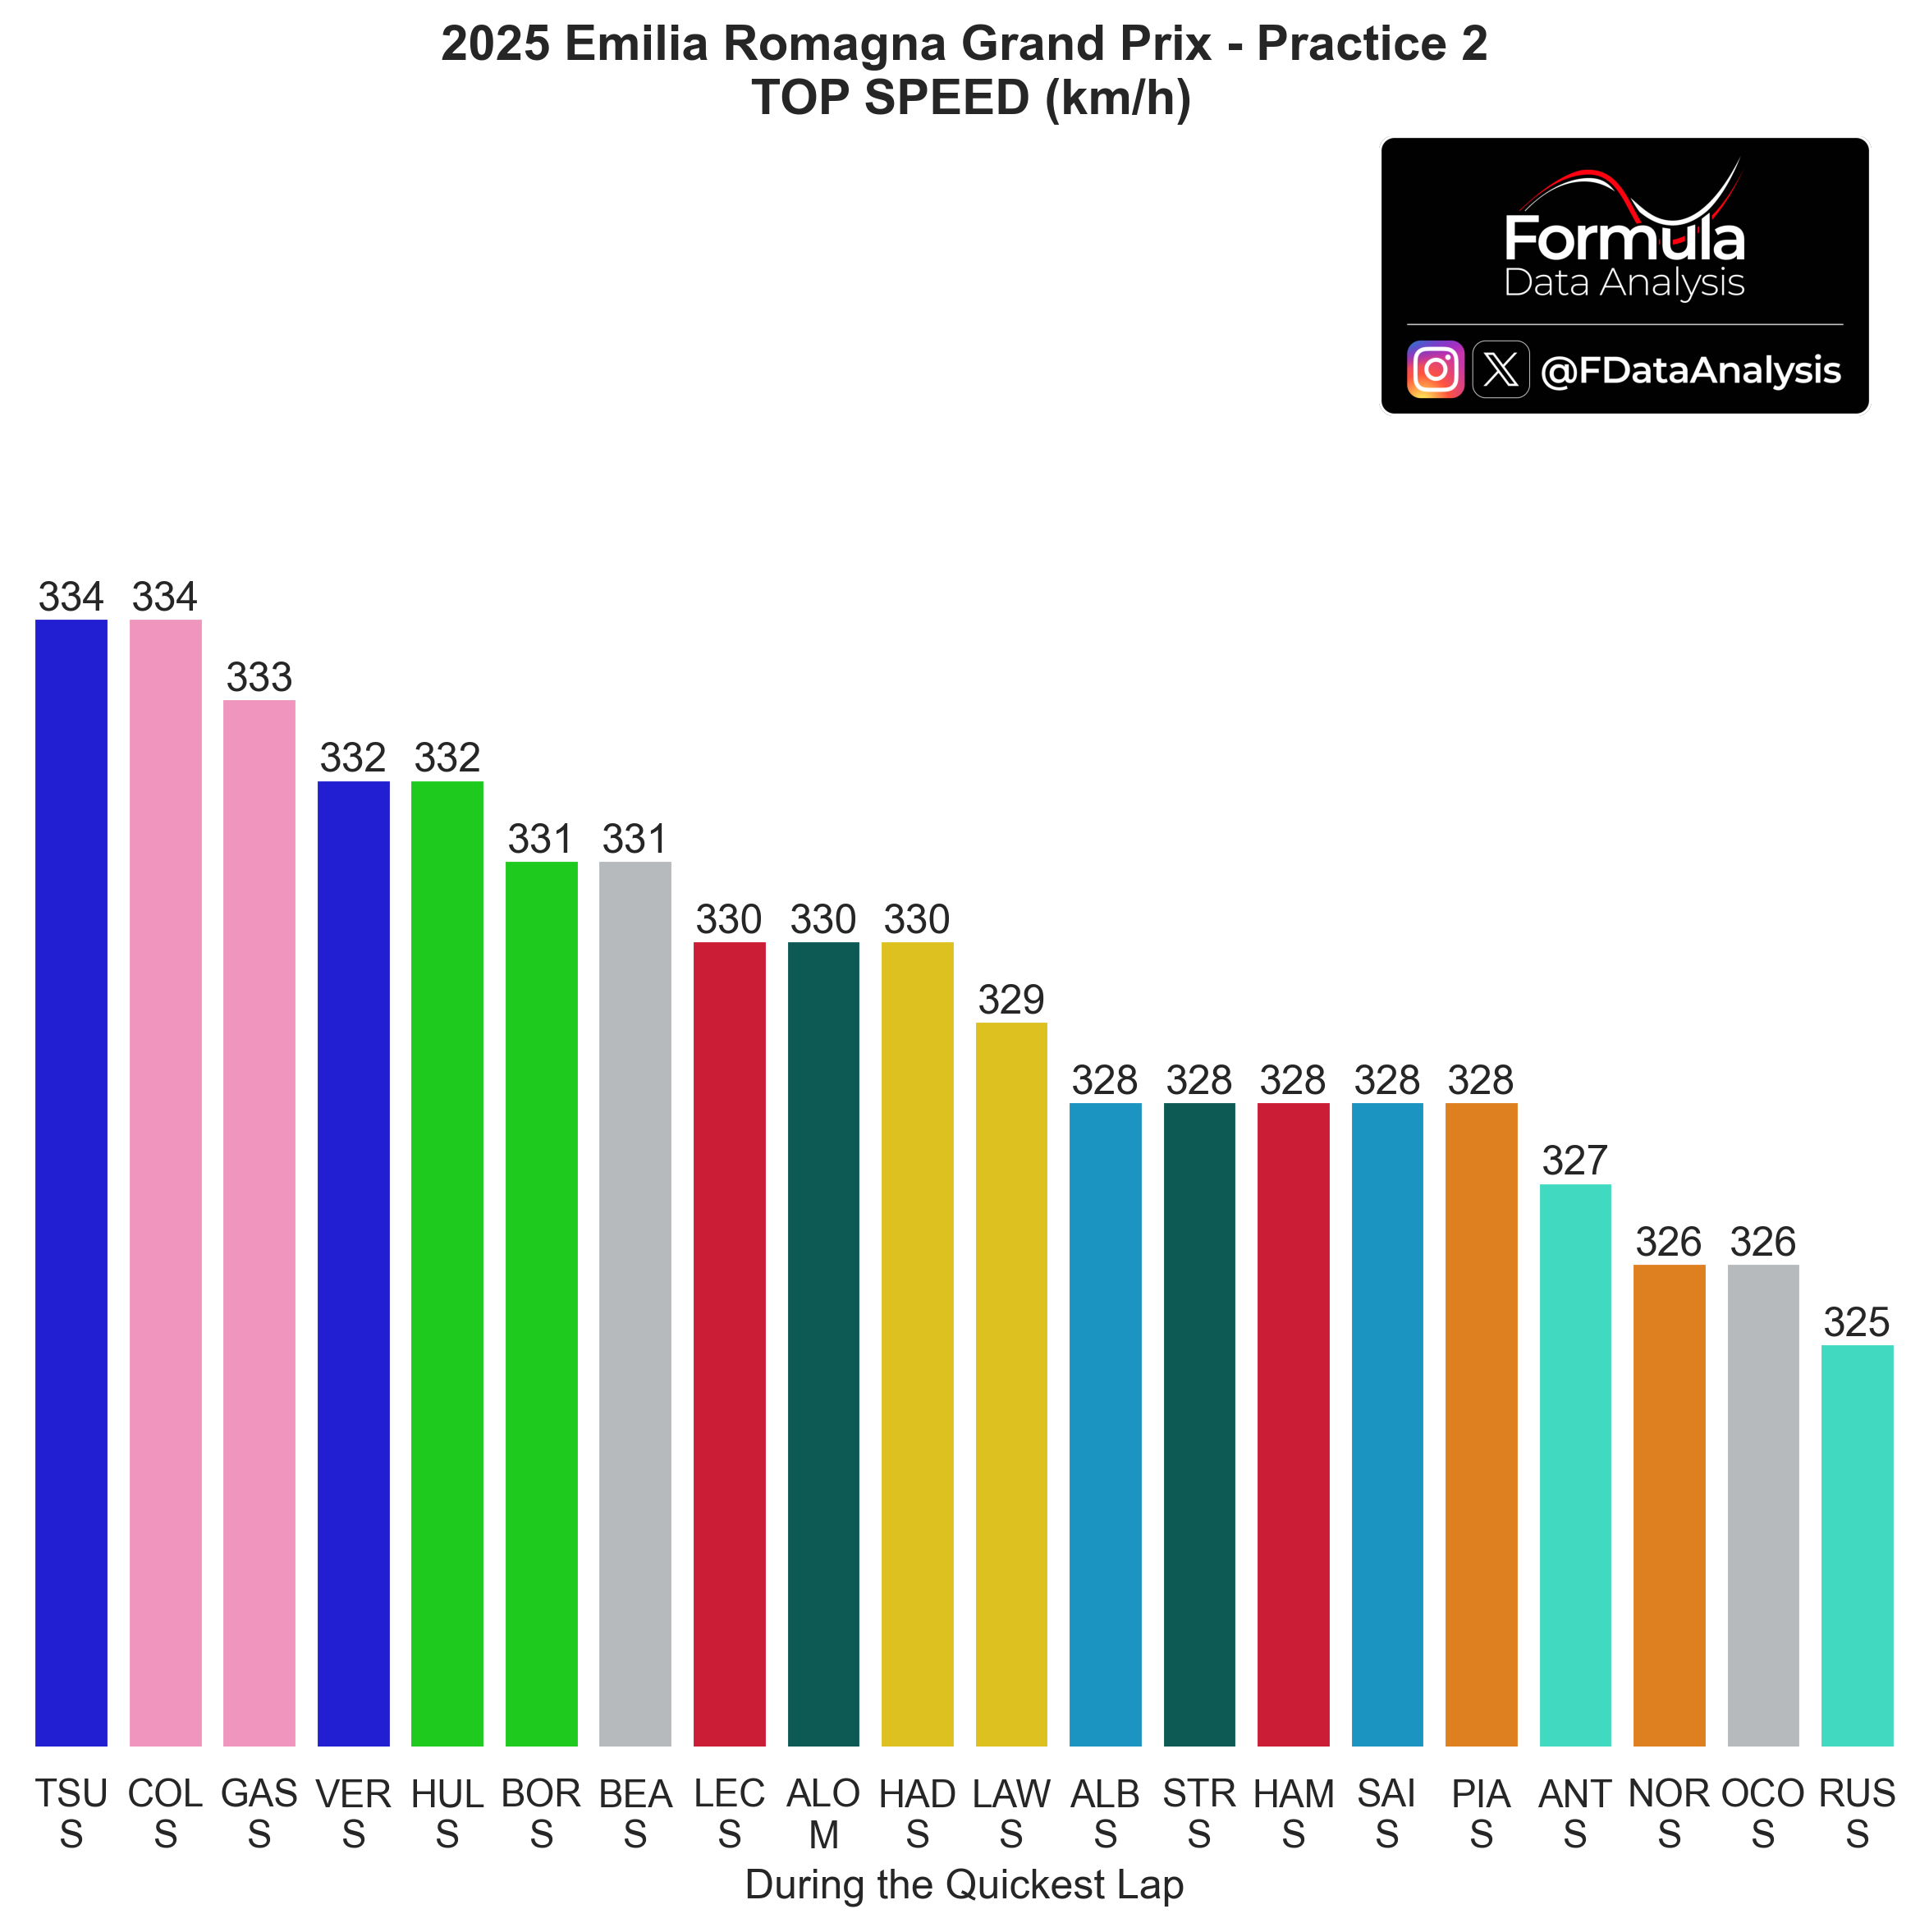
BEA had a 5km/h higher top speed than OCO. Apart from that, no team had a top speed difference among their 2 drivers larger than 2km/h (no diversified aero setups)
RBR's update was aimed at reducing drag; their top speed so far has been excellent.
Best Sectors
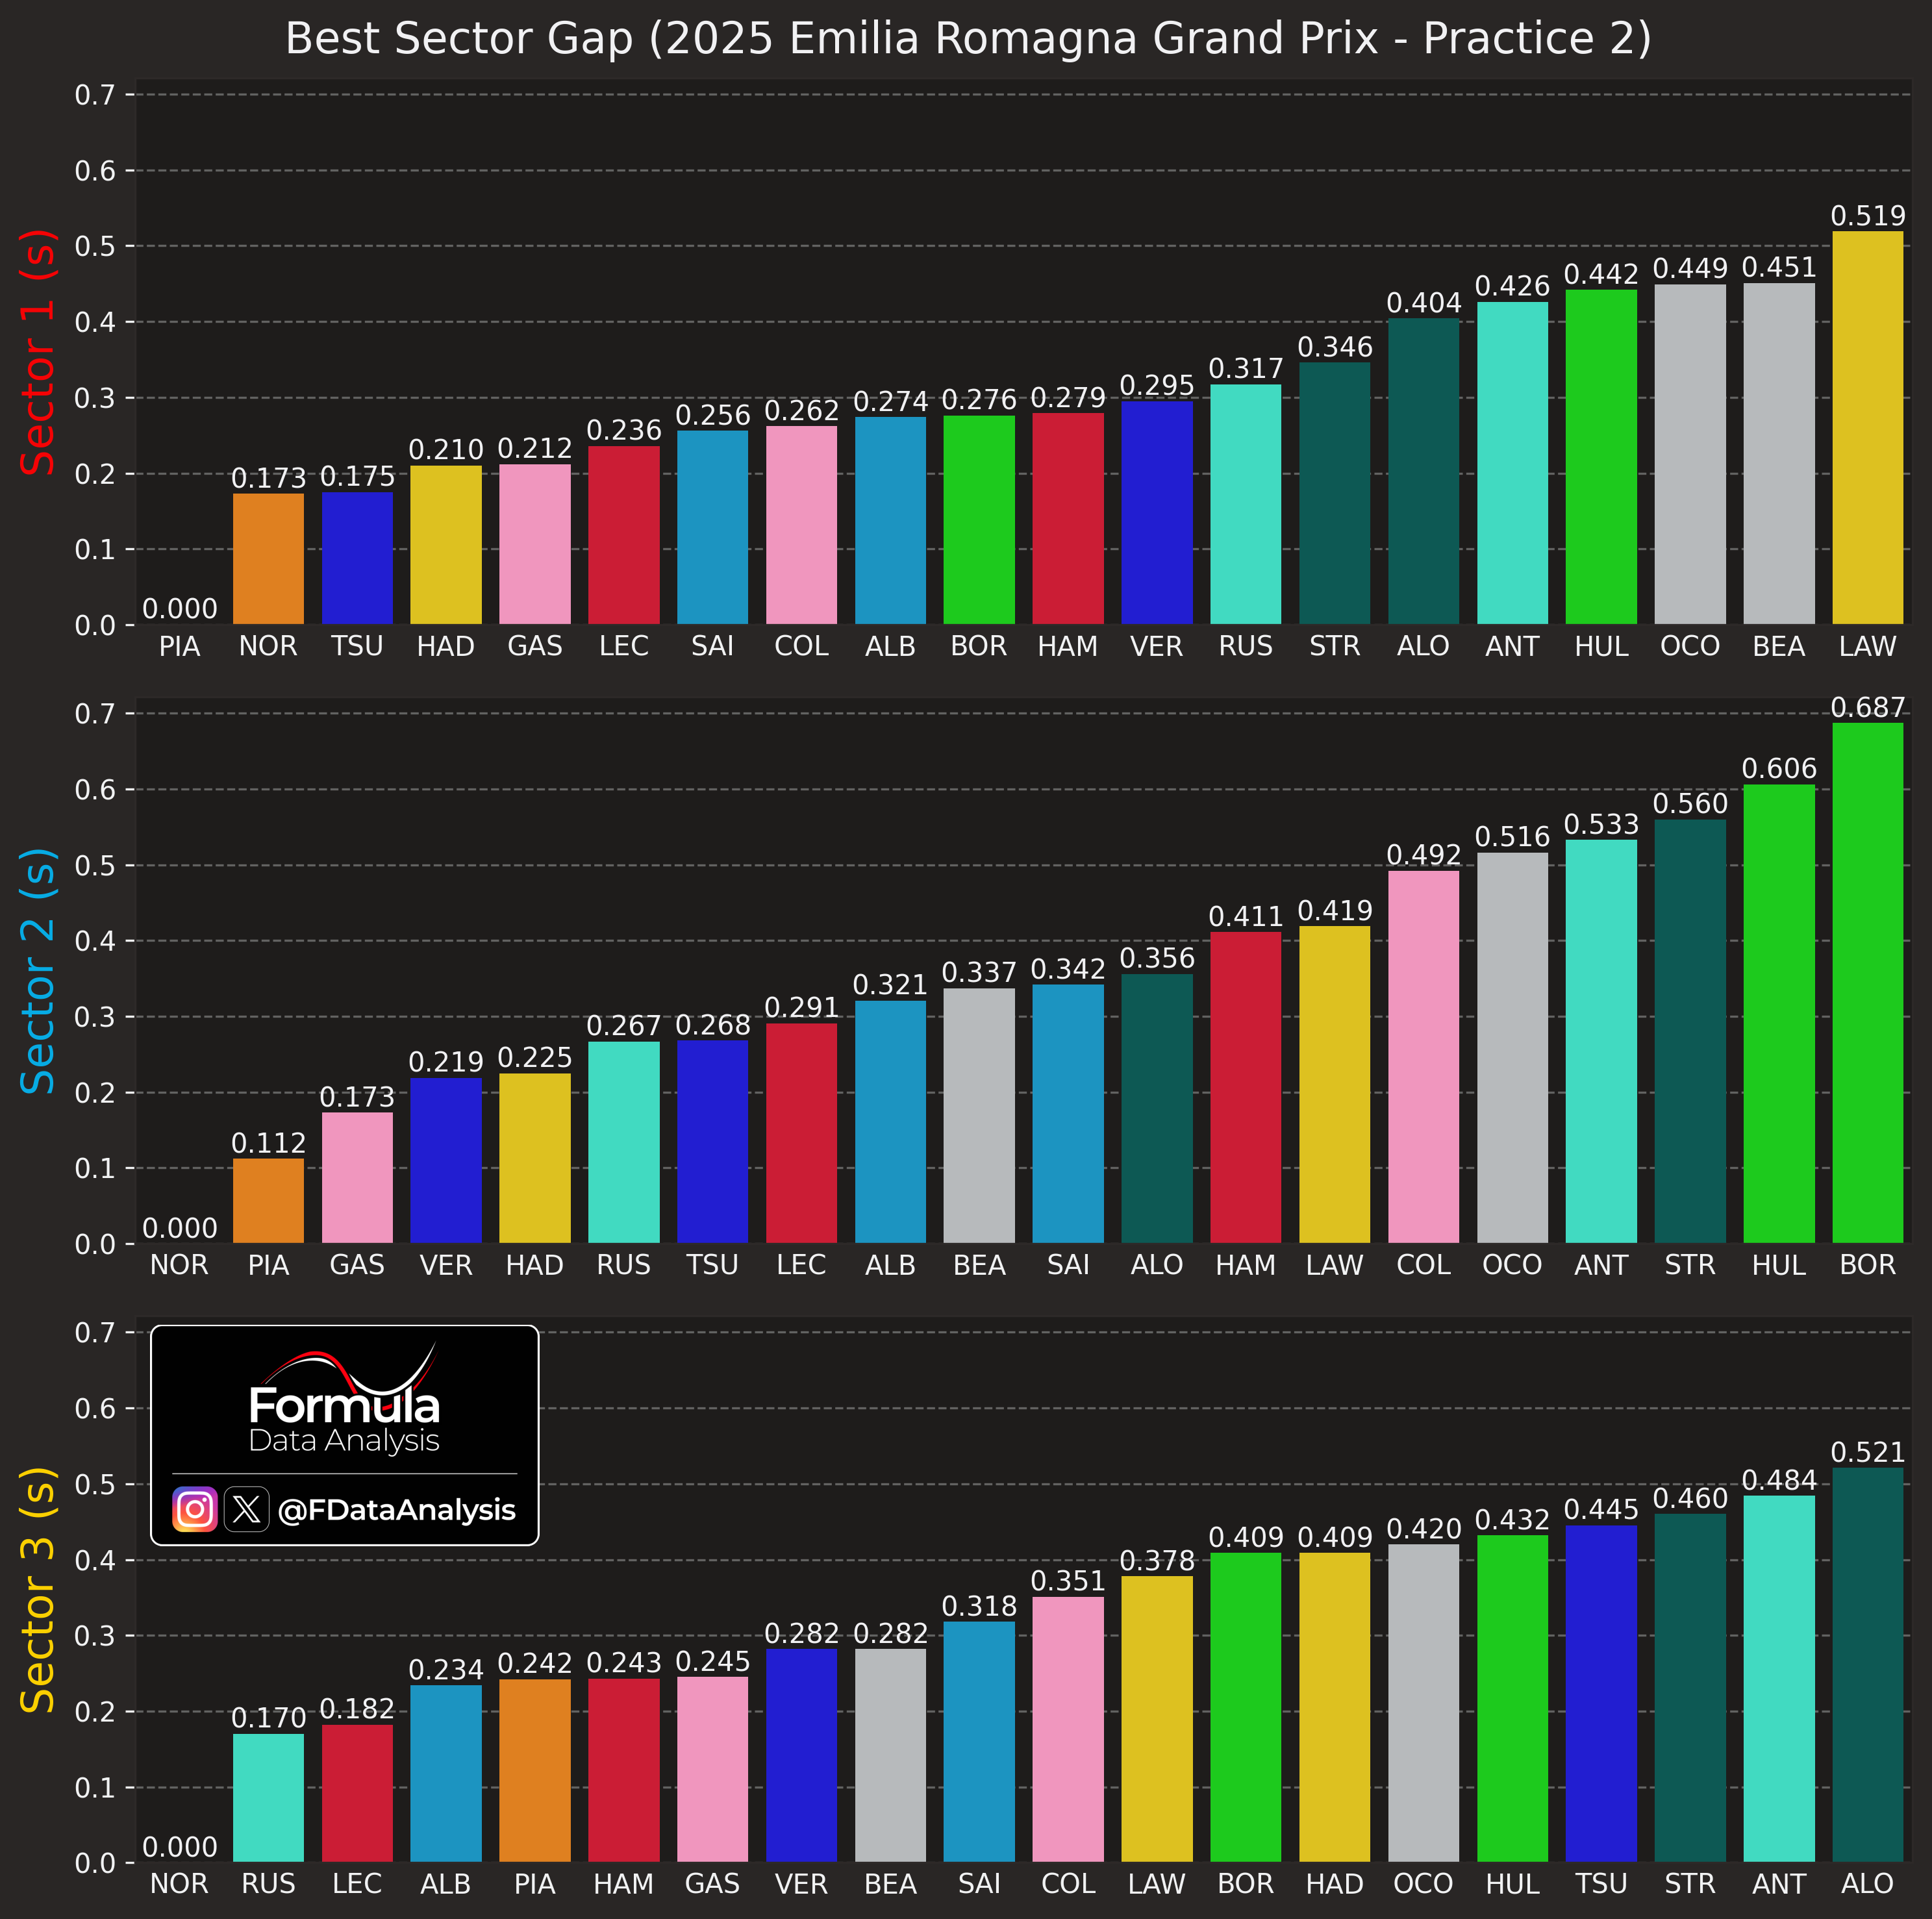
A summary to remind you of the properties of each one:
Sector 1: Two straights connected by a chicane (T2-3), and followed by another one (T5-6). The first, longer straight is a DRS zone (and the main overtaking spot on the track)
Sector 2: A demanding section consisting of a hairpin and several medium-speed corners with significant changes in slope. The slow T12 leads to a short straight.
Sector 3: A slow chicane which leads to a straight. The lap ends with 2 left-hand, 90-degree corners.
Best vs Ideal Lap
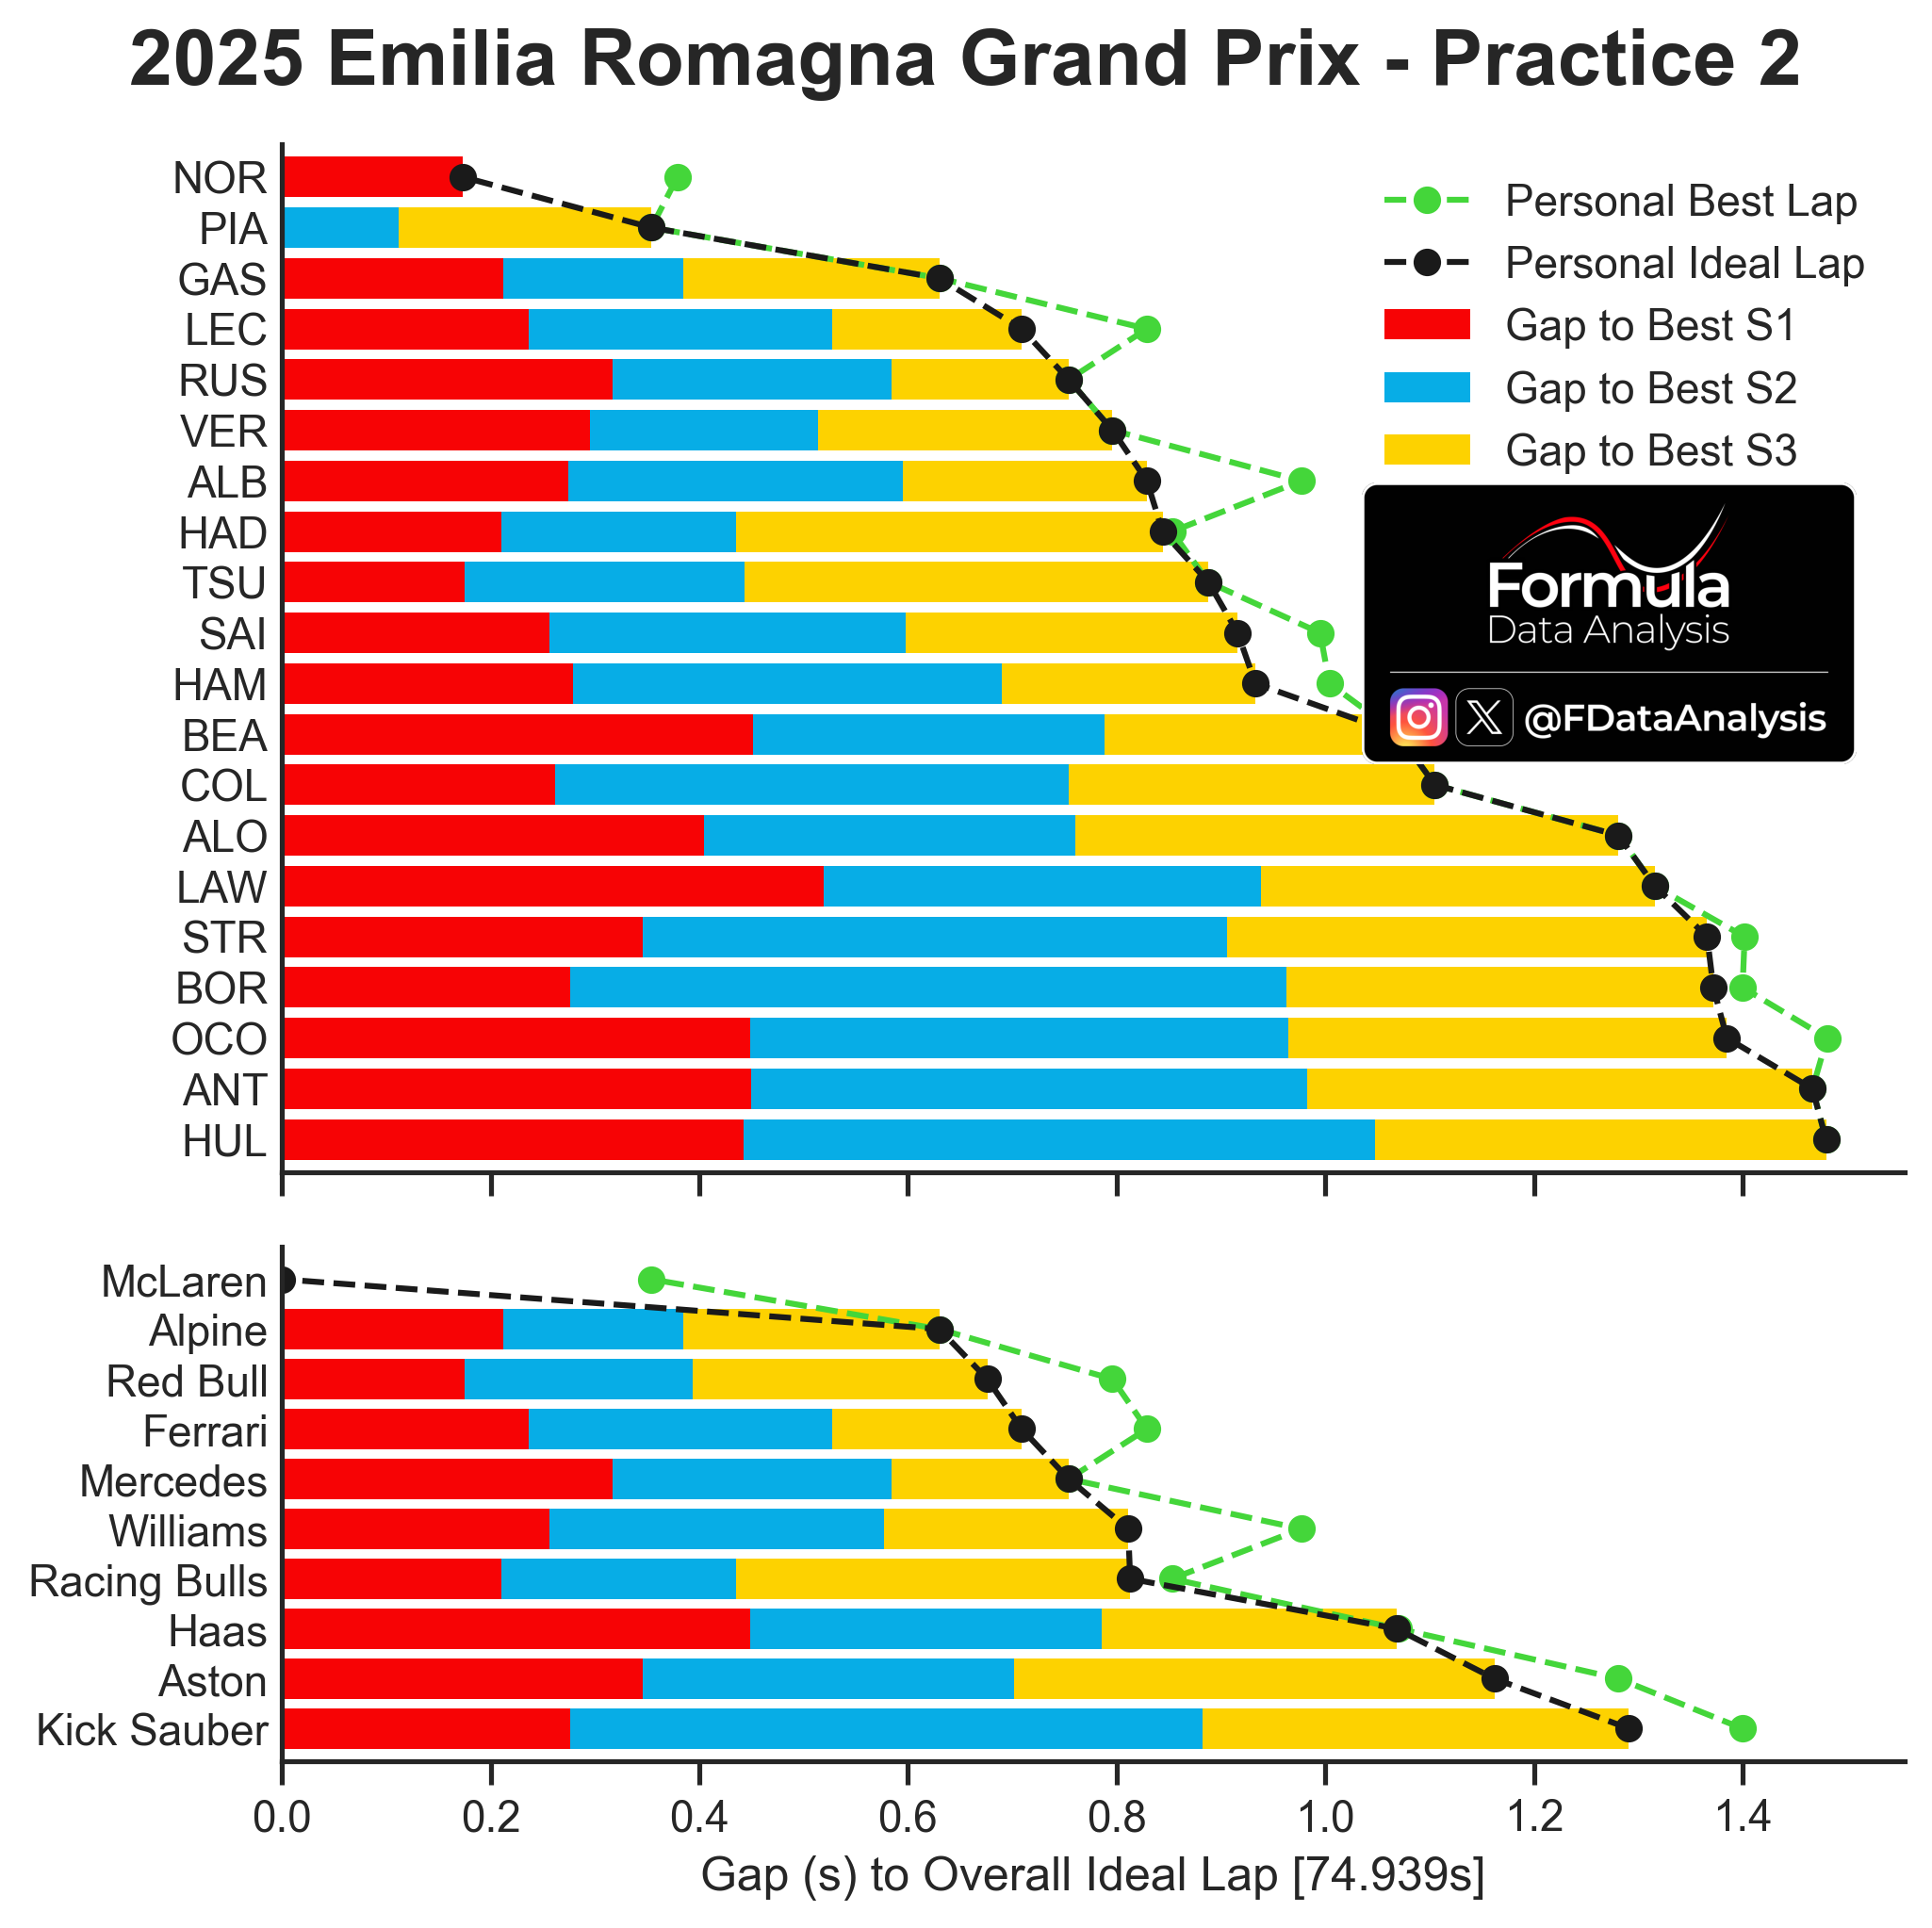
How to read: The graph shows, for each driver and each car, the ‘Personal Ideal Lap’ (the lap time obtained by the sum of that driver’s or team’s best 3 sectors, which might have been achieved in different laps) in black, and the ‘Personal Best Lap’ (the best lap time that the driver or team has effectively achieved in the session) in green. Consequently, the Personal Ideal Laptime is always equal to or lower than the Personal Best Laptime. If the two coincide, it means that the driver or team has produced its best sector times all on the same lap. The farther the Personal Best Laptime is from the Personal Ideal Laptime, the more potential lap time that one driver or team has left on the table. The coloured bars indicate the gap to the absolute best sector time. The ‘Overall Ideal Lap’ is shown at the bottom of the figure and is the sum of the lap times of the overall best sectors, independent of which driver or car achieved them.
McLaren's final gap to Alpine was 0.276s, but the difference between the two teams' ideal laptimes was well over 6 tenths!
The ideal lap is computed as the combination of the best sectors made by each team: the telemetry shows that PIA and NOR had very similar setups, so it's not like one of the two was quick on the straights and the other in the corners. So this ideal lap (1:14.939, just 0.193s slower than last year's pole) could have been achieved in FP2!
A very large gap, but teams like RBR have often reduced their gap to McL from FP2 to quali: McL looks favourite, but the outcome can still be changed!
Throttle use
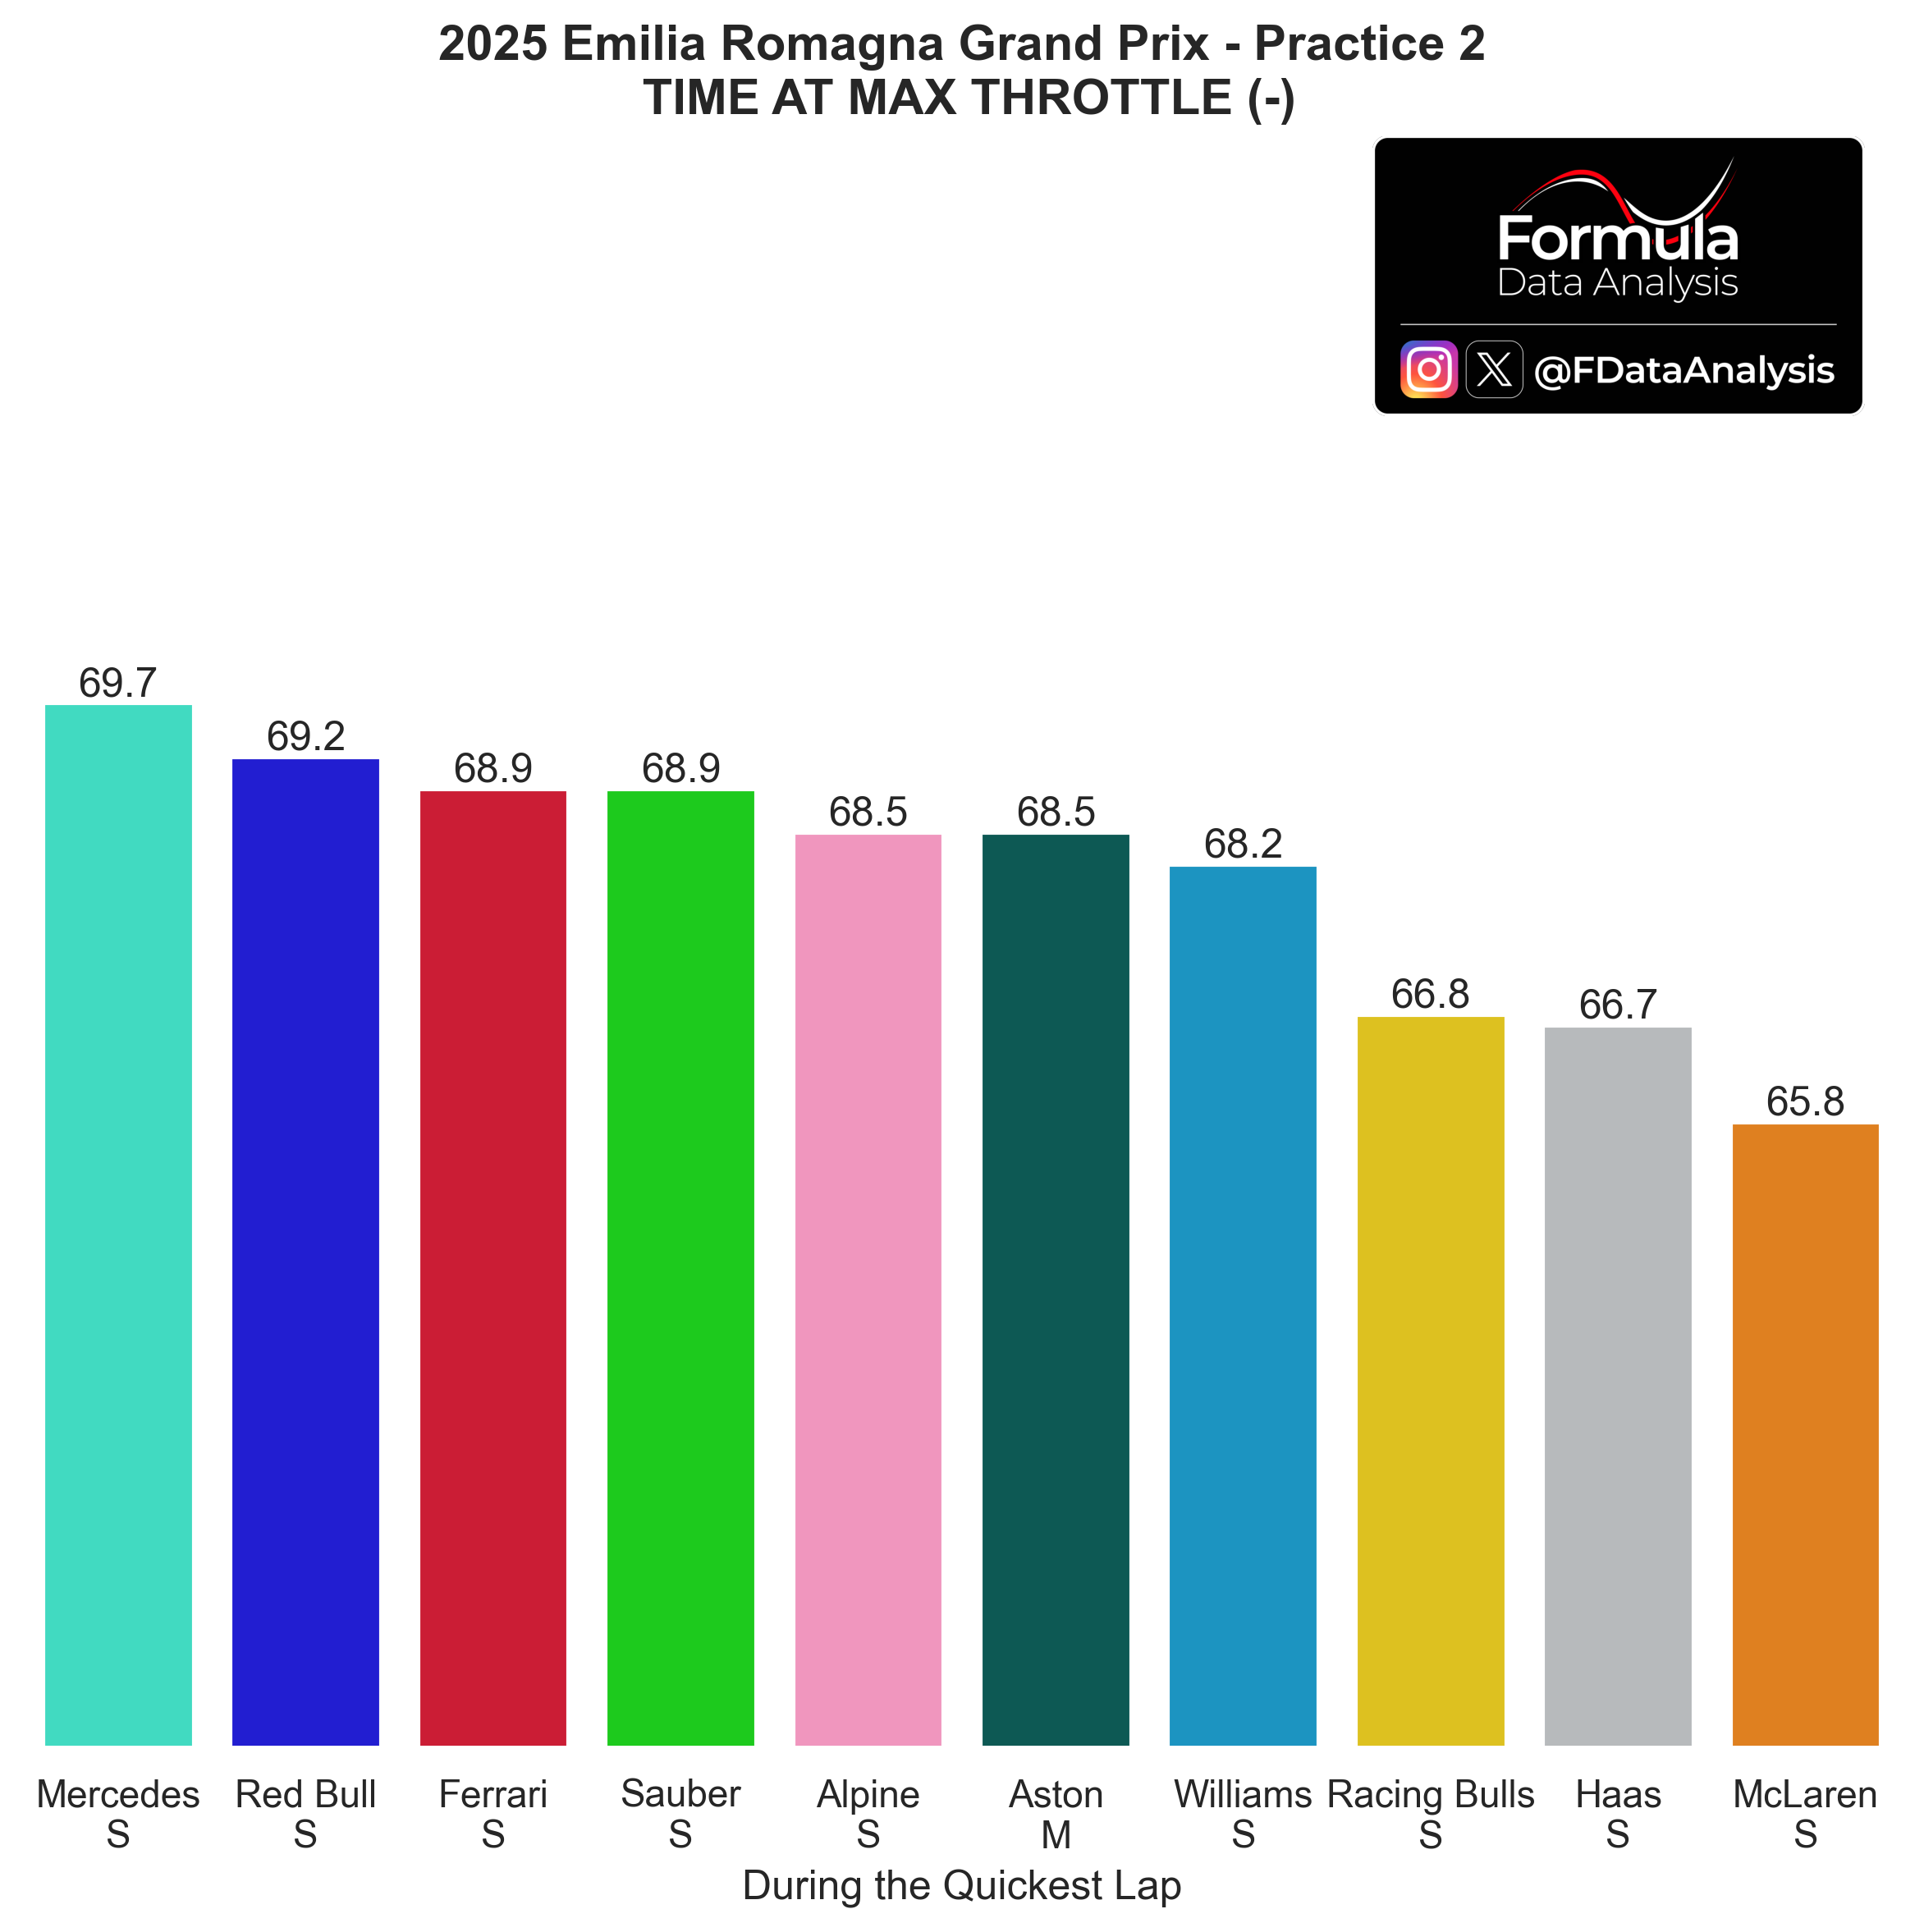
How to read: The graph shows the percentage of the time the driver spent at full throttle. Spending more time at full throttle is correlated with a weaker Power Unit mode, more drag, less fuel, and better grip (especially concerning traction out of the corners). This analysis is used together with the lap time produced by each driver and the corresponding top speed achieved to pinpoint which teams could be on a lower engine mode. For example, if a team produced a lap time worse than usual, but they are topping the charts concerning throttle usage, it's pretty likely that they were running a more conservative engine mode. Looking at the top speed achieved could confirm it.
McLaren set the fastest laptime of the session, yet in that lap, the driver (PIA) remained full-throttle for the least time!
Check out the next image for a clearer picture of each driver:
PIA's lap seems to be an outlier: it seems that he spent a bit of time between lifting the throttle and braking, which decreased this metric significantly at the cost of very little laptime.
Instead, RUS' situation is clear: his ERS deployment was very modest, so he could use the smaller power he had more often. I expect Mercedes to be a serious threat come quali, but McL still looks favourite.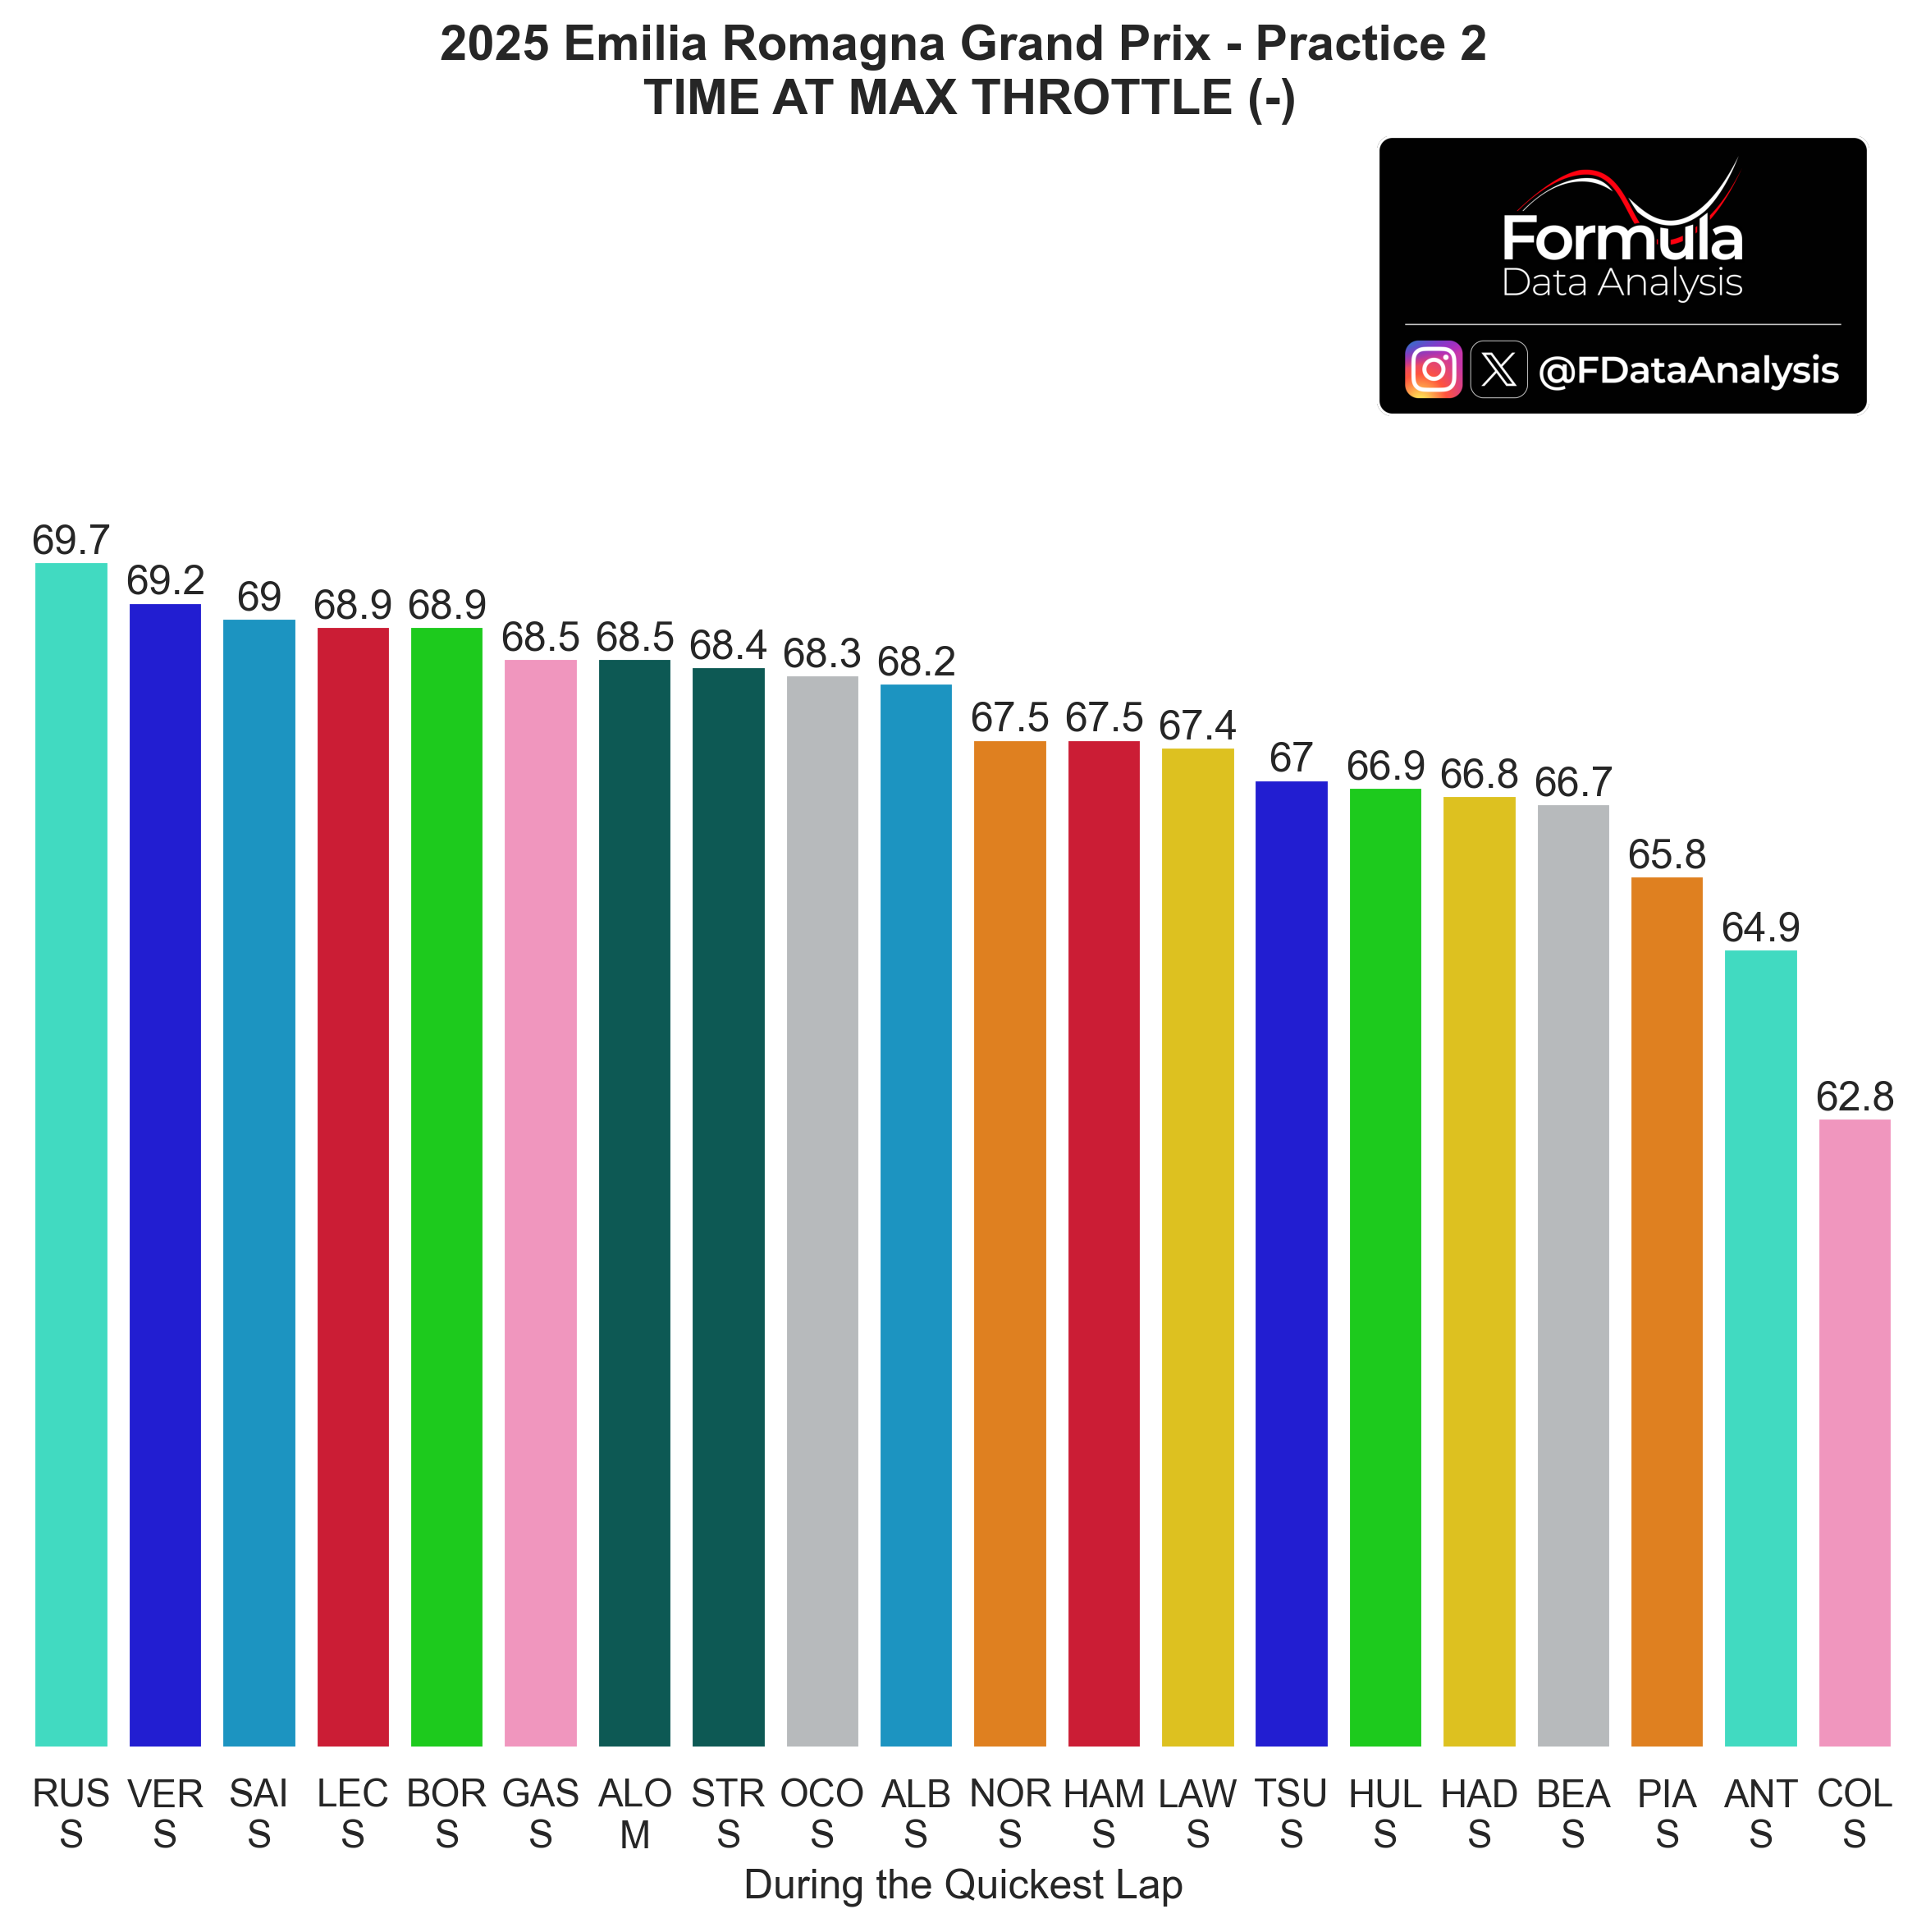
Race Pace
Long Runs


How to read: The chart shows the distribution of lap times during each team's long runs. A long run only includes segments of at least 5 consecutive laps run on the same compound without pitting or slowing down.
Top 5 Teams based on WCC (You will find all the data at the bottom of the plot)
LEC was just marginally slower than NOR and ahead of PIA: the 3 drivers were so close that other factors (fuel load, PU modes etc) matter far more than this tiny difference. ANT was 4th quickest, in front of SAI.
If we manually remove HAM's and VER's slow laps, we see that their pace was competitive: HAM would have been as quick as ANT, and VER about as quick as SAI. Note that RBR is normally extremely slow in the FP2 long runs (as they carry a lot of fuel and use very low power modes), so VER's and TSU's long runs look encouraging.
Bottom 5 teams, based on WCC:
HAD was very quick AND consistent: his pace was as quick as SAI's on average, but his consistency suggests that he had a bit more time in the pocket. GAS was pretty competitive, but less so than in quali.
Overview of all teams: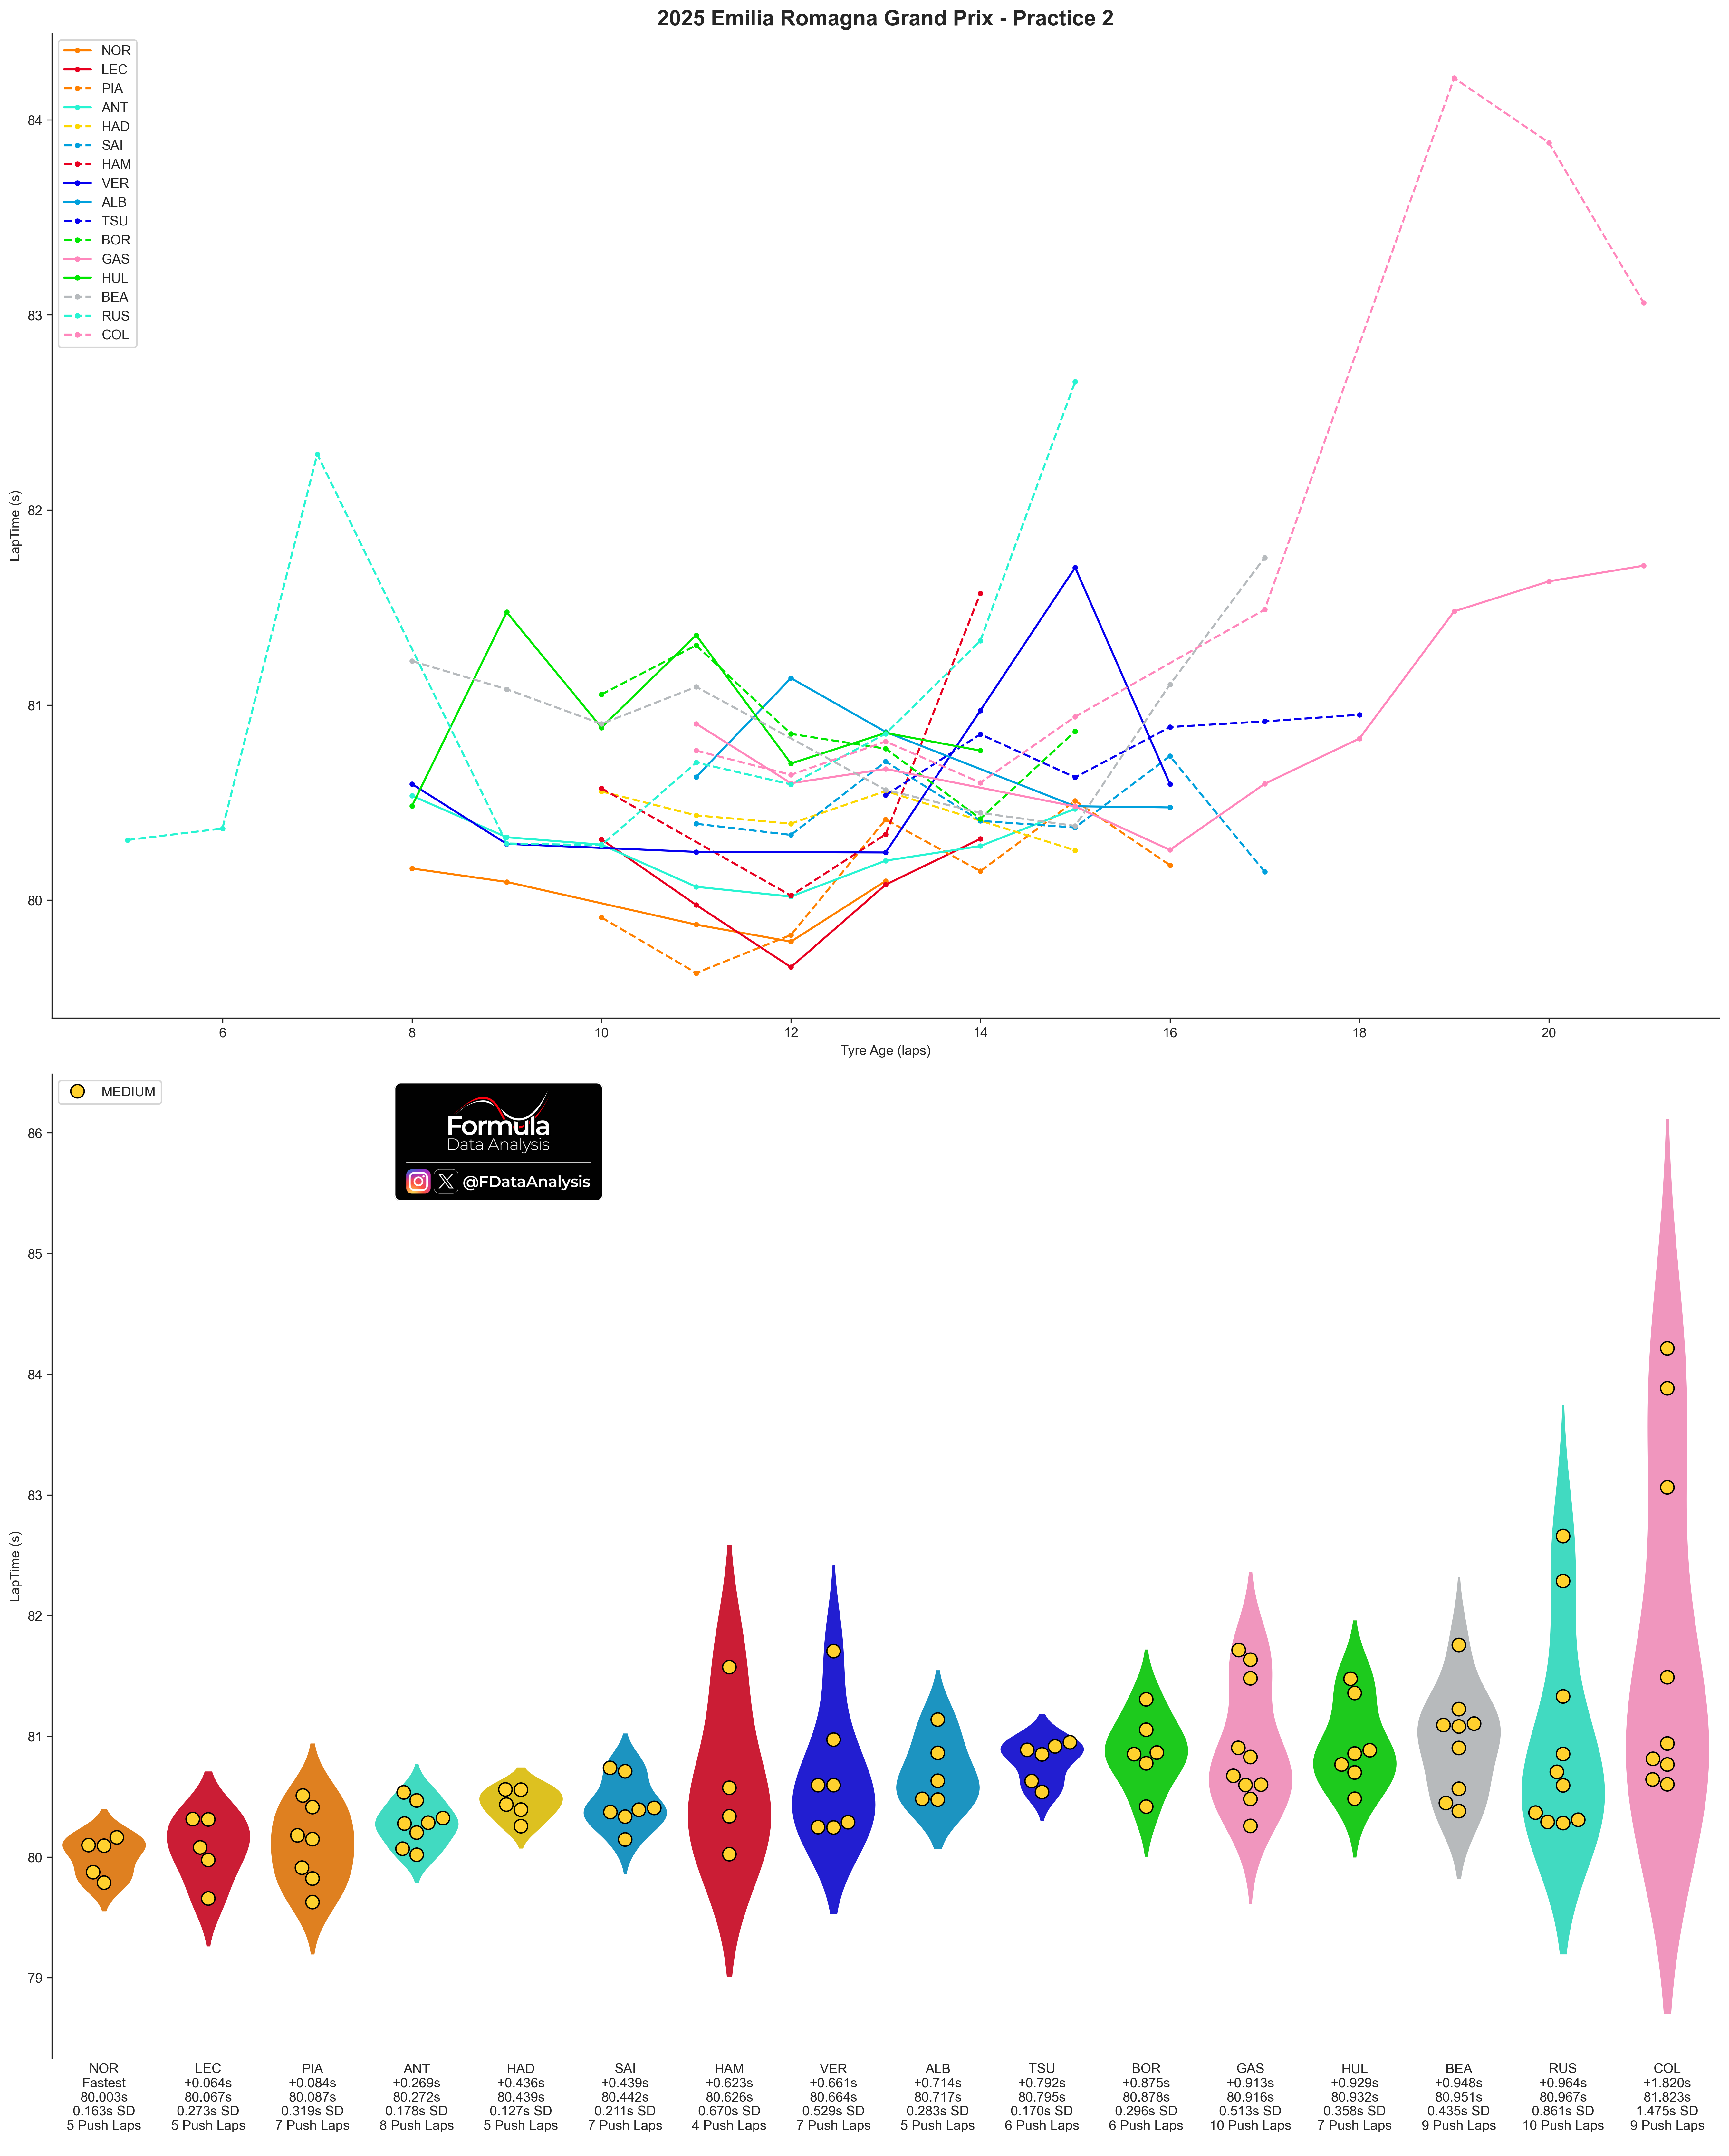
Pace Last Year
How to read: The upper plot shows the synthesis of each driver's pace during the race. The lower plot shows the (smoothed) evolution through the laps. Each bar contains the central 50% of the distribution: the shorter it is, the more consistent the pace. Inside it, the solid line indicates the MEDIAN (how quick was the TYPICAL lap), while the dashed line indicates the MEAN (how quick was a lap ON AVERAGE). The whiskers include all the laps from a driver which are not uncharacteristically slow for that driver: the lower whisker, in particular, shows that driver's quickest lap. The mean lap time is indicated below each driver's name, and below that is the gap to the quickest driver. The bottom line indicates the tyres used.
Three different cars (McL, RBR, Ferrari) were within 0.1s of each other! There was no tangible difference between Norris and Verstappen's pace ON AVERAGE, but the difference did indeed exist in different segments of the race! Check the lower plot (smoothed pace): NOR was significantly slower than VER in the first 20 laps, and significantly quicker in the last 20!
Ferrari brought updates to Imola last year, and their pace was strong in part due to that (but they were quick in the previous race too - Miami)
Alonso's race must have been a nightmare: he was over 1.4s/lap slower than the leader despite using 4 tyre sets...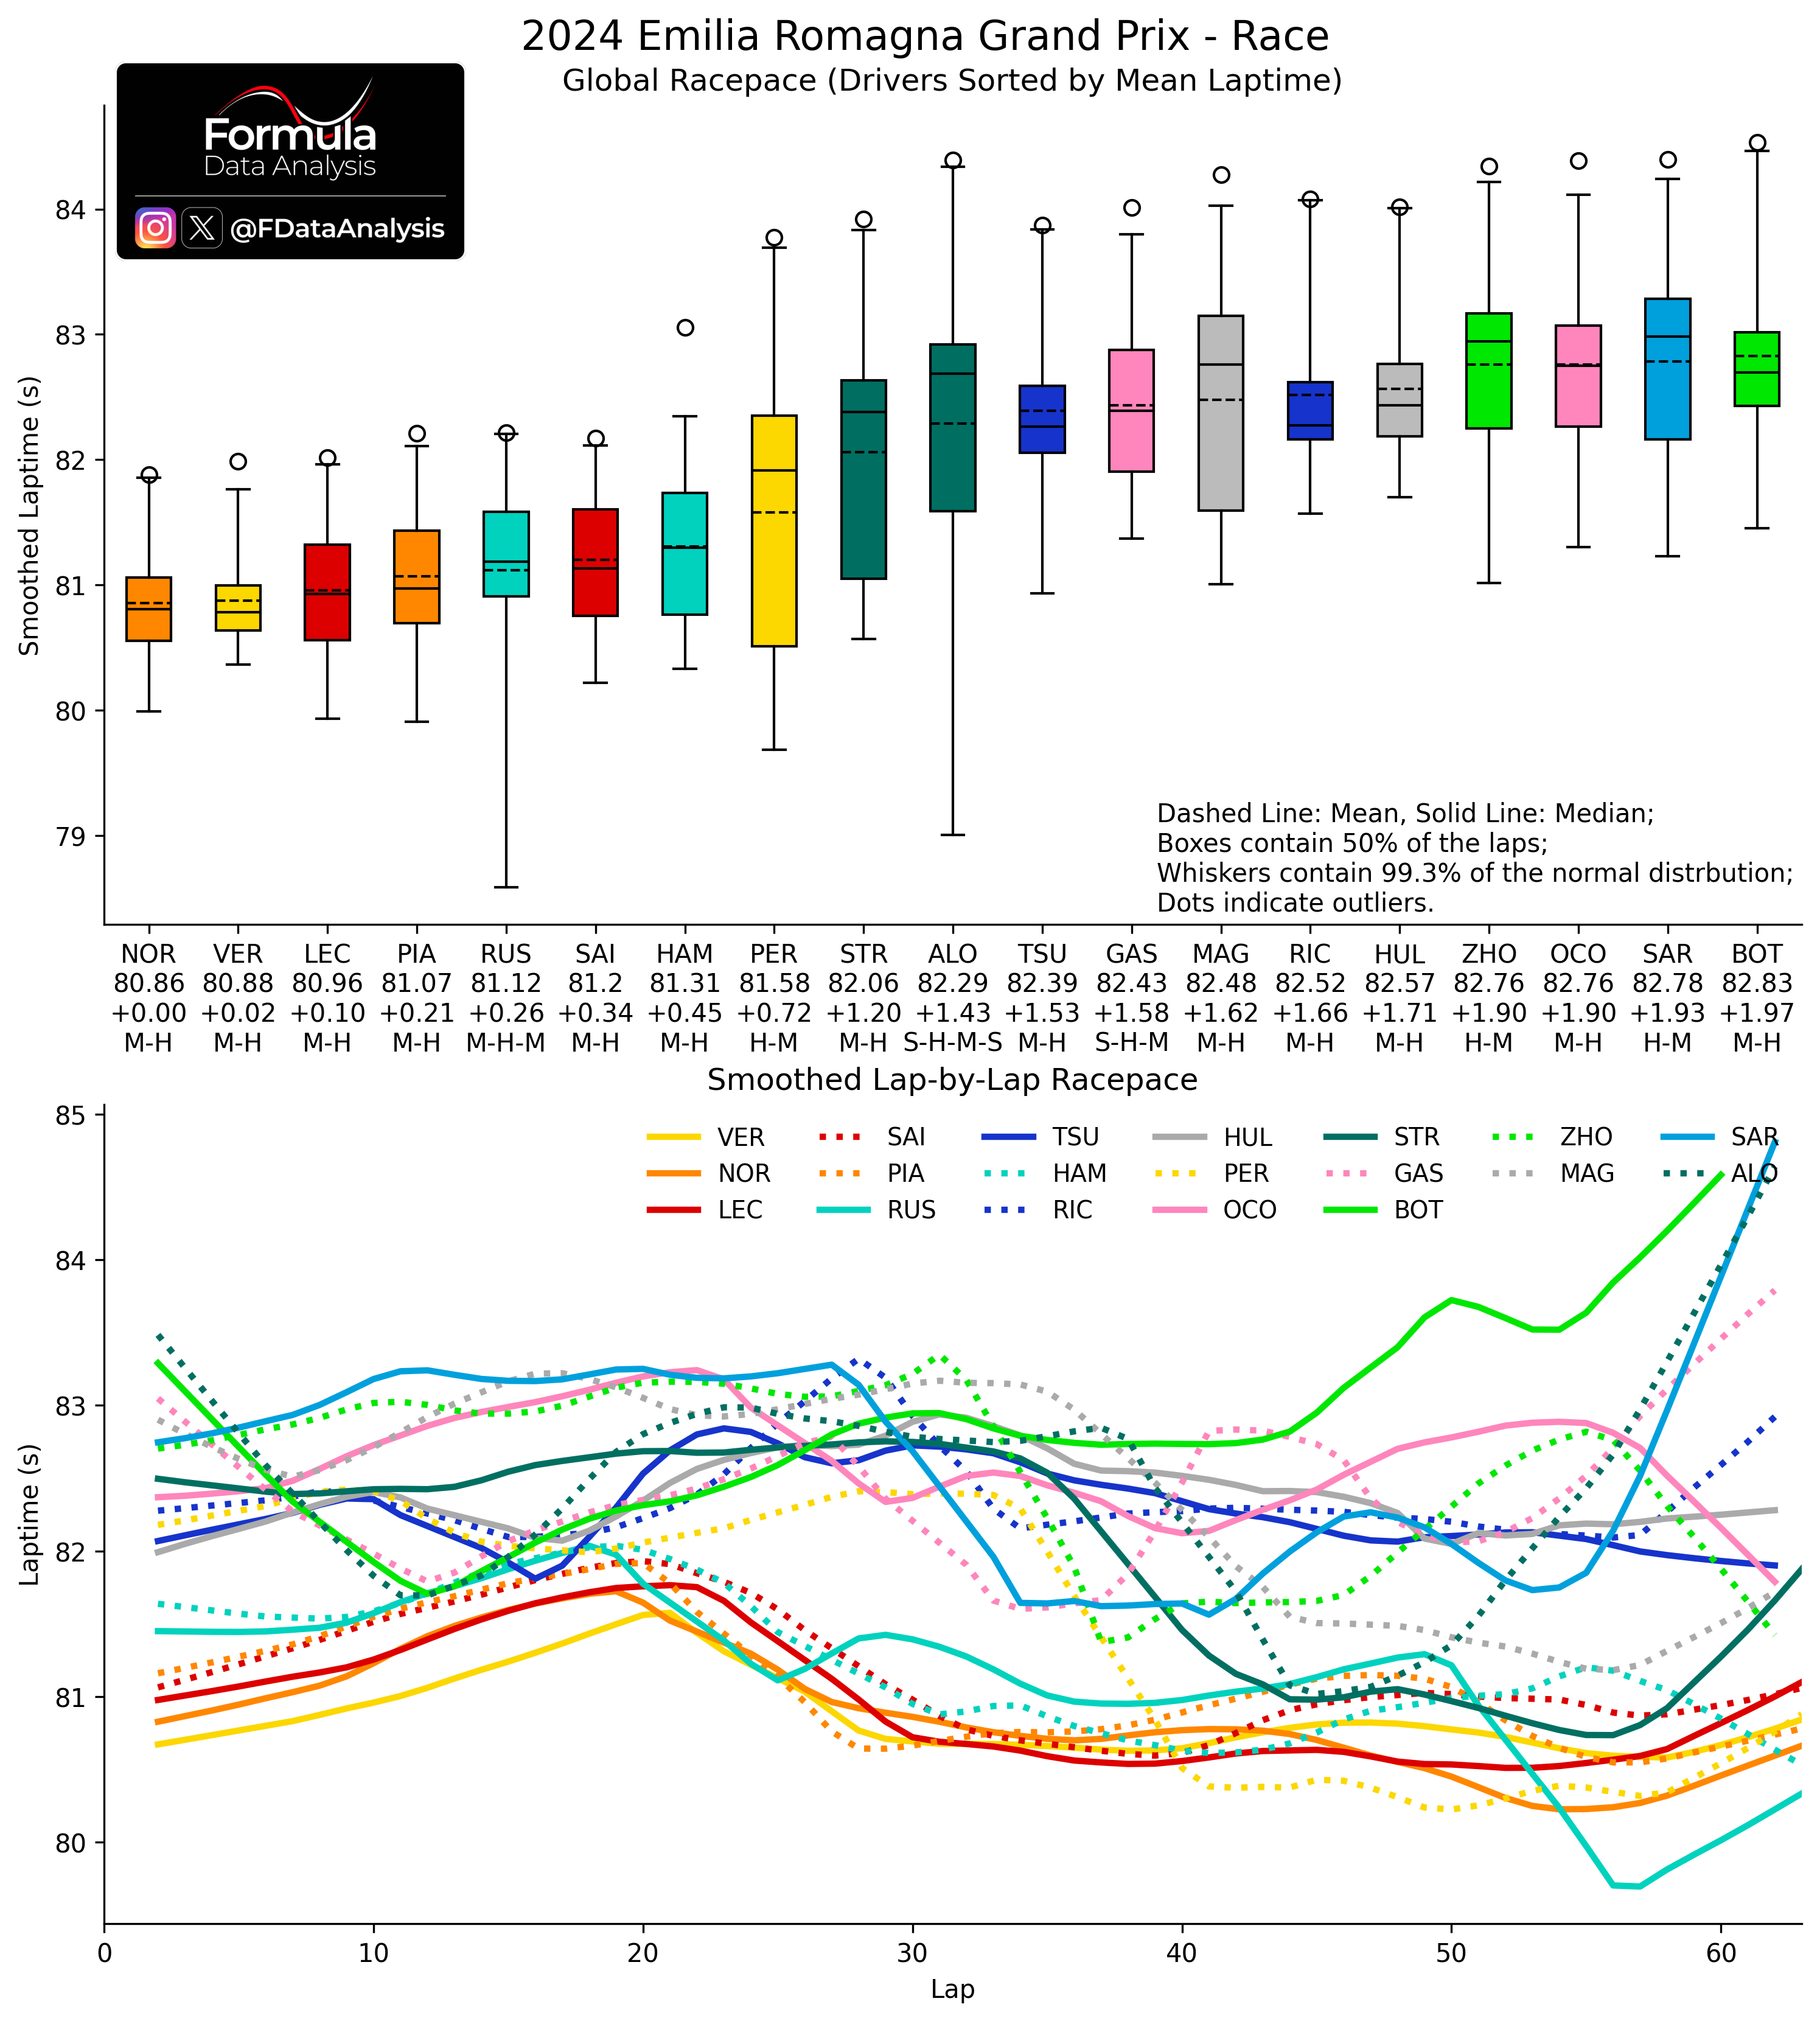
My prediction
Quali
Overall, this is my expected running order concerning quali (considering the placement of the best driver of each team, so the ultimate car’s potential). Teams on the same line are too close to call:
McLaren
Mercedes, RBR (VER)
Ferrari
Alpine, Williams
Racing Bulls
Haas
Aston, Sauber
Race
The following prediction is based on the expected starting prediction + the long runs from FP2 and additional context:
McLaren
RBR (VER) [Unusually competitive pace in FP2 long runs]
Mercedes
Ferrari
Alpine, Williams, Racing Bulls [Strong pace]
Haas
Aston, Sauber
Let's see which pecking order will take place! What's your prediction?
Thanks for your support, as always, and enjoy the race weekend! And check the data repository for more analyses
Mirco / Formula Data Analysis