

Hello, dear aspiring F1-Analysts,
Welcome to the first 'Quali and Race Preview' article of the 2025 season! Likely the most crucial weekend of the year, as teams will finally remove the 'sandbags' (extra fuel, lower engine modes, setup work, and driver margin) and show us their true potential. Don't expect it to determine the season's outcome, however. Remember how McL was just the 4th fastest car at the beginning of the season, while VER's RBR dominated? The developments changed the trend completely, and RBR finished 2 places behind McL in the WCC. The track itself is not a good benchmark of car performance, as its layout (and 4 DRS zones) makes it peculiar and not very representative. The likely rain should further mix the cards. To summarise: a first, but likely not very representative, look at this new season!
Track Characteristics
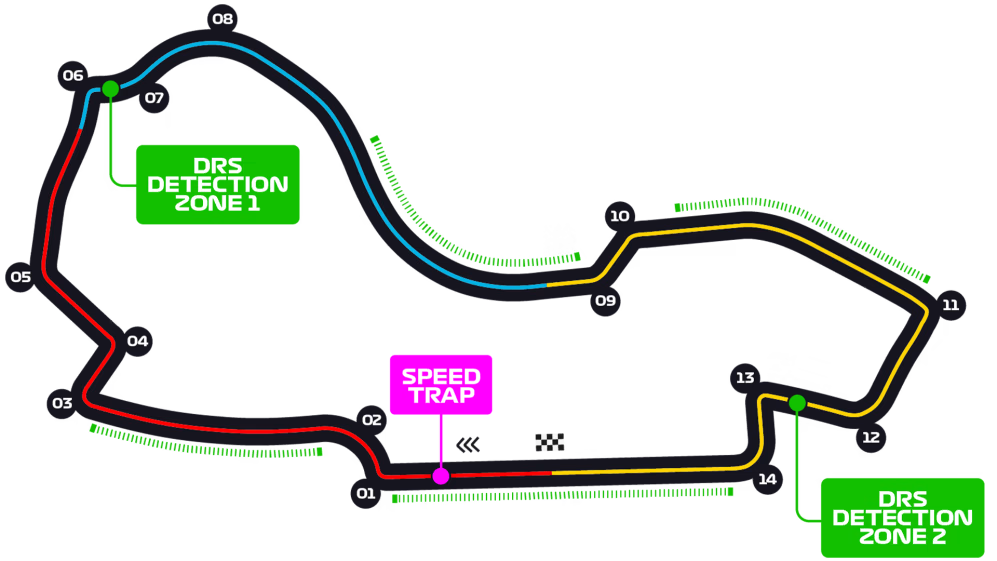
How to read: the track map shows its layout divided into three sectors (S1 in Red, S2 in Blue, and S3 in Yellow). The zones in which the DRS can be used are highlighted in green. In the race, a driver who crosses the DRS Detection Zone within 1s of the preceding driver can use the DRS in all zones up to the next DRS Detection Zone.
Albert Park is a bit of an outlier: it's a street circuit, so the asphalt grip is lower, but at the same time, it features several fast corners. The track contains FOUR DRS zones, and teams tend to run medium-high downforce wings: these two factors combined make having an effective DRS very important! Sector 2 is the fastest one, as it's full-throttle for most of its length. In contrast, Sectors 1 and 3 are much slower.
Characteristics of each sector:
Sector 1: Slower, one-and-half DRS zone. Important to be agile in the T1-2 change of direction and the following 2 right-hand corners
Sector 2: Fastest, 1 DRS zone. Requires minimal drag and lasting ERS deployment. Exiting turn 6 well is important, too.
Sector 3: Slower again, one-and-half DRS zone. Exiting turn 14 well is crucial so as not to lose time in the following straight.
The low-to-moderate forces required on the tyres during a lap allowed Pirelli to use the softest compounds on the track. The track features medium-low drip and abrasion, which will allow these tyres to sustain several laps. Braking and traction are less important than cornering for performance.

Wing Levels
What it means: Teams can use different rear wings. A more loaded rear wing will produce more downforce at the expense of more drag: the car will have slightly better traction, better cornering, and much better braking, but also a lower high-speed acceleration and top speed. Generally, it will have less tire wear, but it will also empty its battery quicker. A more loaded wing plane is a plane with more camber (more curvature) and a higher angle of attack (the angle of the wing relative to the airflow). The wing load can be increased through the lower and upper plane independently: the DRS only acts on the upper plane, so running a more loaded upper plane and a less loaded lower plane will generally make that car's DRS more effective.
Albert Park suits medium to medium-high levels of wing loads. Both can work: the former will gain in terms of tyre wear, cornering, braking, and traction. The latter will have better straightline performance over the 4 main straights: the difference will be modest when the DRS is available (in quali and when attacking) and very significant otherwise!
Expect the wing levels to change throughout the sessions as the weather forecasts evolve. At the start of the weekend, Ferrari was running a noticeably more loaded rear wing compared to McLaren. RedBull (closer to Ferrari) and Mercedes (closer to McL) choose a compromise. Notably, among the top 3 teams, only Ferrari chose to use the same wing used in the Bahrain tests, while the others went one step lower in downforce.
Among the midfielders, Alpine had the least loaded wing, while those of Williams/Haas/Aston weren't that different.

Weather Forecasts (by F1)
FRIDAY, MARCH 14 – FP1 AND FP2
Conditions: Sunny and fair with a few thin, high clouds at times. Light-to-moderate southerly wind. FP1: 26°C // FP2: 27°C
Maximum temperature expected: 28 Celsius
Minimum temperature expected: 15 Celsius
Chance of rain: 0%
SATURDAY, MARCH 15 – FP3 AND QUALIFYING
Conditions: Mostly sunny with a veil of high clouds in the afternoon. Increasing clouds later in the evening. Hottest day of the week with up to 35 Celsius. Moderate northerly wind with gusts up to 30-40kph. FP3: 32°C // Q: 33°C
Maximum temperature expected: 35 Celsius
Minimum temperature expected: 18 Celsius
Chance of rain: <20%
SUNDAY, MARCH 16 – RACE
Conditions: High chance of rain from midday with a rainy front expected to cross the area in the afternoon. Rain amount expected 3-10mm. Breezy southwesterly wind with gusts up to 40-50kph. Cooler conditions. Race start: 23°C
Maximum temperature expected: 25 Celsius
Minimum temperature expected: 19 Celsius
Chance of rain: >80%
Quali should by dry, but expect a rainy race! That will impact the running order significantly, and can give VER what he needs to have a strong race in a seemingly inferior car.
Single Lap Pace
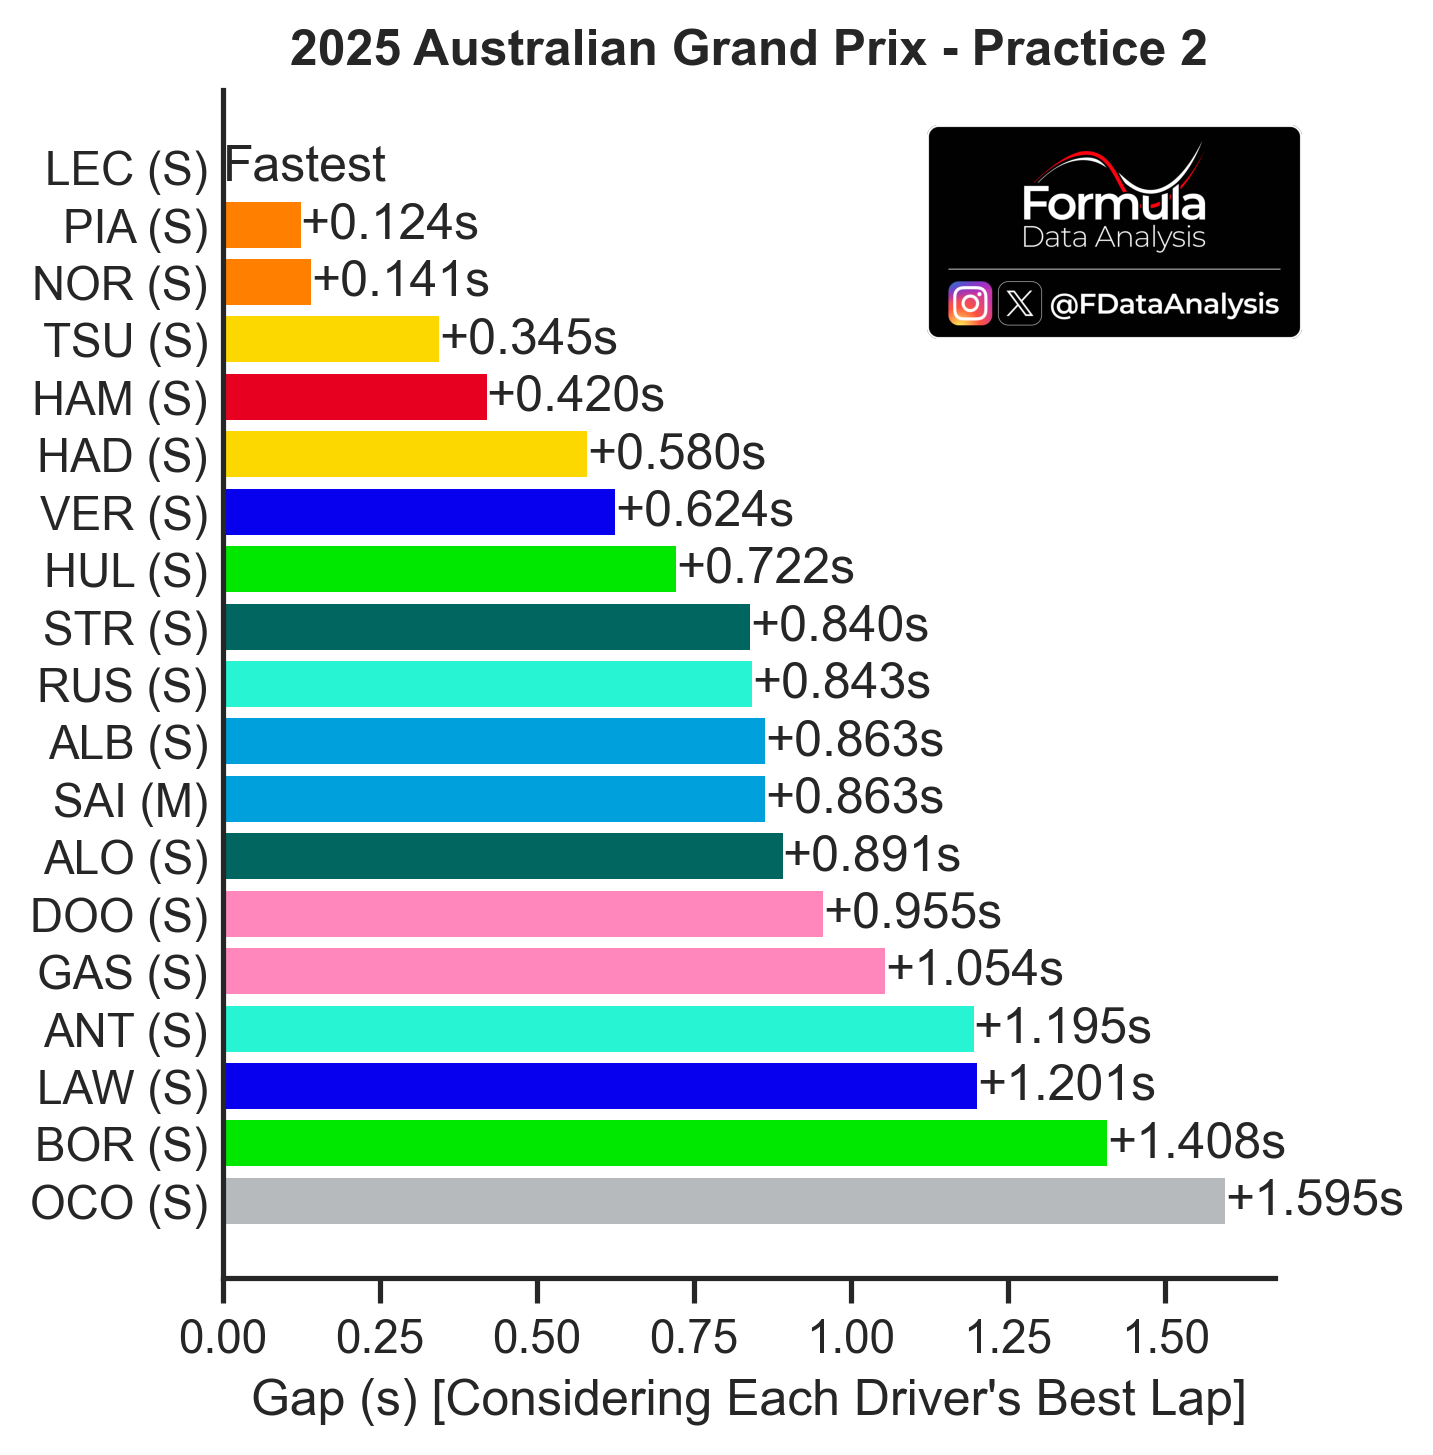
Best Laptime per Driver
How to read: The graph shows the difference between each driver's fastest lap in the session. The letter to the right of each driver indicates the compound used.
Only SAI did his best lap on Mediums; all others used softs (which makes their laps more comparable). LEC was the fastest, but the 2 McL cars were close! (+0.124 PIA, +0.141s NOR). Racing Bulls started their weekend with strong form: TSU was 4th quickest, HAD 6th quickest. HAM, per the team's comments, focused on getting accustomed to the car and did not push as much as LEC. VER (P7) was closely followed by... HUL's Sauber! So far, Aston, Mercedes, and Williams have produced very similar laptimes. OCO was over 1.5s away from the best lap, as his teammate's car was unavailable due to the crash.
Aero Map
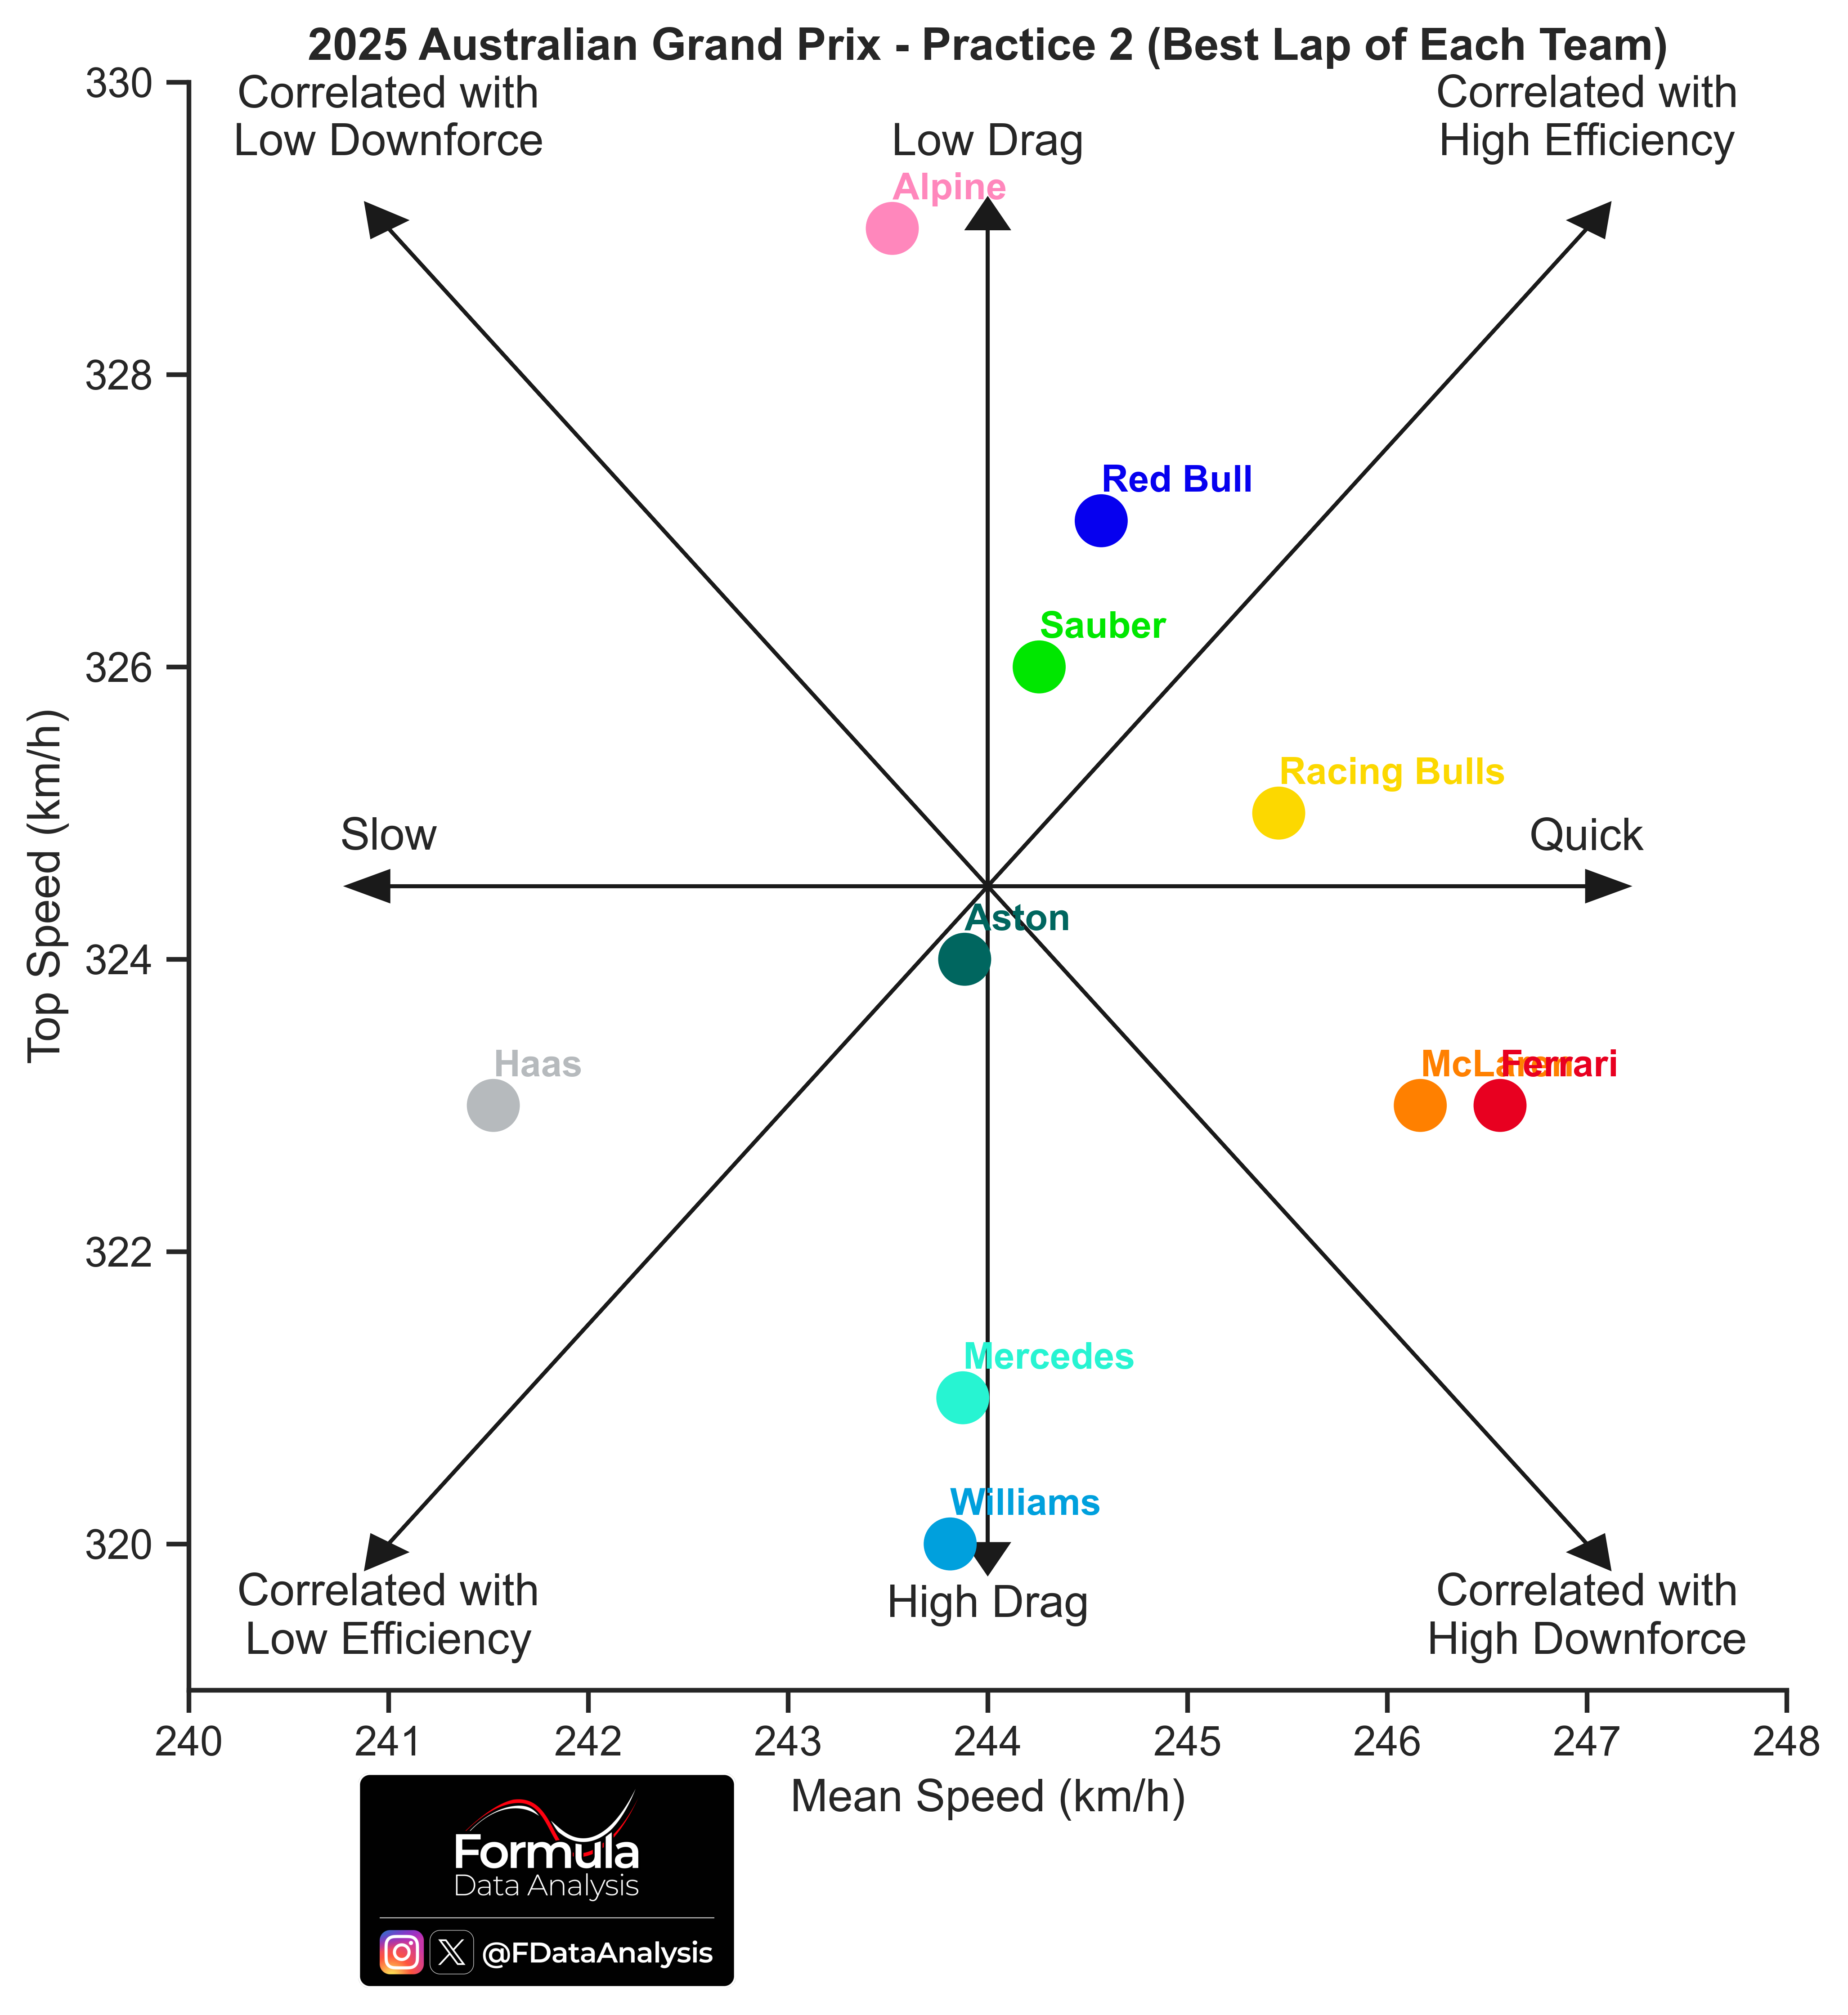
How to read: Average speed on the horizontal axis: the further to the right a team is, the better its performance (the lower the lap time). Top speed on the vertical axis: the upper a team is, the lower that car's drag or the higher that team's engine mode. Therefore, this plot not only shows who was the fastest (those on the right) but also why! (due to very low drag, if they are in the upper portion, or despite that, if they are in the lower portion).
Keep in mind that teams run different PU modes and fuel levels in free practice, which can murk results. Mercedes and Williams had the lowest top speed and could not perform as well as others due to that. It seems to be a combination of medium-high drag and not very high engine modes. McL and Ferrari were quickest, yet their top speeds were unimpressive. Alpine was slightly slower than Williams, despite a 9km/h top-speed advantage!
Red Bull's top speed was the 2nd highest, yet it didn't produce a noteworthy laptime: per VER's admission, the car is driveable but lacks overall grip.
Top Speeds
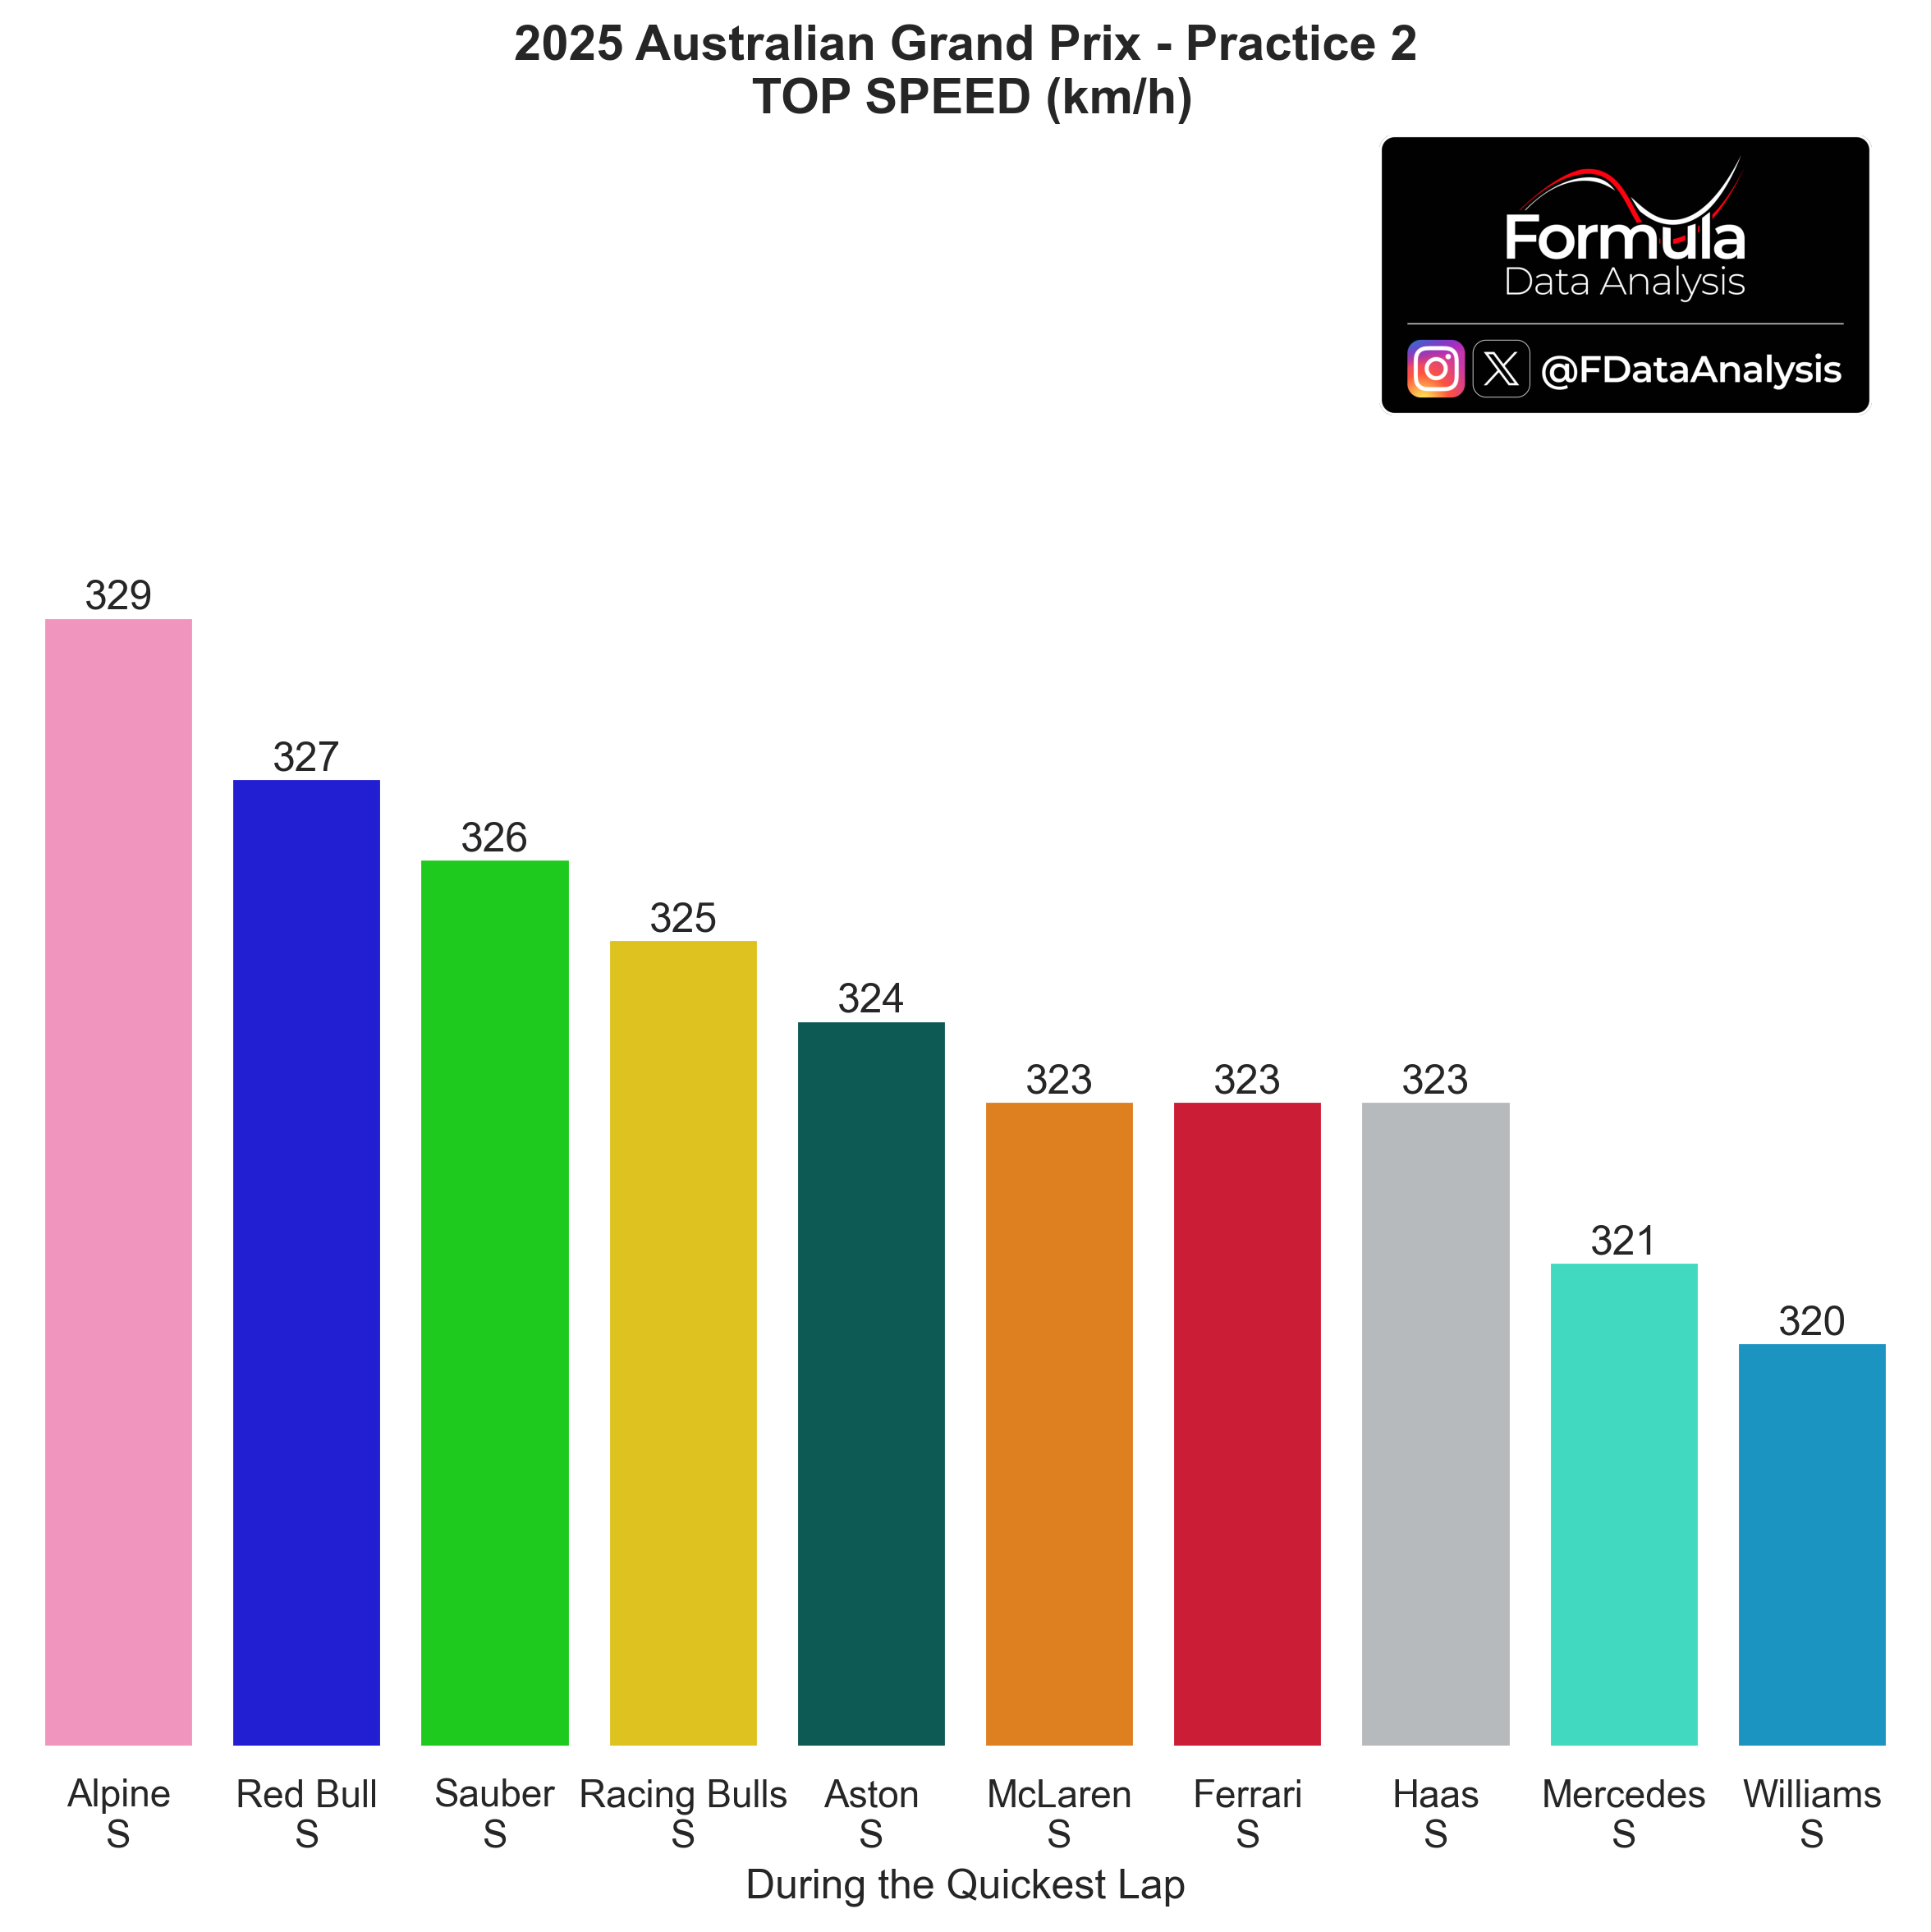
How to read: The higher a team's top speed, the lower that car's drag or the higher that team's engine mode.
Teams are sorted by descending top speed. The top speed delta across the field (9km/h, Alpine vs Williams) was significant.
Same chart, per driver:
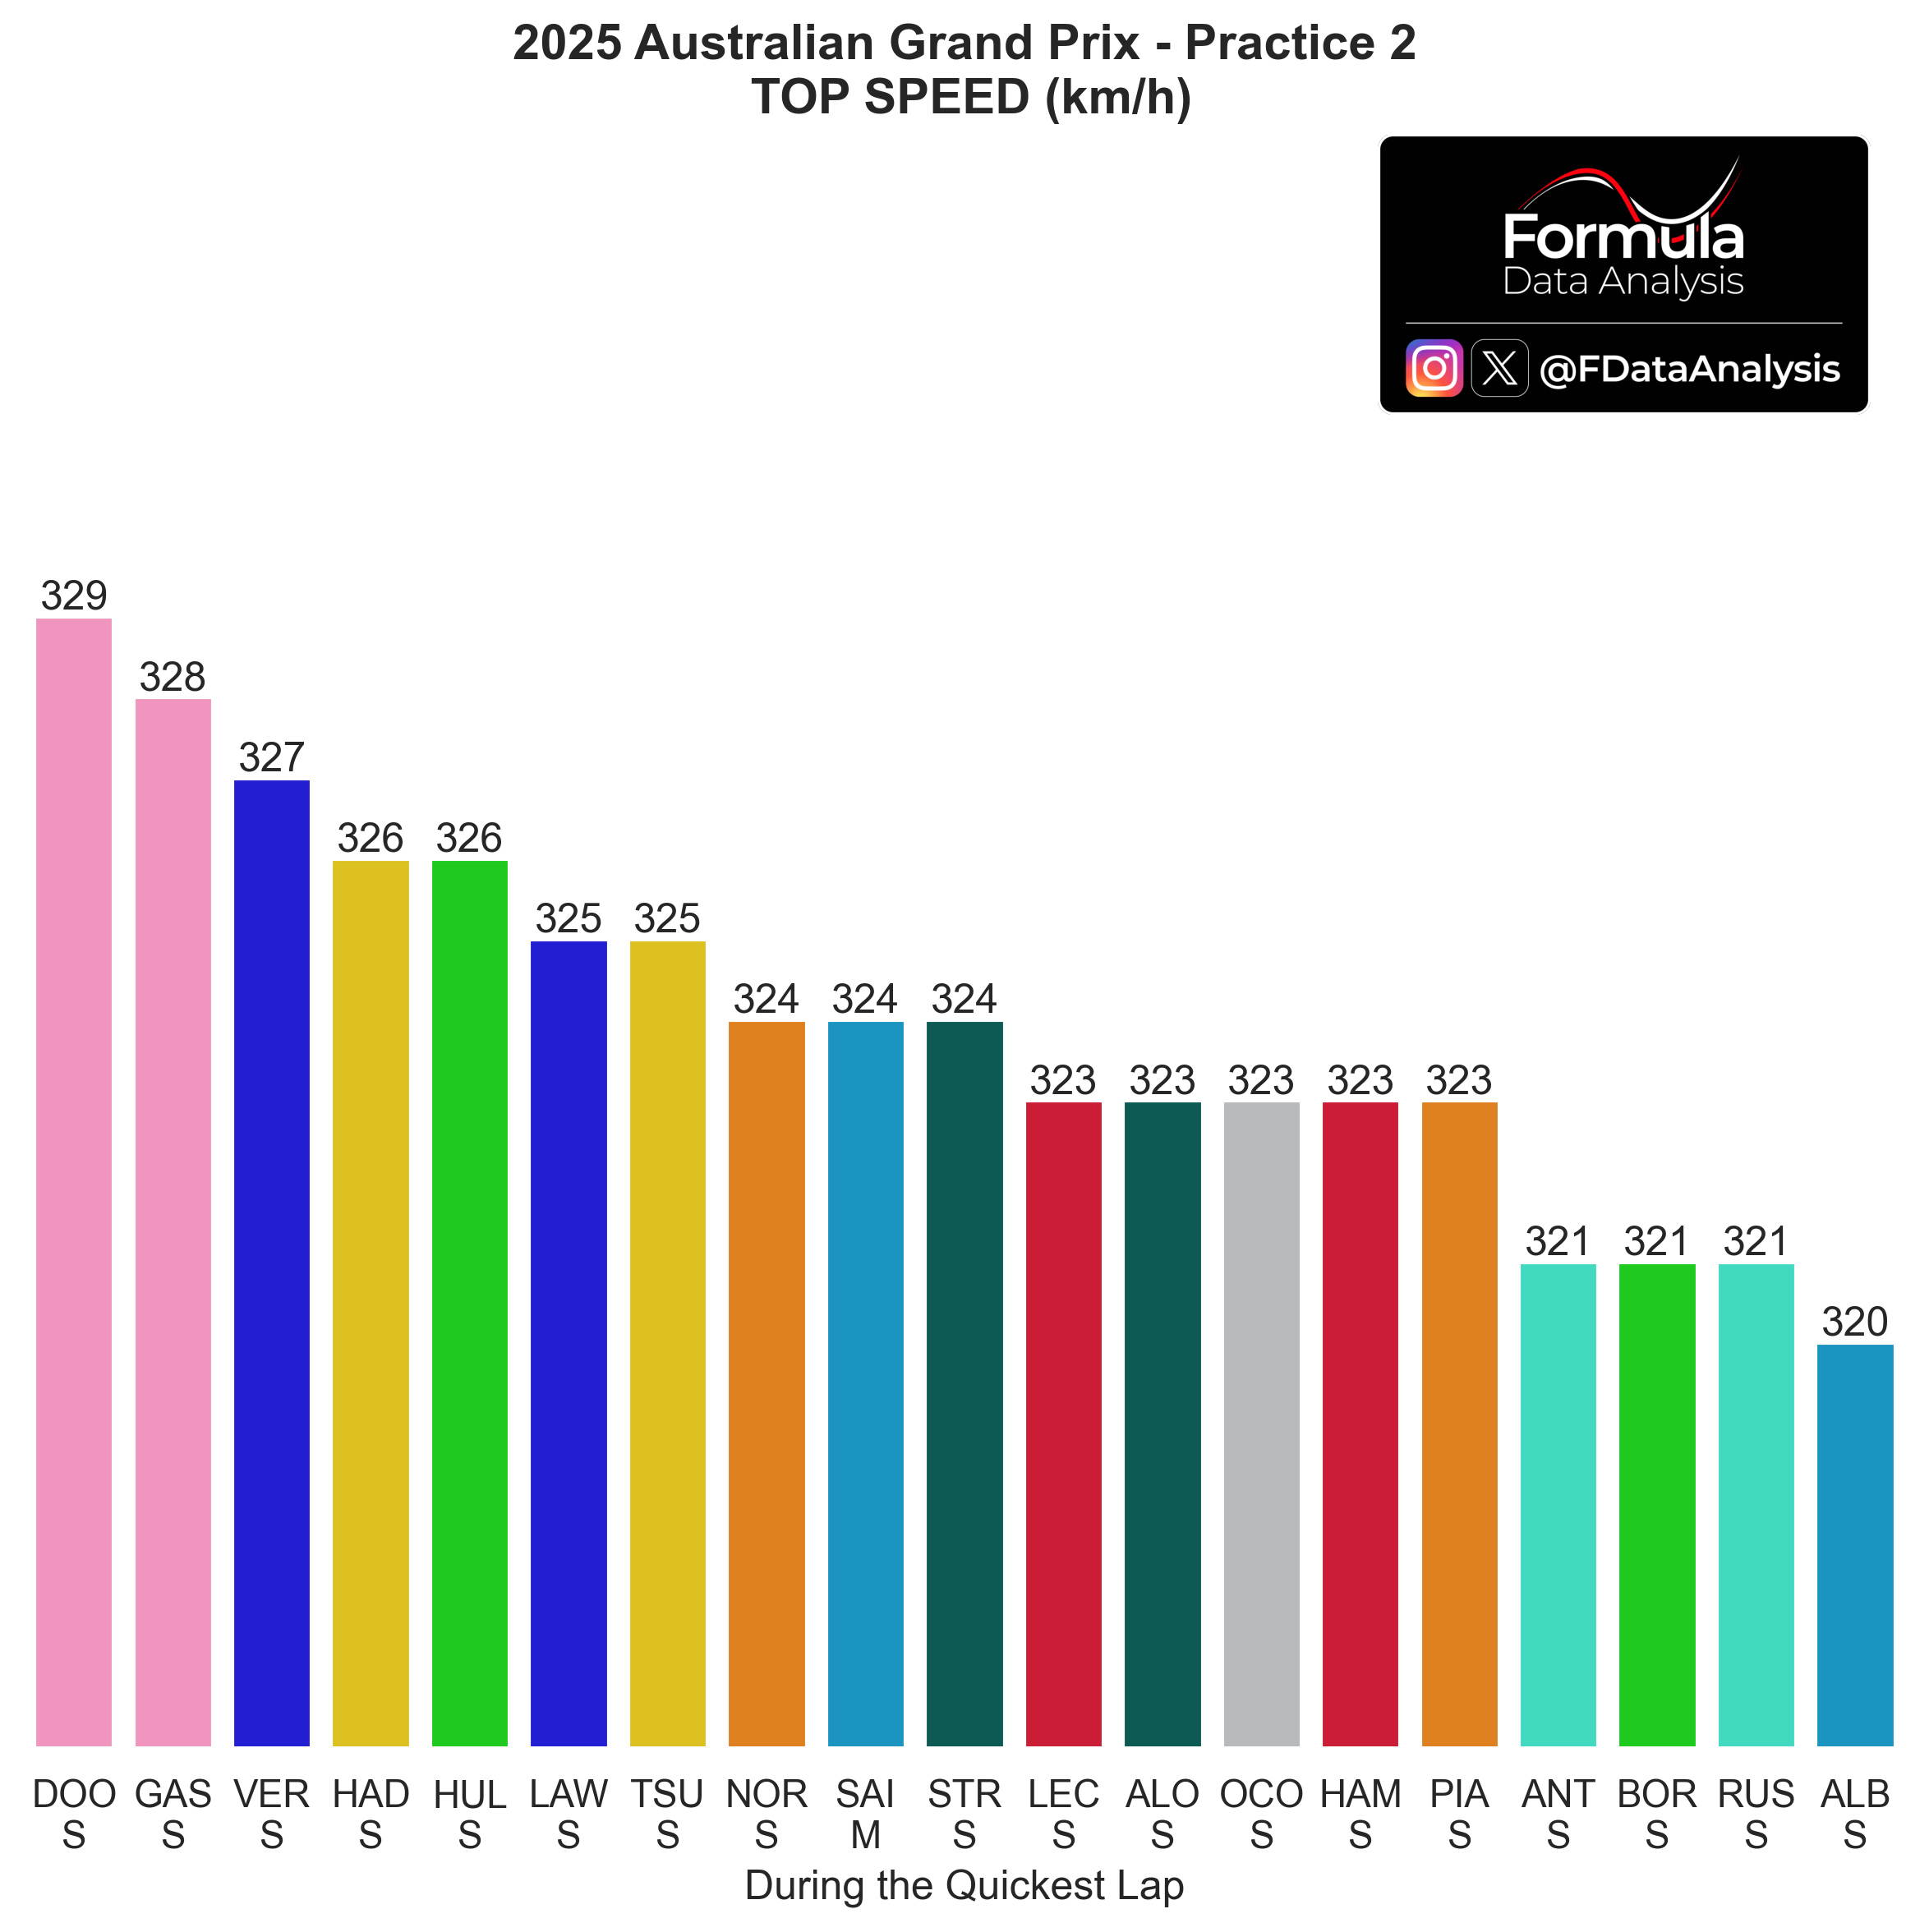
Clear differences in setup between the two Sauber drivers and between SAI (on M) and ALB (on S)
Best Sectors
A summary to remind you of the properties of each one:
Sector 1: Slower, one-and-half DRS zone. Important to be agile in the T1-2 change of direction and the following 2 right-hand corners
Sector 2: Fastest, 1 DRS zone. Requires minimal drag and lasting ERS deployment. Exiting turn 6 well is important, too.
Sector 3: Slower again, one-and-half DRS zone. Exiting turn 14 well is crucial so as not to lose time in the following straight.
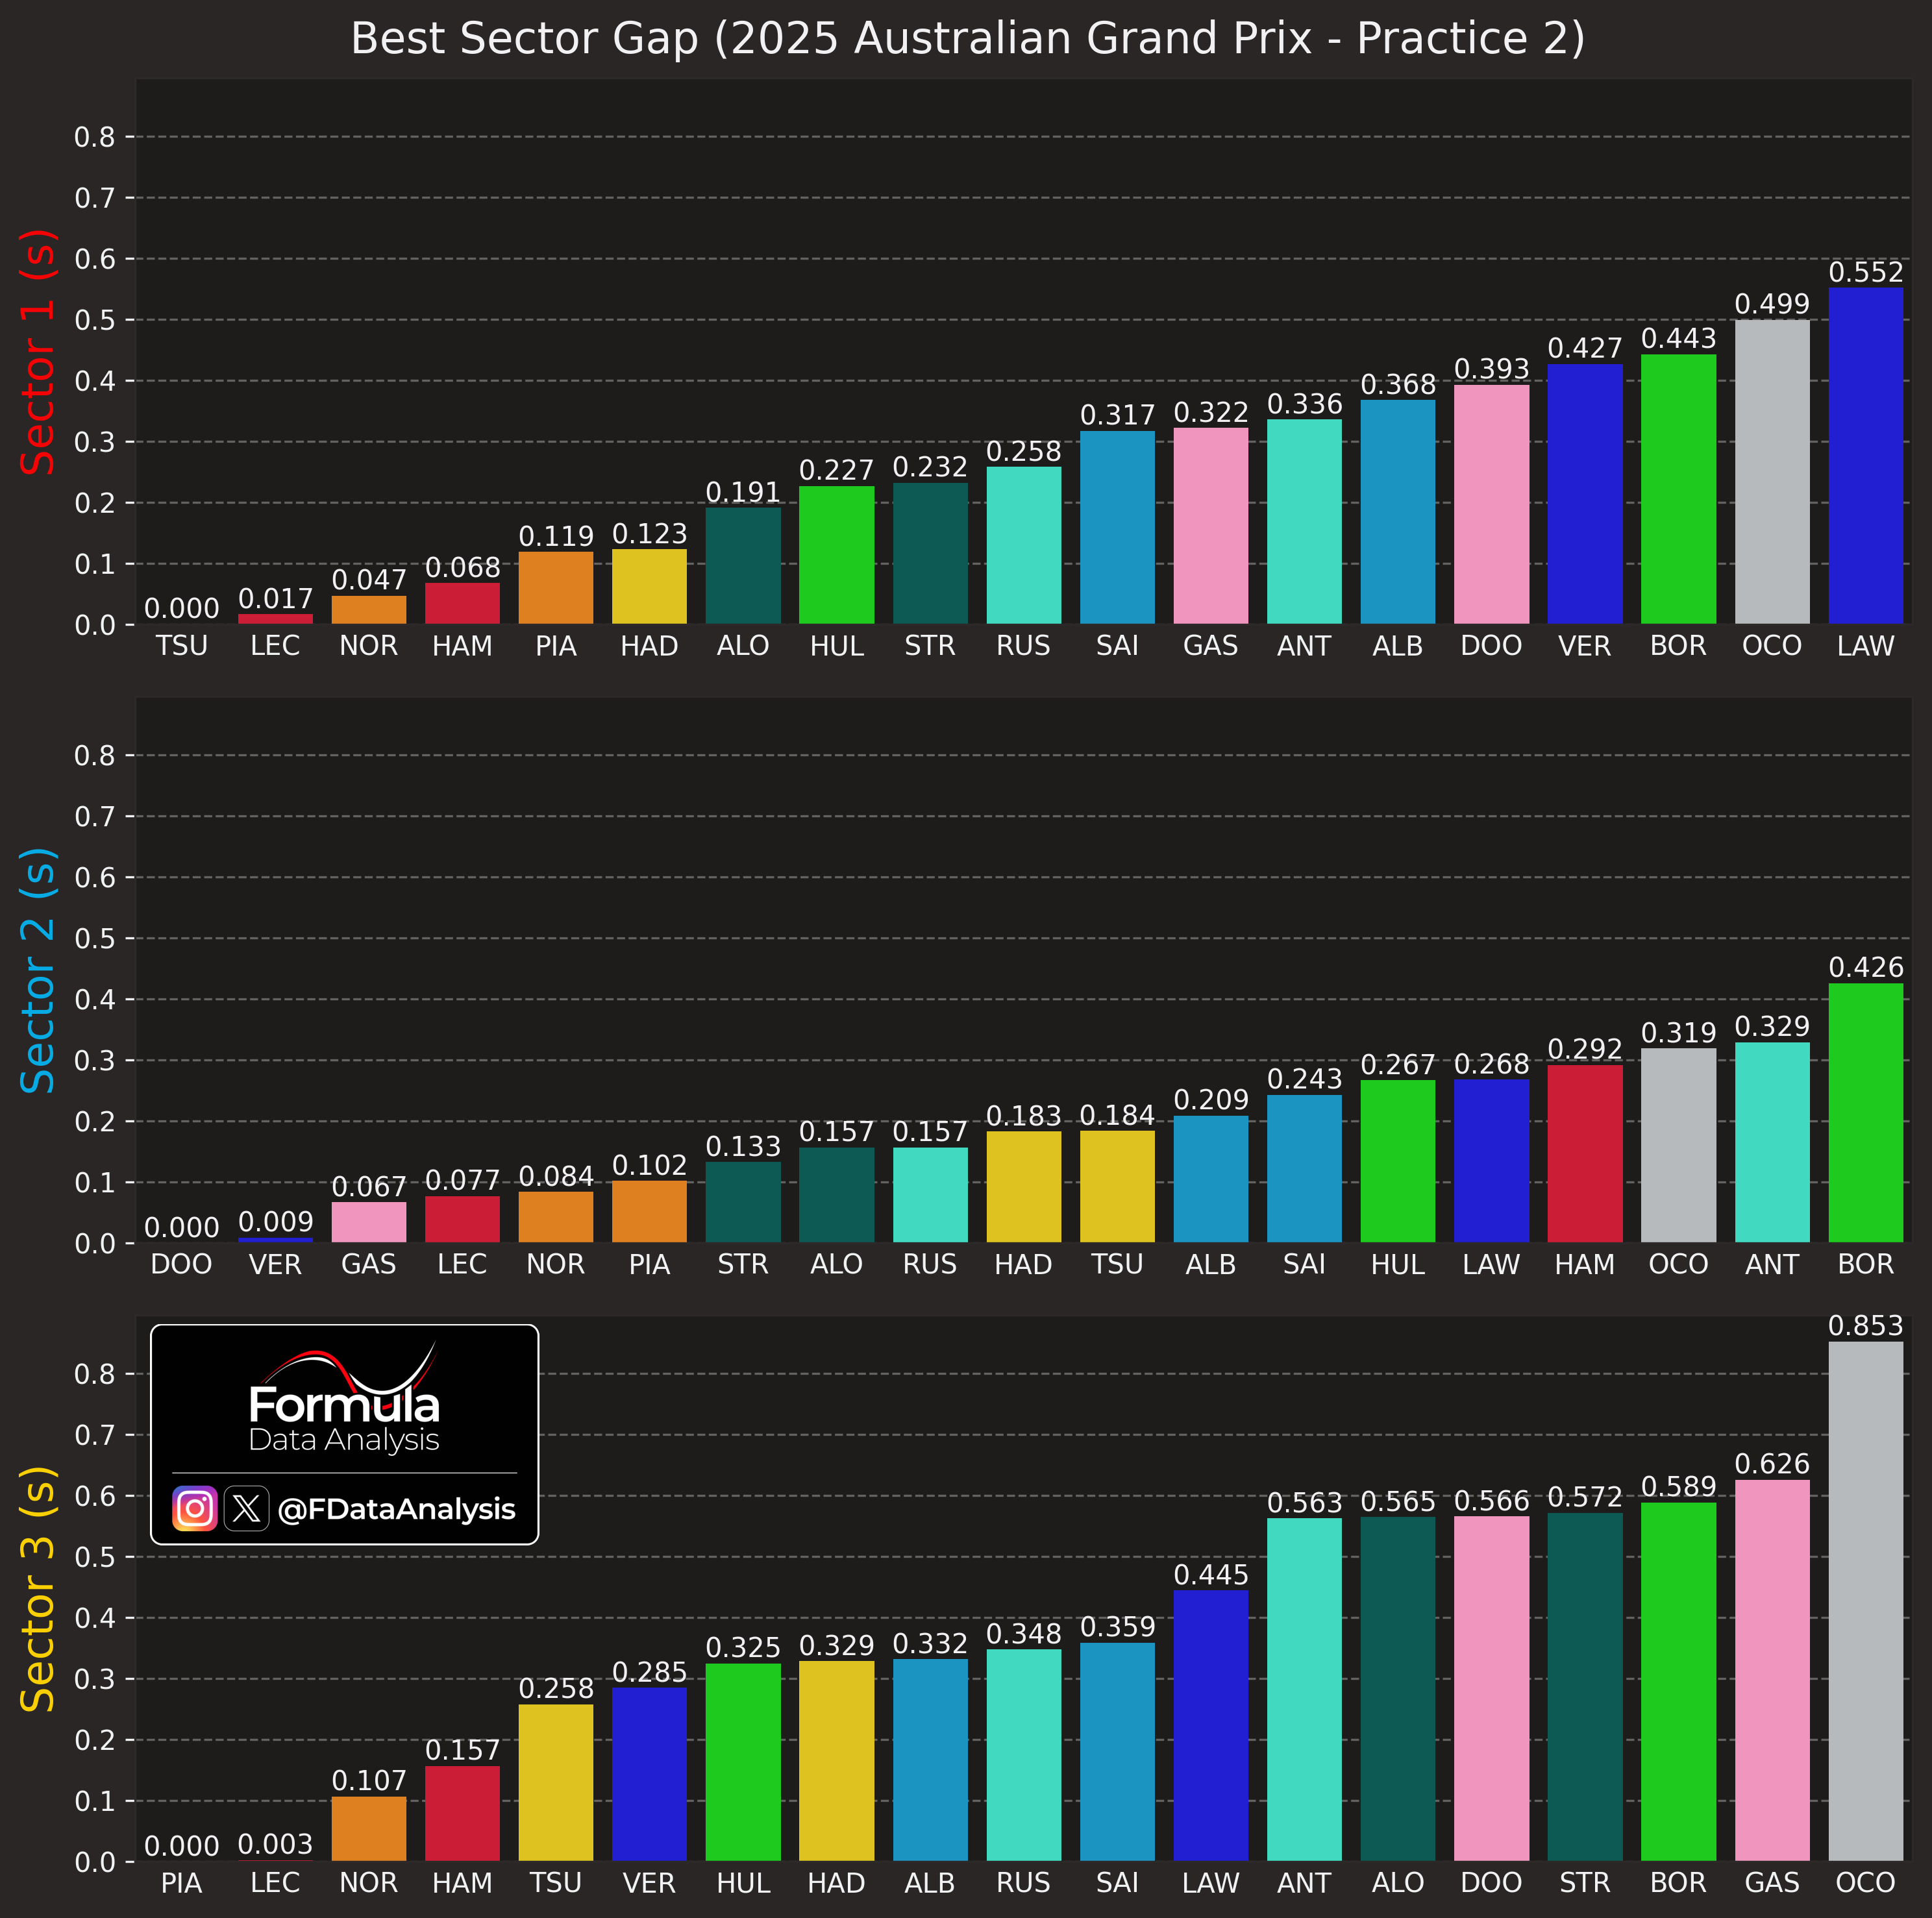
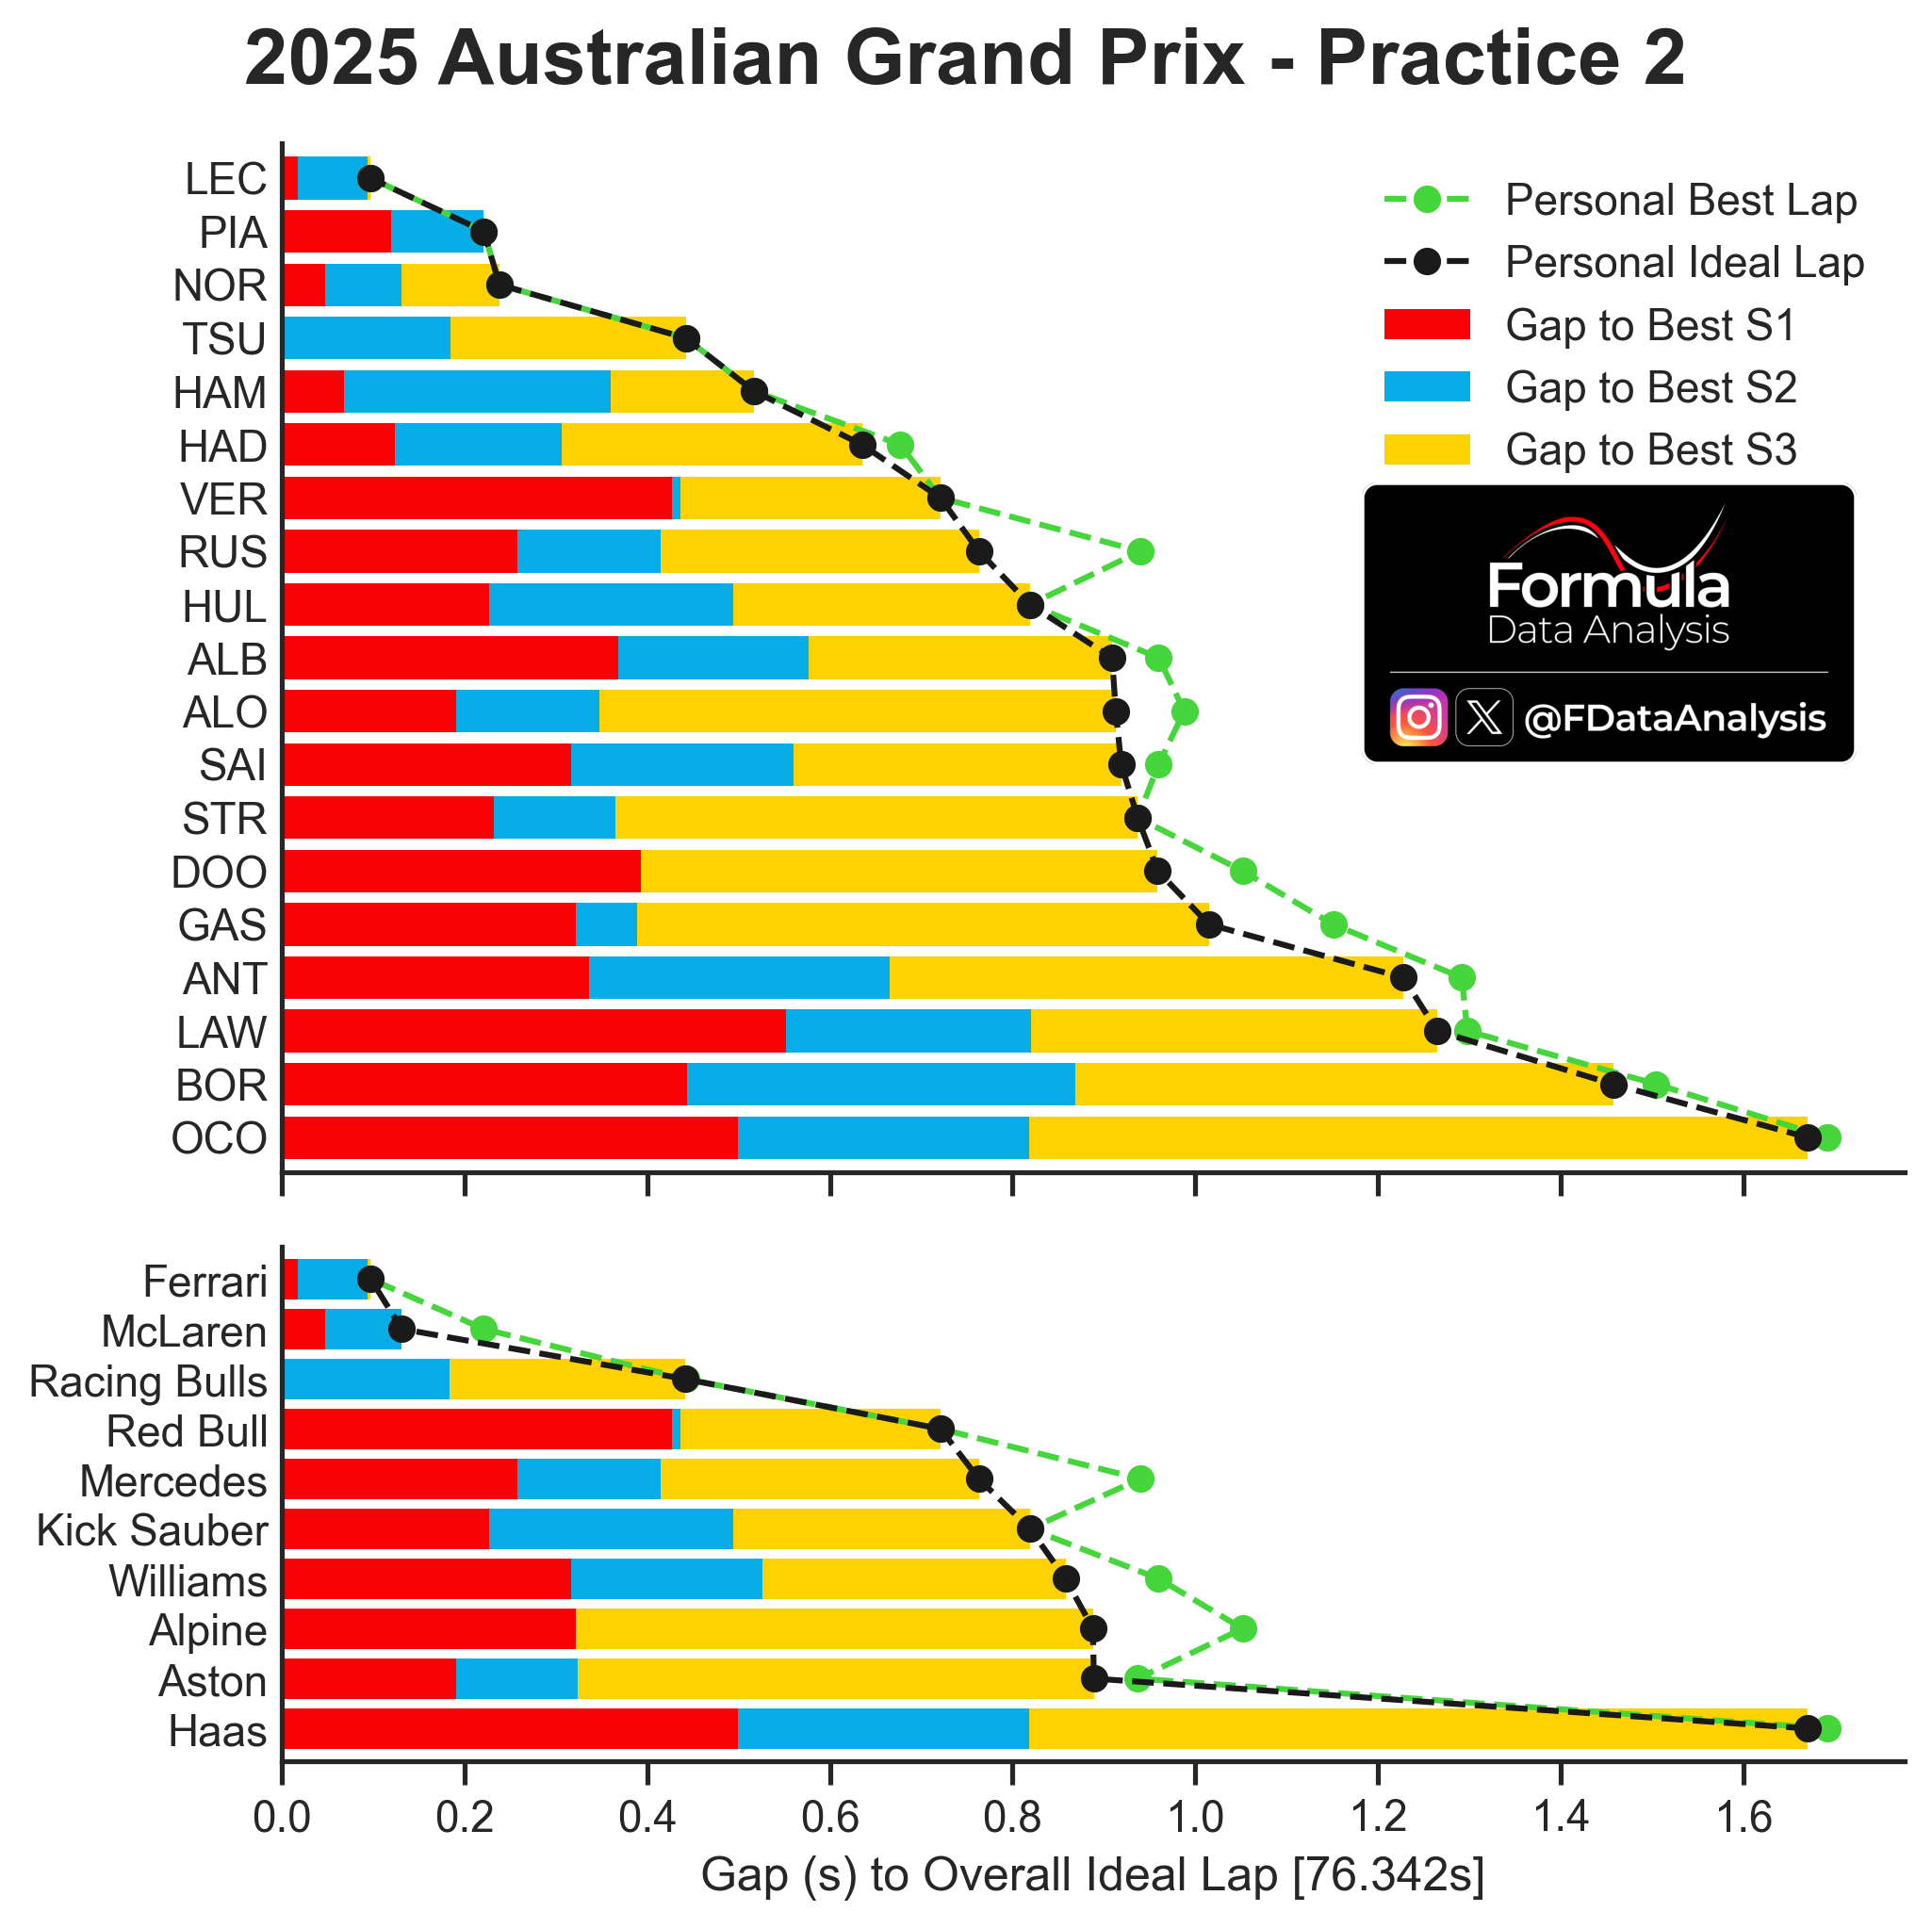
LEC was quickest overall, but not in any sector: his lap was very balanced, making no mistakes along the lap, and highlighted the SF-25's seemingly good all-around performance. TSU was quickest in Sector 1, highlighting RB's good agility (and possibly lower fuel load). As expected, Alpine was quickest in the fast Sector 2, thanks to the lower drag rear wing they were running. VER's excellent top speed aided him there (while he was nowhere in sector 1!). McL shined in S3: PIA was quickest, and NOR was still in TOP 3. Ferrari's worst sector was S2, but even there, LEC lost less than 1 tenth!
Sector 3 takes almost twice the time of Sector 2:
Best vs Ideal Lap
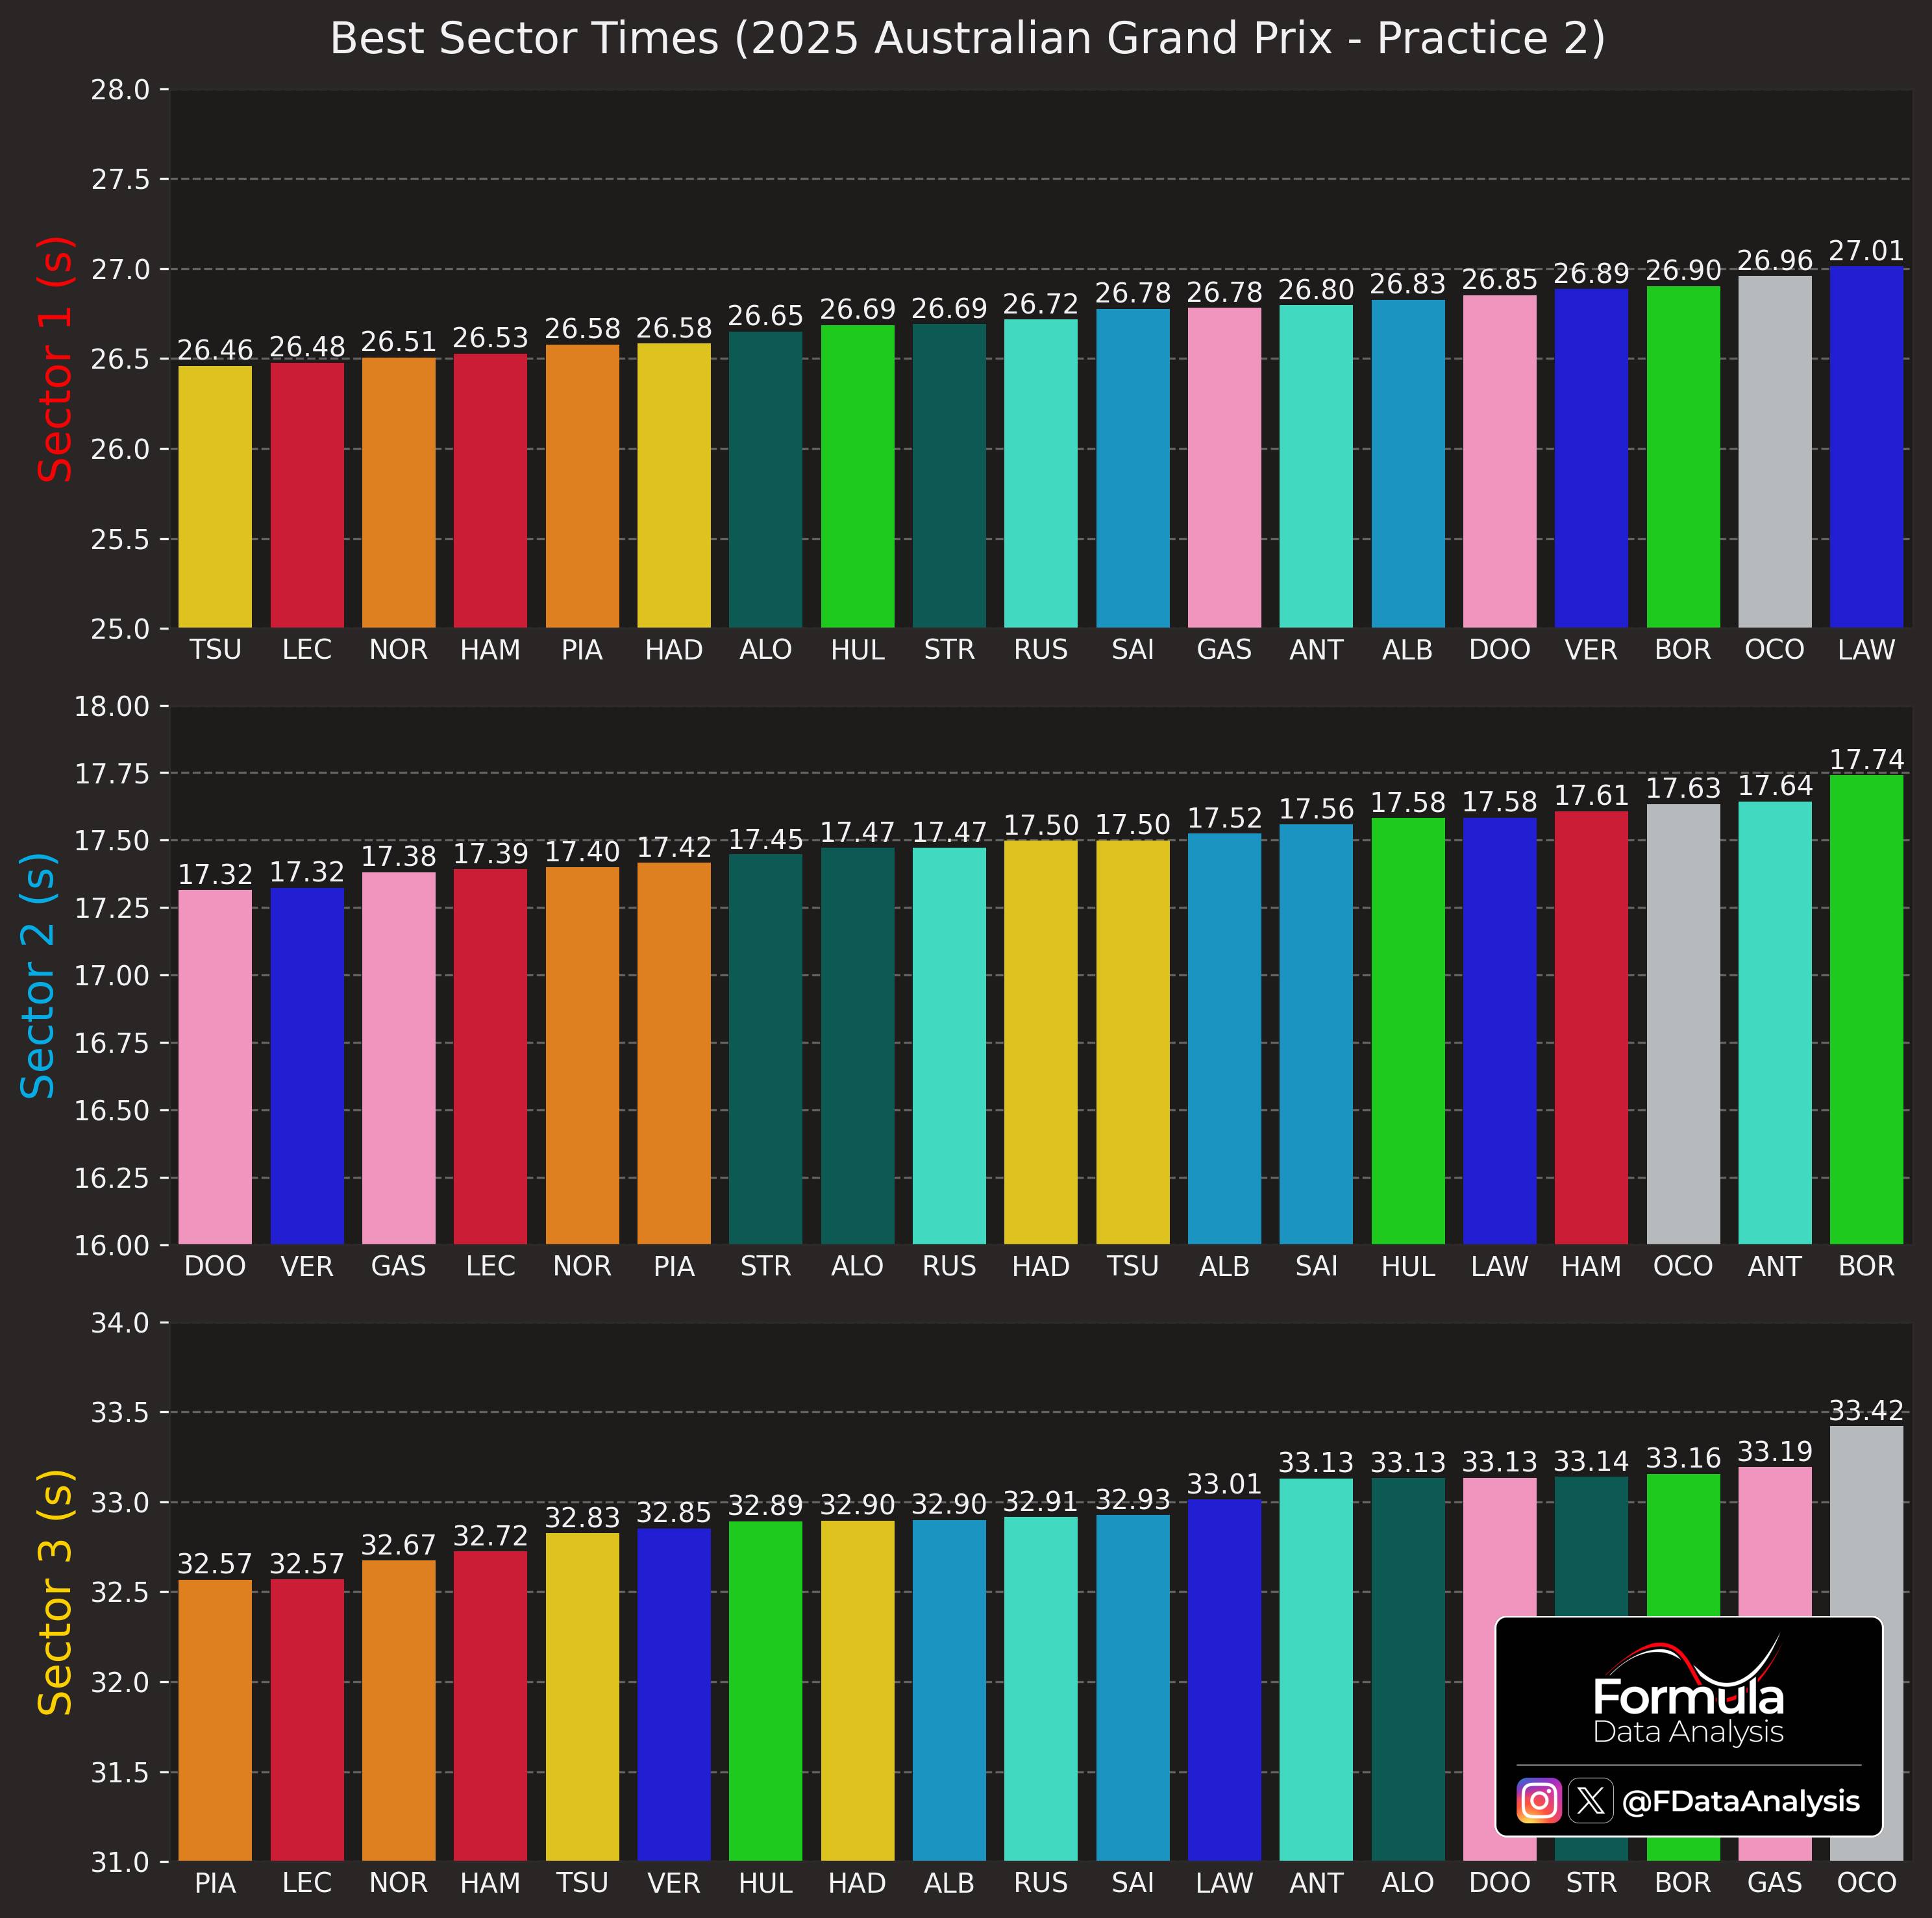
How to read: The graph shows, for each driver and each car, the ‘Personal Ideal Lap’ (the lap time obtained by the sum of that driver’s or team’s best 3 sectors, which might have been achieved in different laps) in black, and the ‘Personal Best Lap’ (the best lap time that the driver or team has effectively achieved in the session) in green. Consequently, the Personal Ideal Laptime is always equal to or lower than the Personal Best Laptime. If the two coincide, it means that the driver or team has produced its best sector times all on the same lap. The farther the Personal Best Laptime is from the Personal Ideal Laptime, the more potential lap time that one driver or team has left on the table. The coloured bars indicate the gap to the absolute best sector time. The ‘Overall Ideal Lap’ is shown at the bottom of the figure and is the sum of the lap times of the overall best sectors, independent of which driver or car achieved them.
Drivers who left the most time on the table: RUS, ALO, DOO, GAS. In terms of teams, McL and especially Mercedes, Williams, and Alpine have the most time to gain by combining their respective best sectors.
Teams sorted by ideal laptime:
Ferrari
McL
Racing Bulls
RedBull
Mercedes
Sauber
Williams
Alpine, Aston
Haas
Throttle use
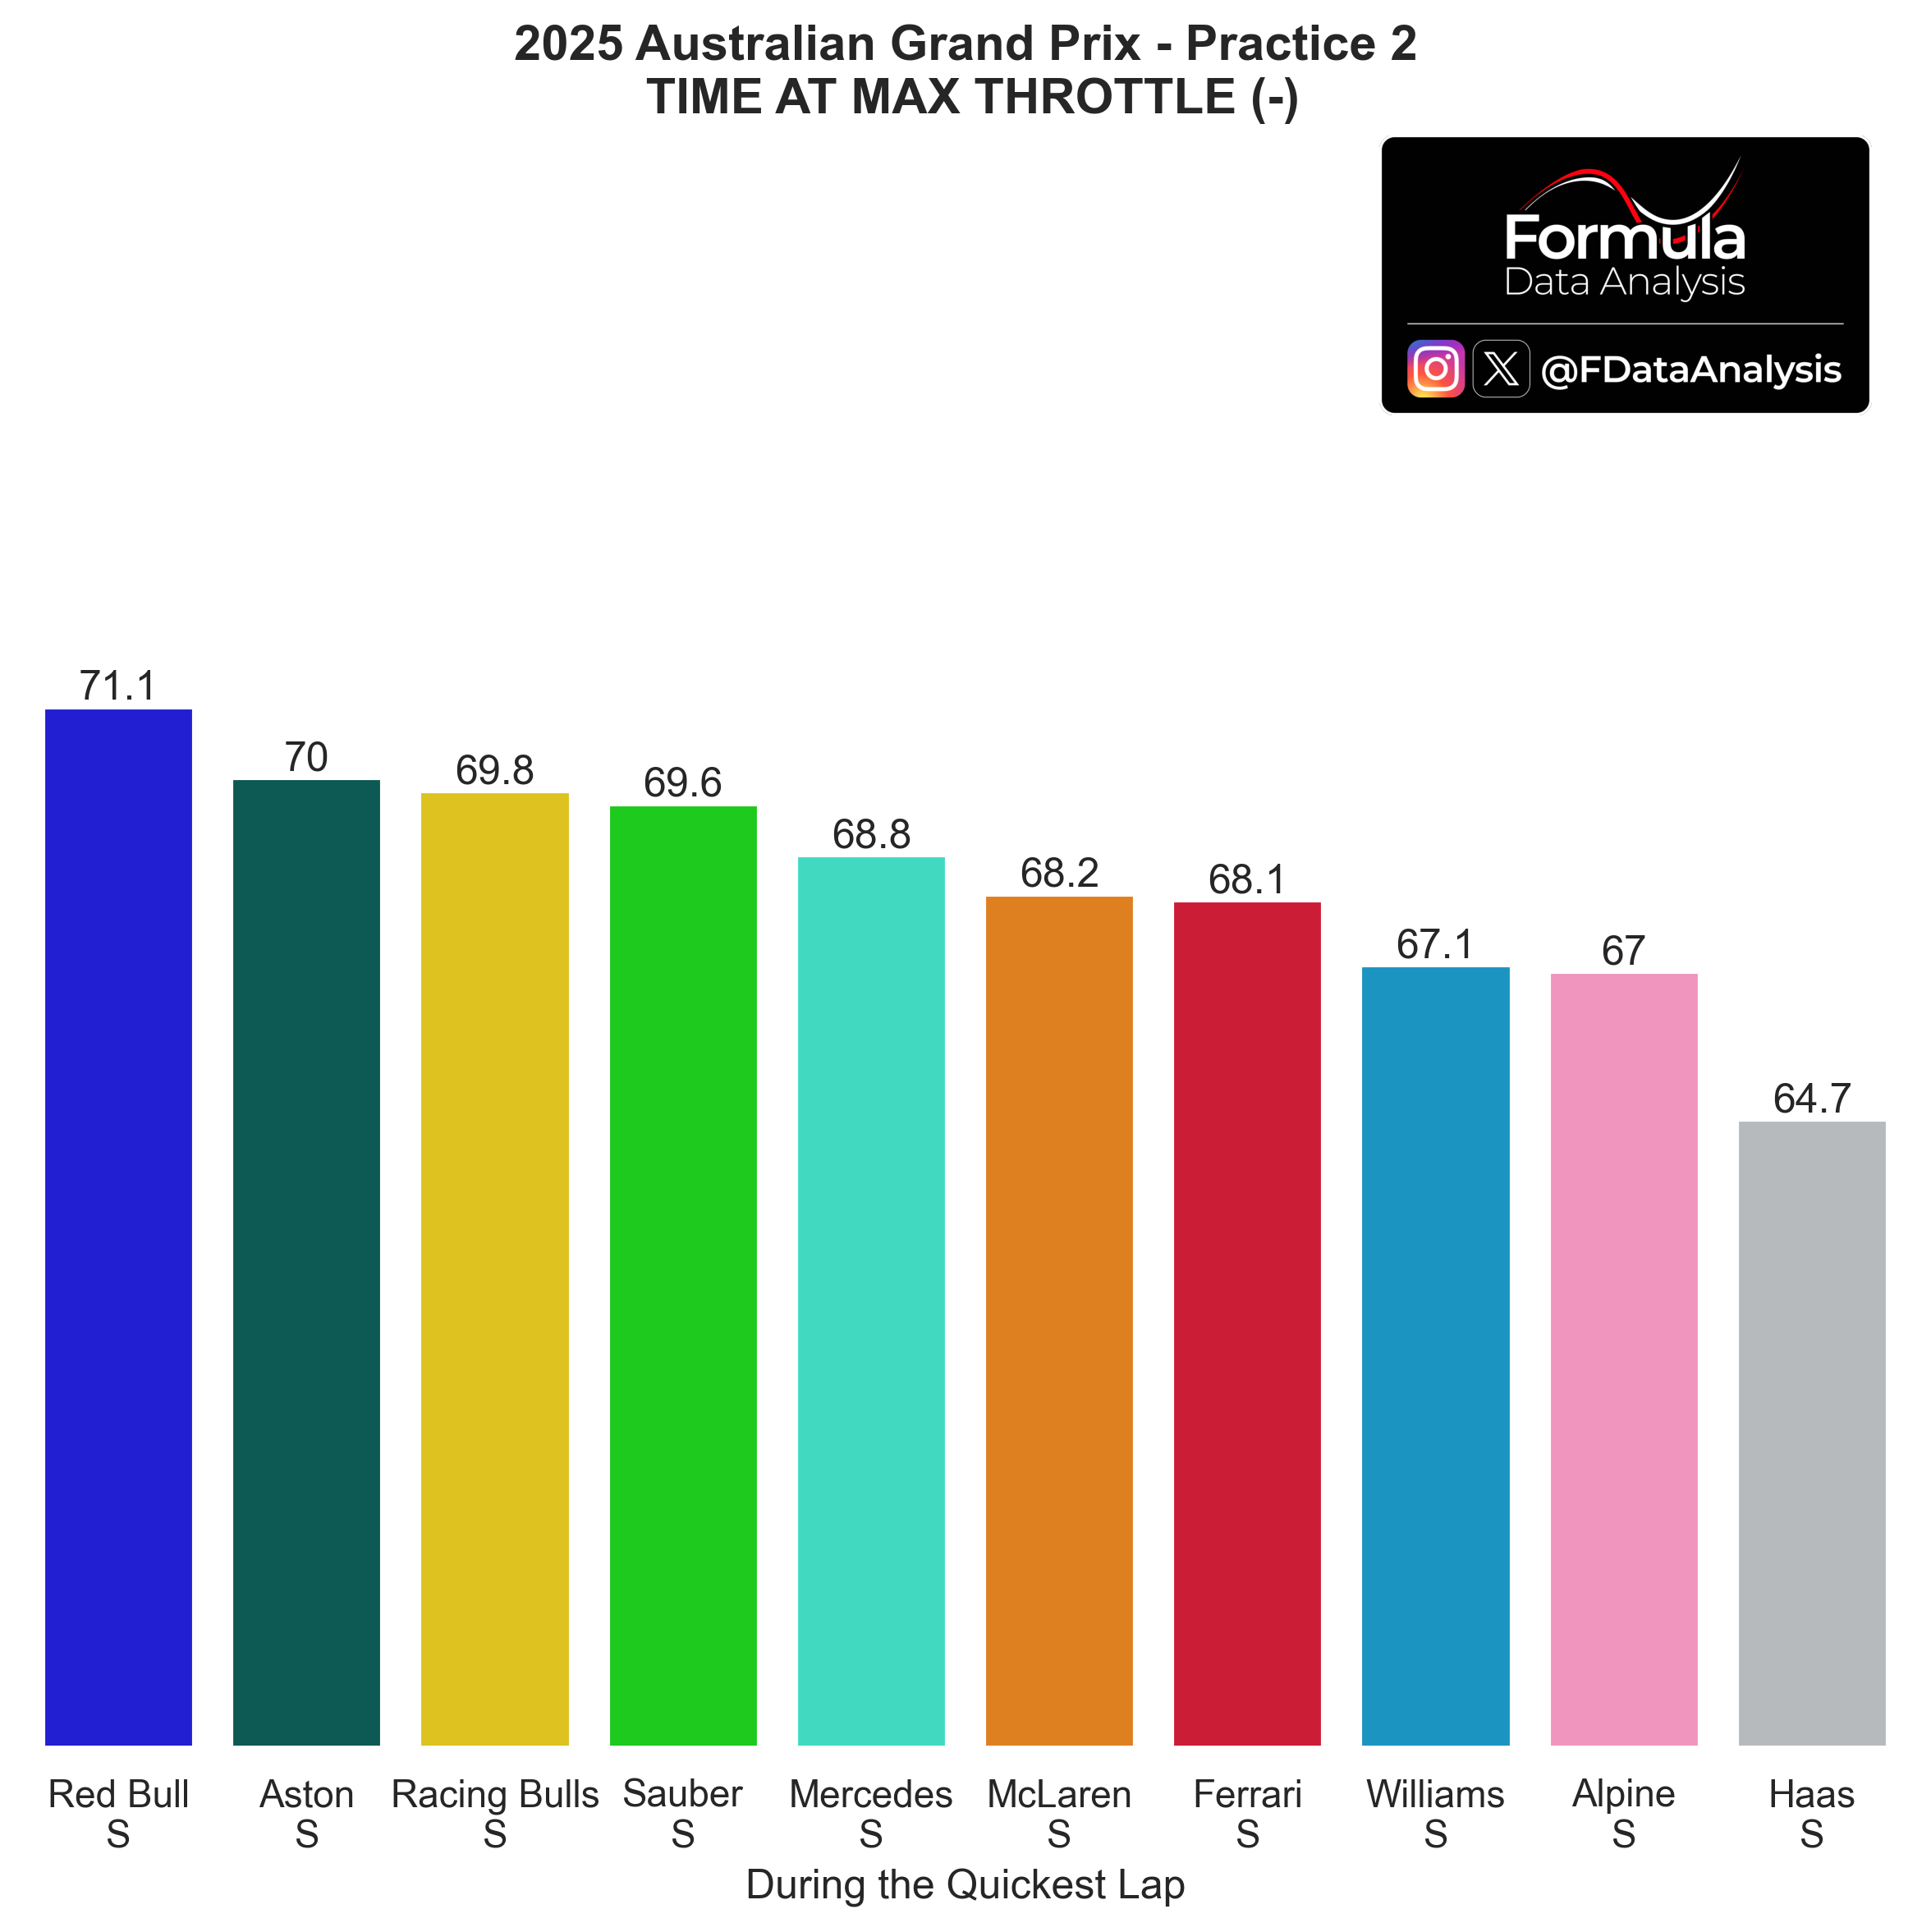
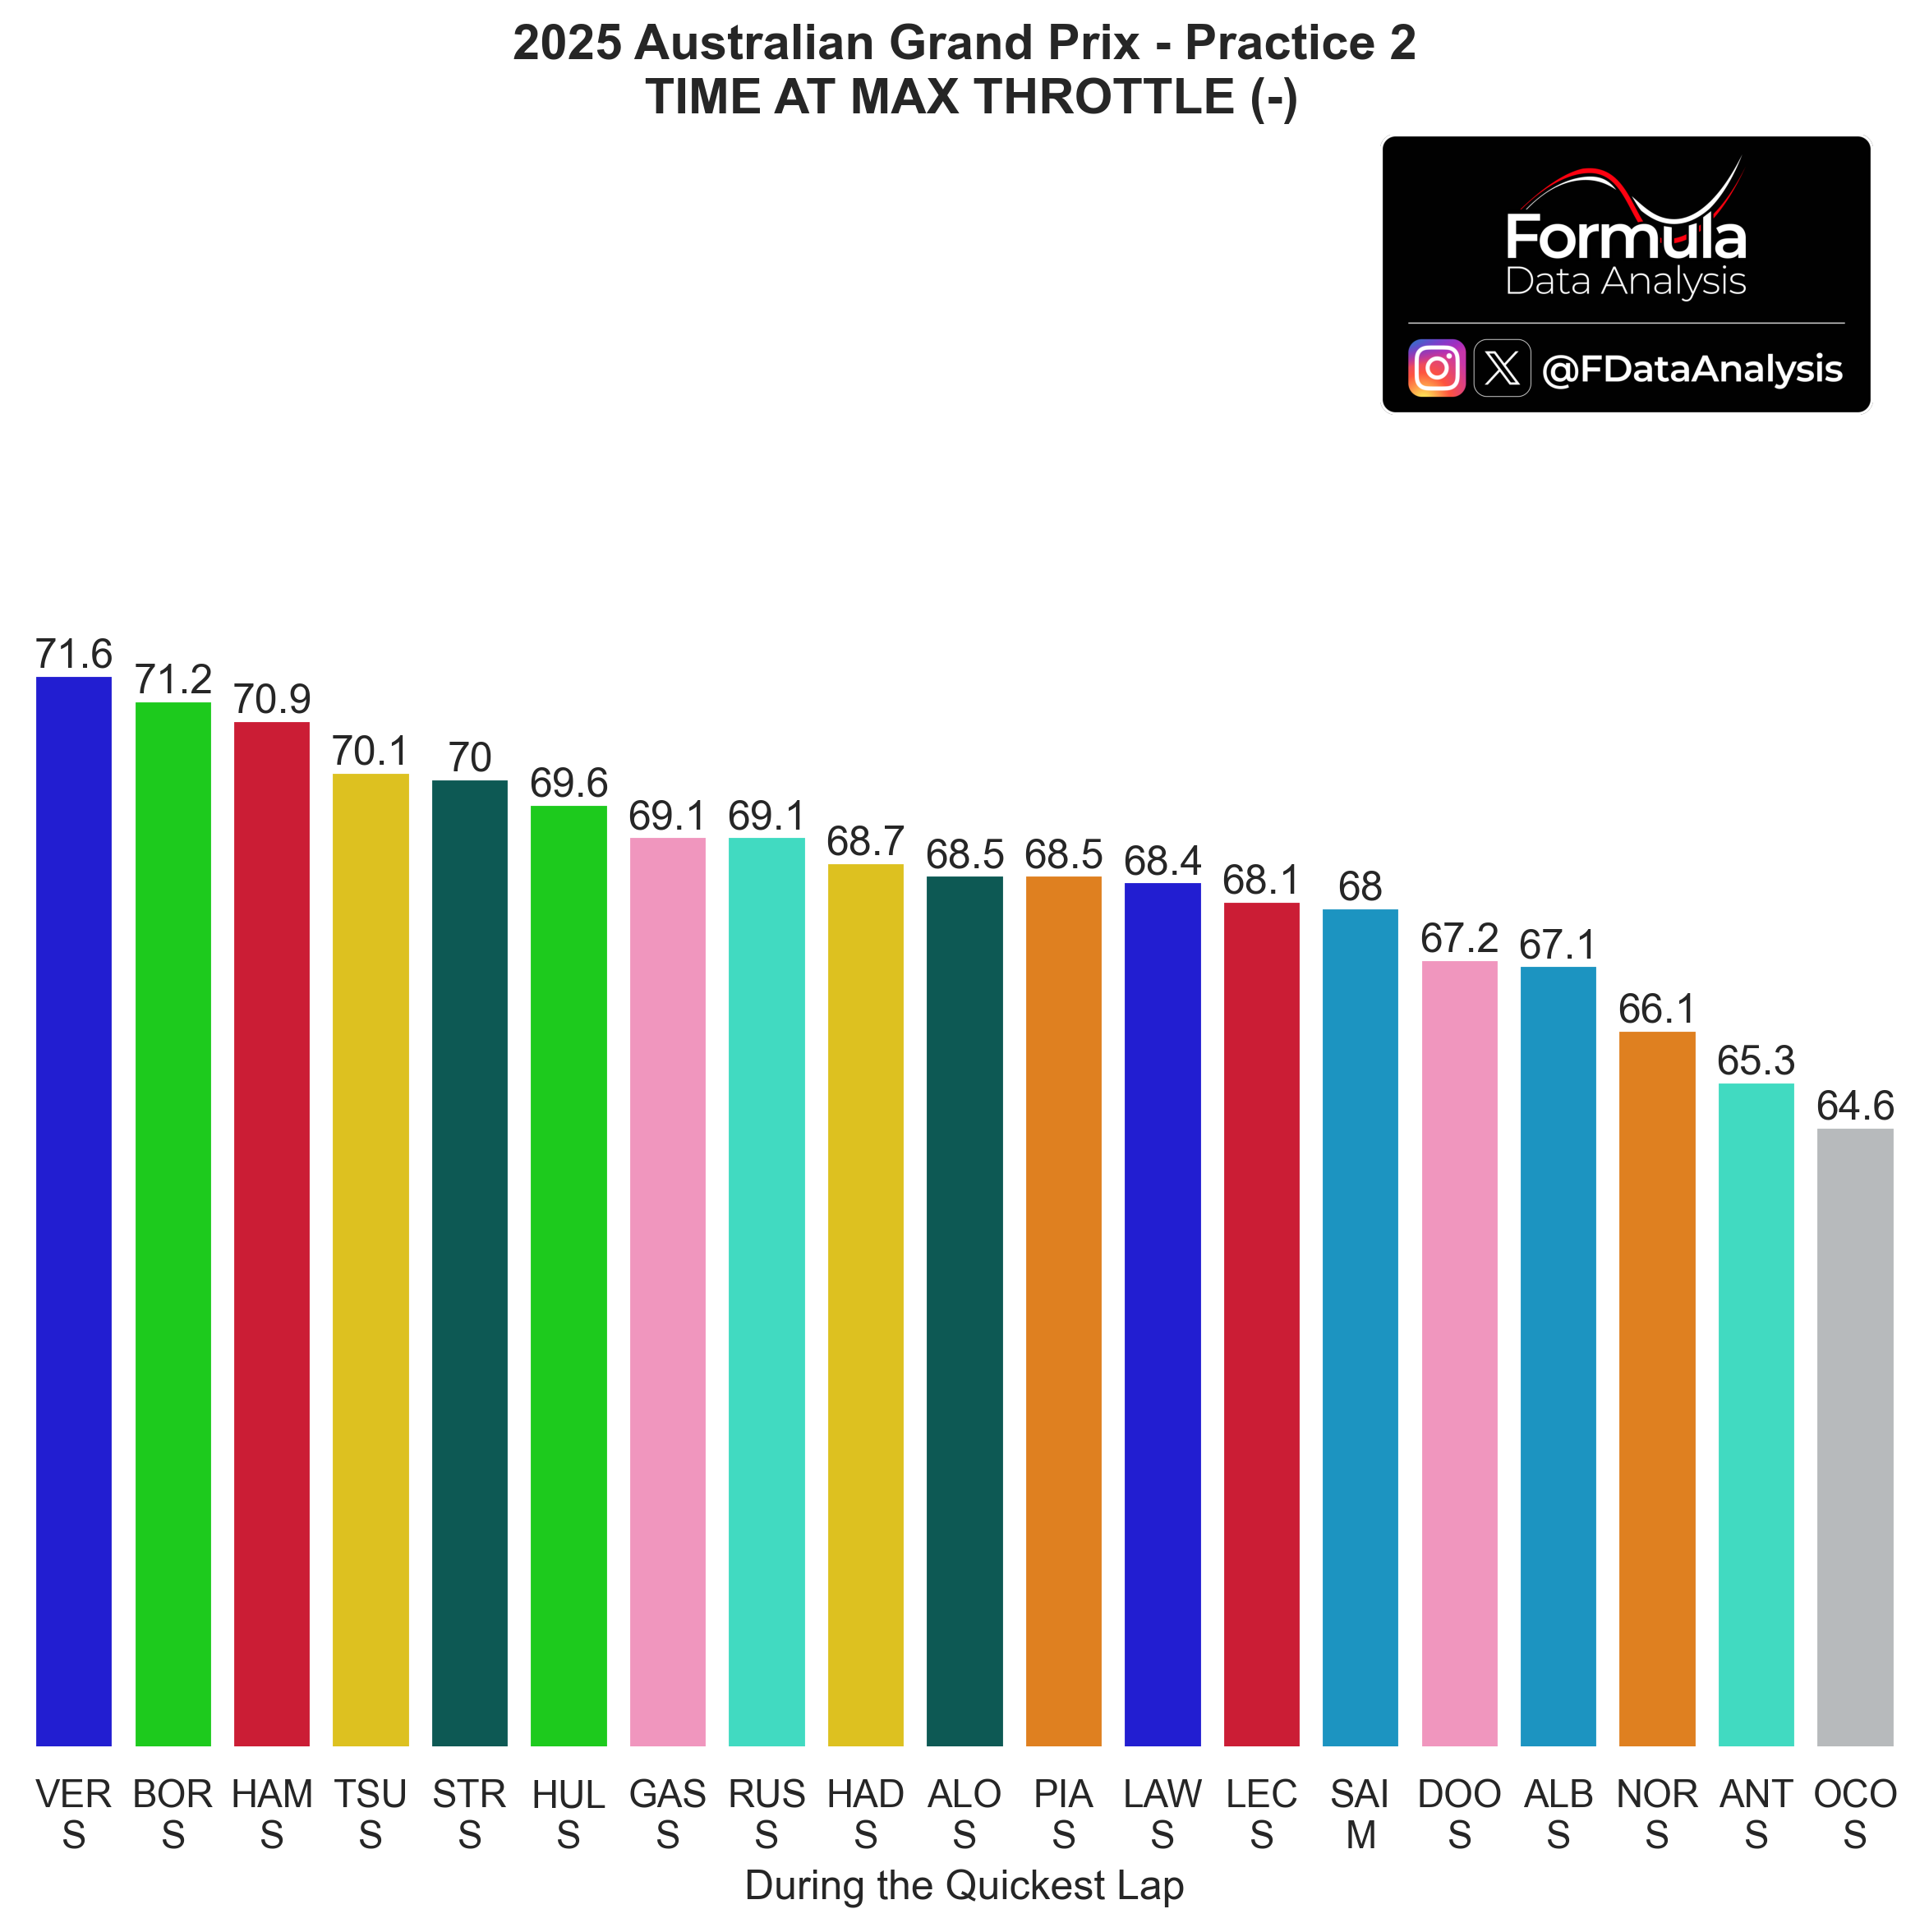
How to read: The graph shows the percentage of the time the driver spent at full throttle. Spending more time at full throttle is correlated with a weaker Power Unit mode, more drag, less fuel, and better grip (especially concerning traction out of the corners). This analysis is used together with the lap time produced by each driver and the corresponding top speed achieved to pinpoint which teams could be on a lower engine mode. For example, if a team produced a lap time worse than usual, but they are topping the charts concerning throttle usage, it's pretty likely that they were running a more conservative engine mode. Looking at the top speed achieved could confirm it.
Red Bull could stay full-throttle for the longest time even though the car was lacking grip and its top speed was solid. This can only mean one thing: the team is running less downforce than most (which makes their drag low) and a PU mode which is lower than most. Their top-speed advantage is more due to low drag than to high power and should gain more performance than others once they turn up the power. Can never count VER out, especially in a wet race, but McL and Ferrari will still have the edge in the dry quali. Alpine was running even less drag and downforce and a more powerful engine mode, hence their low figure
Same chart, per driver:
Race Pace
Long Runs


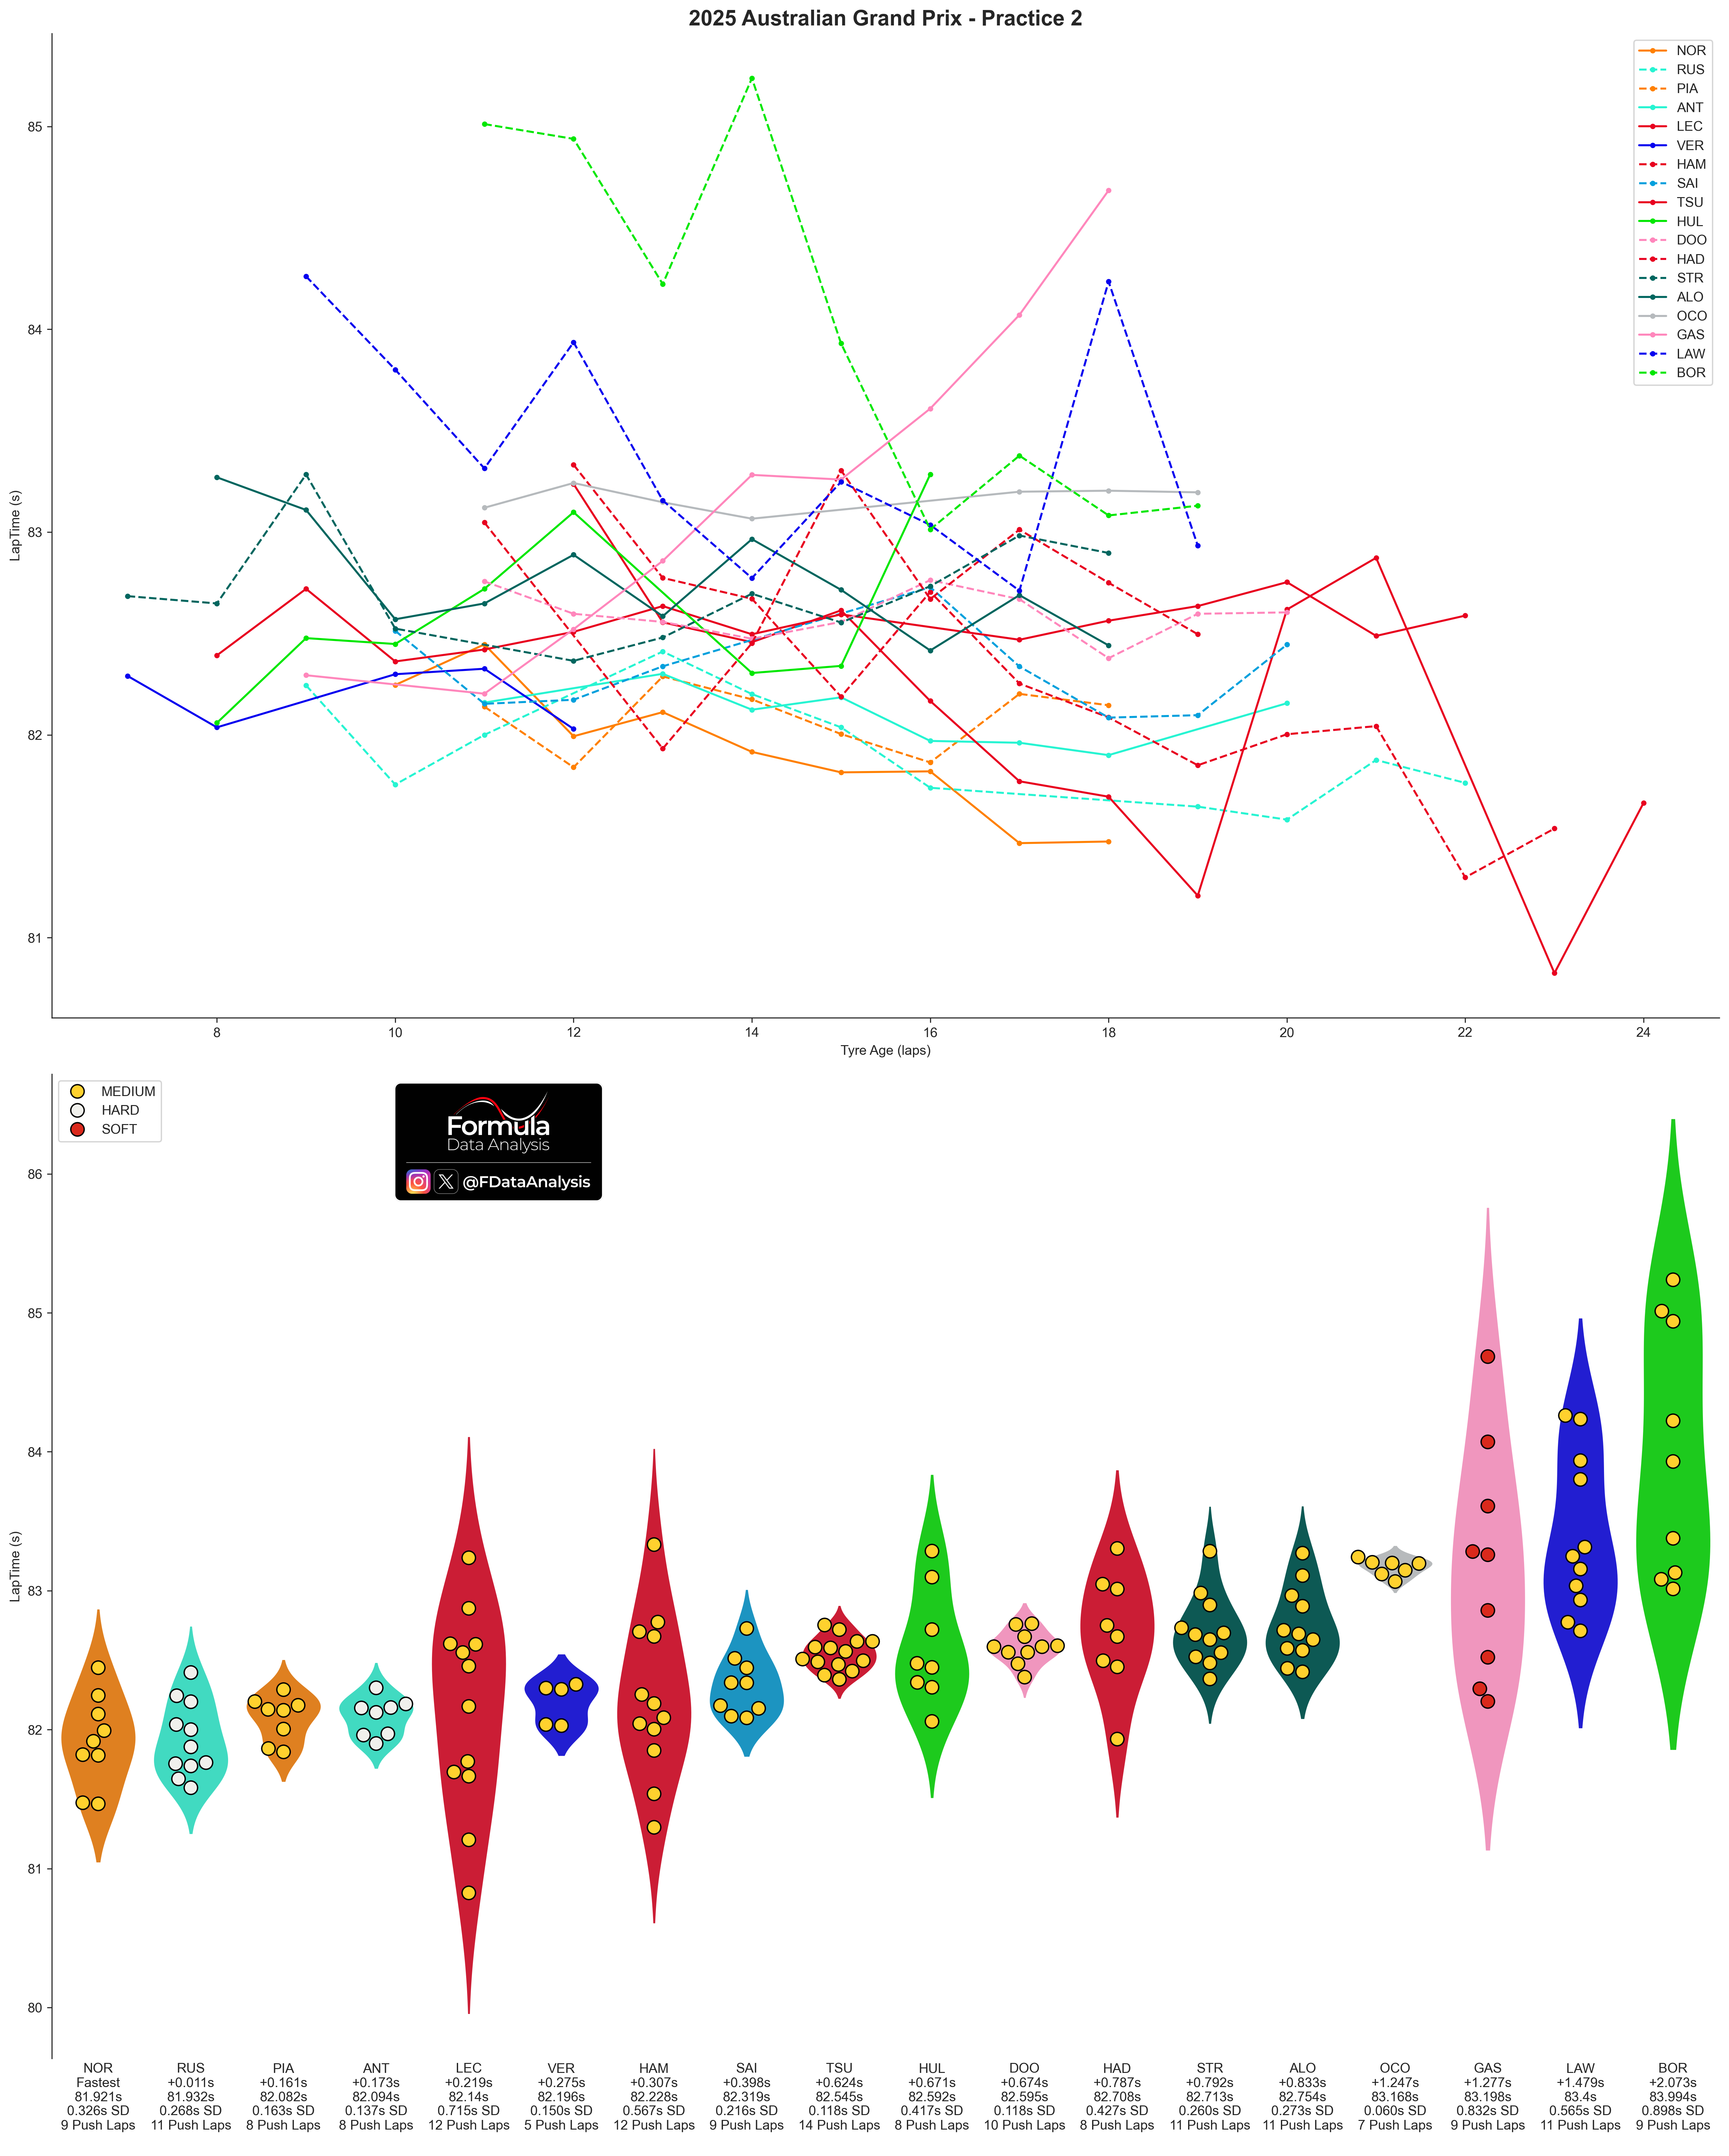
How to read: The chart shows the distribution of lap times during each team's long runs. A long run only includes segments of at least 5 consecutive laps run on the same compound without pitting or slowing down.
Don't expect this to matter much come race day, as rain will likely fall, shaking out the running order. Instead, it should be more indicative of each car's overall long-run performance on tracks similar to this under dry conditions
Top 5 Teams, based on WCC (You will find all the data at the bottom of the plot)
McL and Mercedes were practically matched, and Mercedes' stints were longer, too! Mercedes was on Hards, however, which might have allowed them to push a bit more. In terms of outright performance, however, the Mediums should be quicker. Ferrari's stints were 2-3 tenths slower, but their laptimes improved throughout the stint, indicating excellent wear and good performance margins. Aston was around 8-tenths behind. VER was between the two Ferrari cars but on a much shorter stint.
Bottom 5 teams, based on WCC:
Williams is a real threat: SAI was just 4-tenths behind NOR! HUL and DOO were quick, as well: the latter (and OCO) had incredible consistency! (They were likely driving to a delta)
Overview of all teams:
Pace Last Year
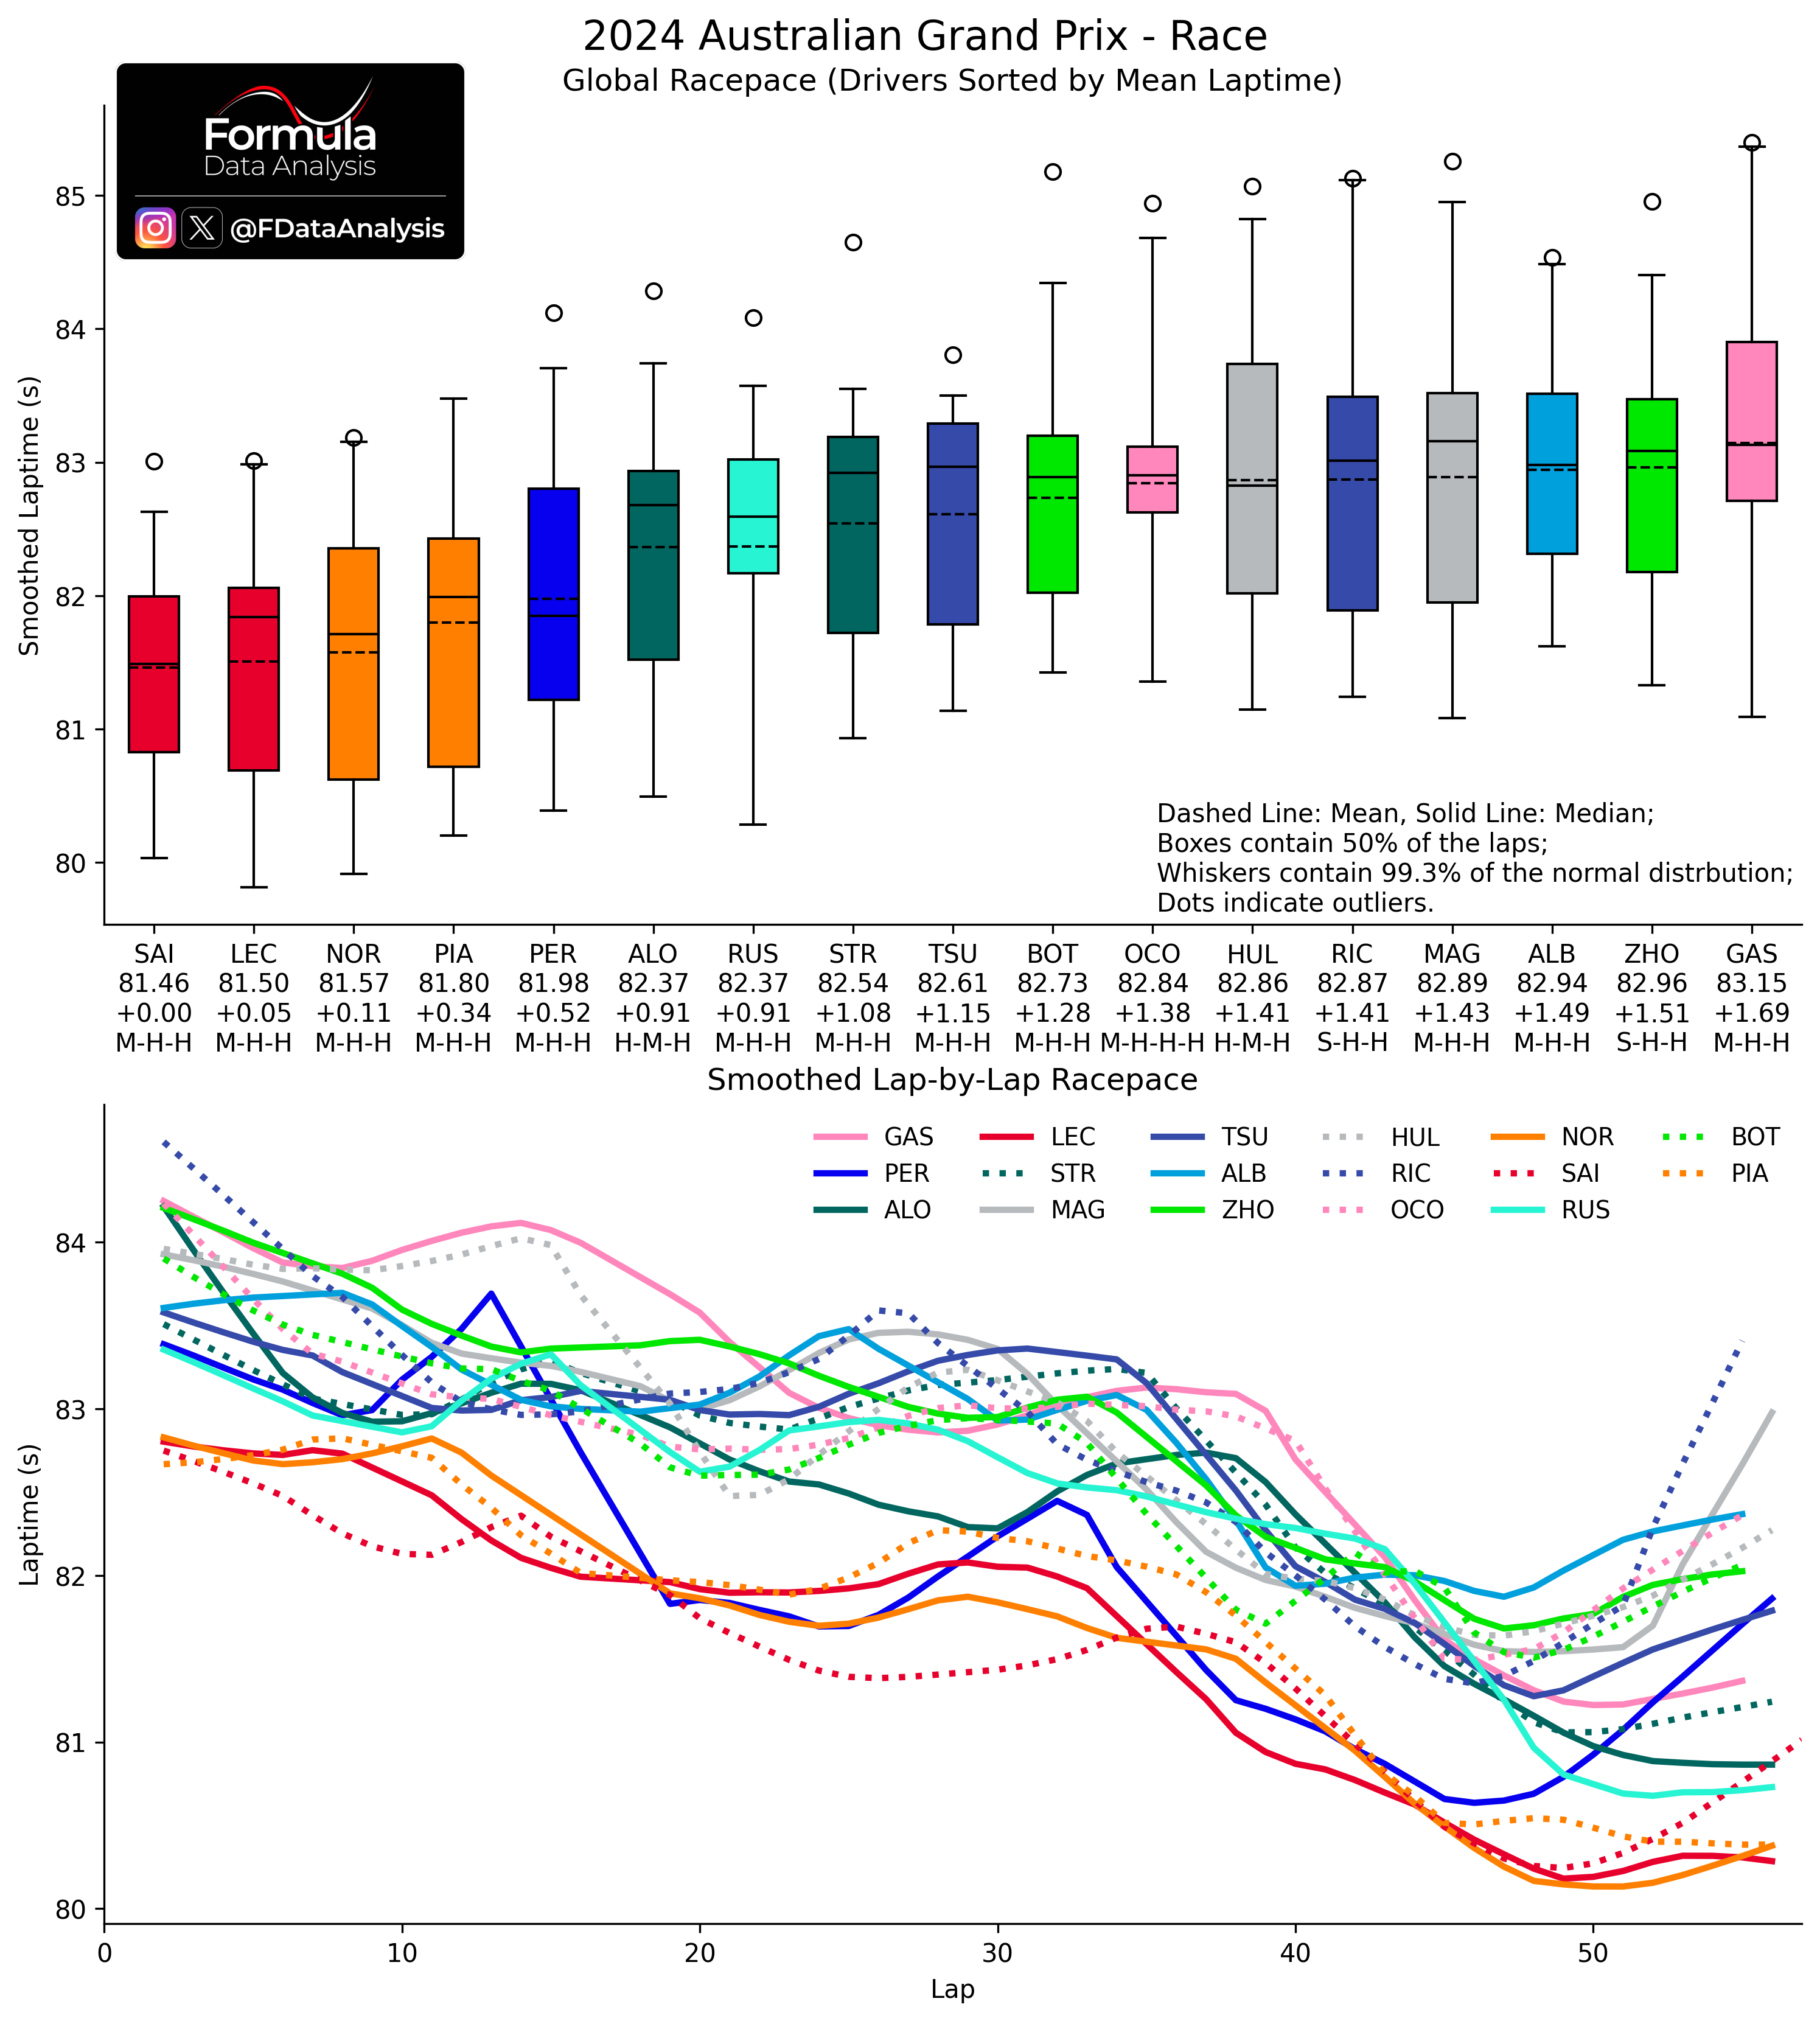
How to read: The upper plot shows the synthesis of each driver's pace during the race. The lower plot shows the (smoothed) evolution through the laps. Each bar contains the central 50% of the distribution: the shorter it is, the more consistent the pace. Inside it, the solid line indicates the MEDIAN (how quick was the TYPICAL lap), while the dashed line indicates the MEAN (how quick was a lap ON AVERAGE). The whiskers include all the laps from a driver which are not uncharacteristically slow for that driver: the lower whisker, in particular, shows that driver's quickest lap. The mean lap time is indicated below each driver's name, and below that is the gap to the quickest driver. The bottom line indicates the tyres used.
As VER retired, the fight was between Ferrari (who was ultimately quicker) and McL. No other team was in contention for the fight: PER, Aston, and Mercedes were all significantly slower. Alpine and Williams struggled significantly.
My prediction
Quali
Overall, this is my expected running order concerning quali (considering the placement of the best driver of each team, so the ultimate car’s potential). Teams on the same line are too close to call:
Ferrari/McLaren
RedBull/Mercedes
Williams
Racing Bulls
Alpine
Aston
Sauber/Haas
Race
The following prediction assumes a dry race (unlikely) and is based on the expected starting prediction + the long runs from FP2
Ferrari/McLaren
Mercedes
Red Bull (very close to Mercedes)
Williams
Alpine
Racing Bulls
Aston/Sauber/Haas
In case the race is wet (likely), the balance should shift in favor of teams running a more loaded setup (Ferrari, Williams, Mercedes) compared to those running a more unloaded one (Alpine, Red Bull). However, teams can still change it before quali. Also, drivers who are very strong under the rain (as VER) will be advantaged!
Will this prediction be confirmed? And what is yours?
Enjoy the content, and thank you SO MUCH for your support! And check the data repository for more analyses
Mirco/Formula Data Analysis