

Dear F1 Data Analysts,
F1 was back to racing, offering an unpredictable event! McL dominated the performance, but VER's and RBR's excellent management and strategy (and PIA's mistake) kept them in the battle for the win. Behind them, Mercedes had a very solid race (rookie ANT included), getting as many points as McL. Fantastic result for ALB, STR, and HUL. Ferrari will have a lot to analyse to understand what went wrong during the weekend: there might be a technical explanation (which I try to provide below), but surely, their strategic mistake is inexcusable. Read on for a deep dive into the data!
Starting Grid and Results
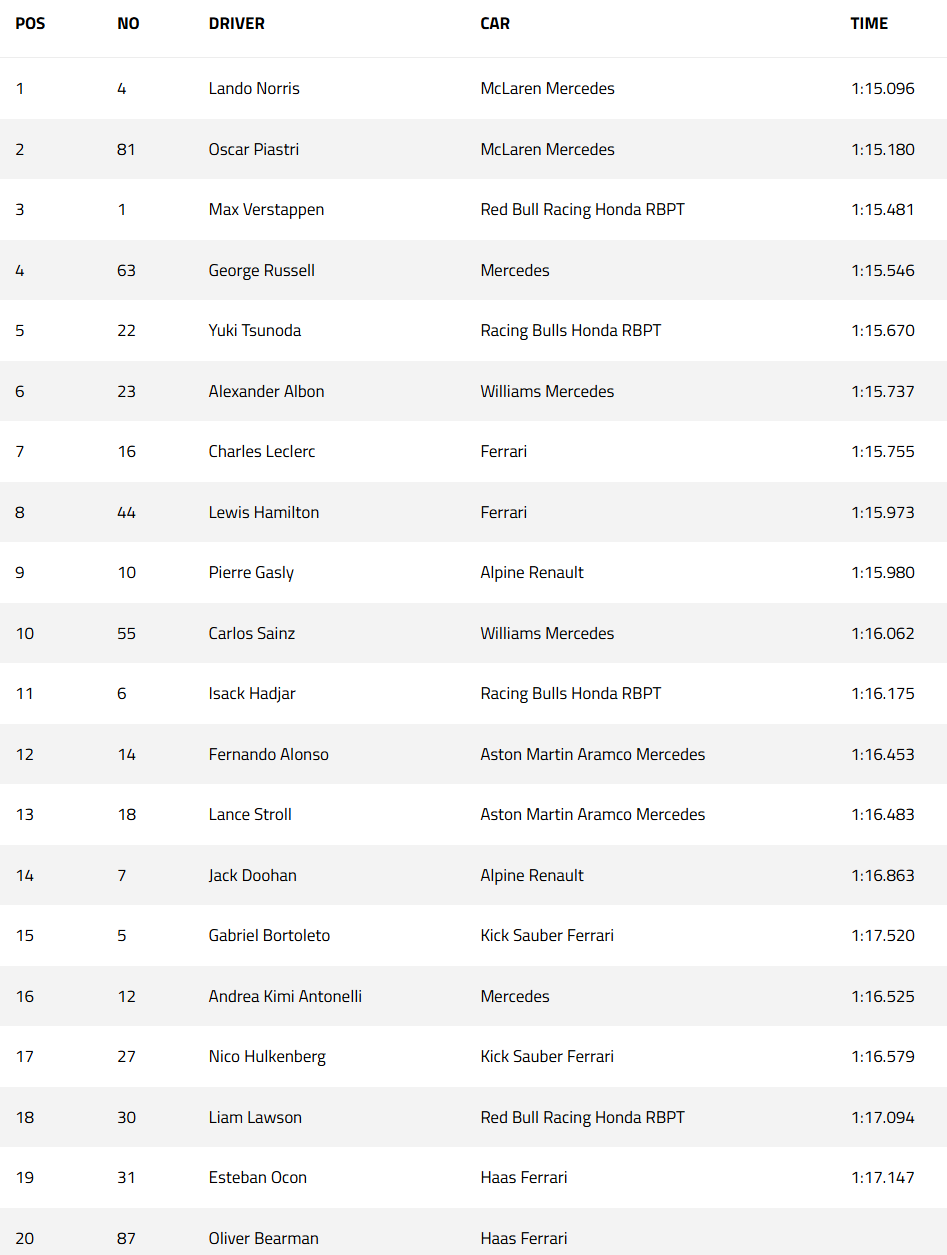
Here is a quick look at the starting grid to provide context to the results:
A McL front-row lockout, leading VER and RUS (the two drivers who eventually ended on the podiums together with the polesitter). Behind them, TSU and ALB: brilliant qualifying for both drivers and teams, who are in for a very positive season (especially Williams, which has already provided robust proof of their strength in most sessions so far). The 4th row was all red, as the Italian team could not perform well in S3 in qualifying. LEC's cryptic words made many believe that the team was running a wet-focused setup, but their unimpressive race pace points toward another reason (being forced to raise the car to avoid excessive plank wear). GAS (who finished 2024 on a very positive note) and SAI completed the top 10. ANT started 16th after being knocked out in Q1, while LAW and BEA started from the pitlane (and could, therefore, adjust setup as needed)
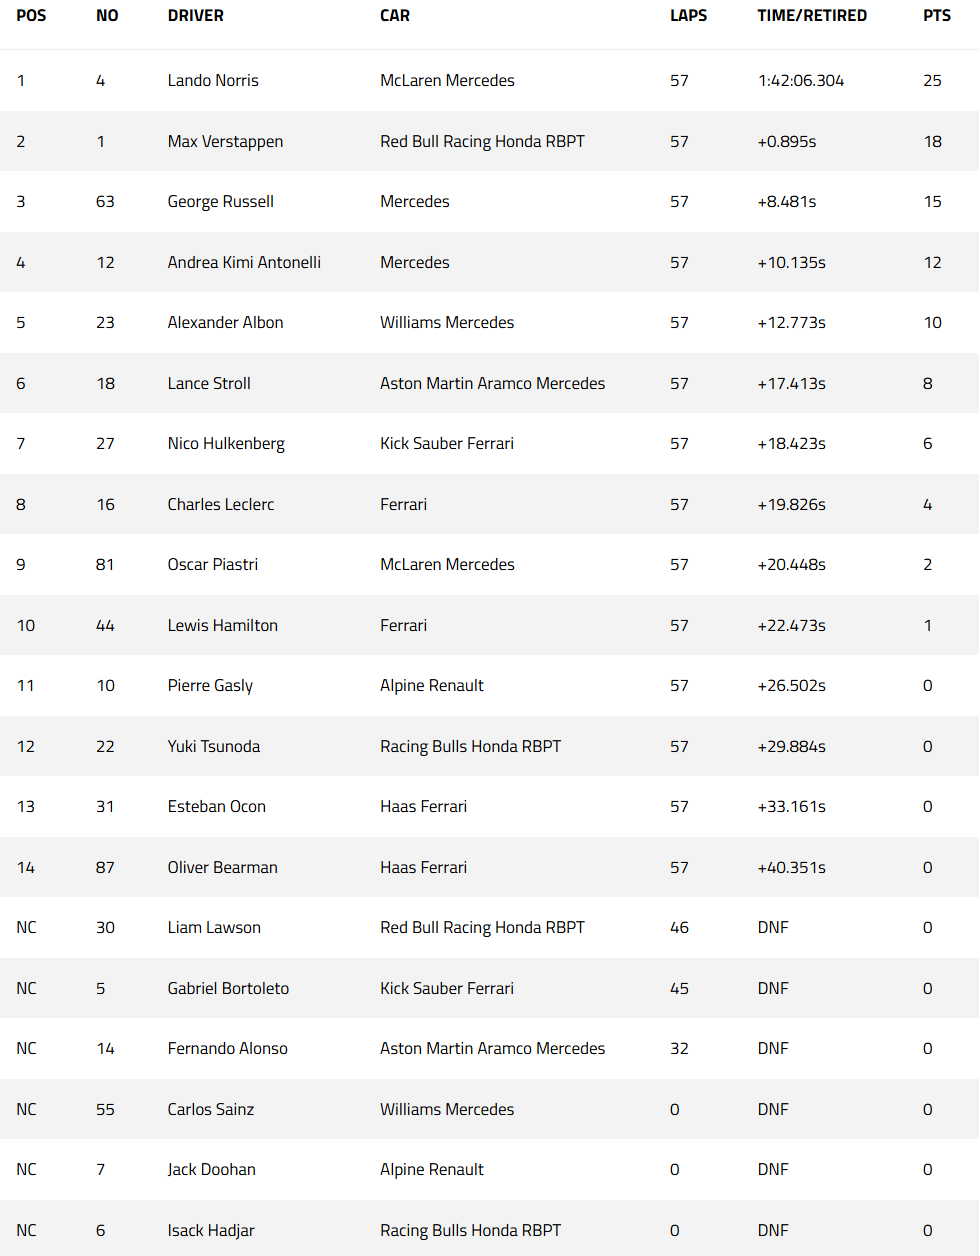
Below is the final classification:
NOR won the first GP NARROWLY, by edging VER by less than 9 tenths! This, however, is not representative of the true picture: NOR (and PIA) was much quicker than VER for most of the race, but the chaotic strategies and the SCs compacting the field made it look closer than it was. The two Mercedes cars finished with a significant gap: 8.4s to NOR for RUS and 10.1s for ANT. Mercedes now has the same points (27) as McL! RUS avoided mistakes and ran steadily to finish P3. It was an excellent debut for ANT, who started P16 and finished just below the podium!
ALB/STR/HUL scored more points than they could have dreamed of: Albon drove brilliantly and was aided by what's now a very solid racecar, STR made his wet-driving abilities shine, and HUL/Sauber maximised their outcome through strategy and safe, quick driving.
A very disappointing first race for Ferrari: LEC finished P8 and HAM P10, getting just 5 points in total. The track and weather conditions were unrepresentative, and per Ferrari's admission, they had to sacrifice performance, yet I don't expect them to fight with McL soon. PIA could overtake HAM AFTER being lapped!
Many drivers, more (SAI/ALO) or less experienced (LAW/BOR/DOO/HAD) retired due to mistakes in this chaotic race.
Tyres Used and Strategy
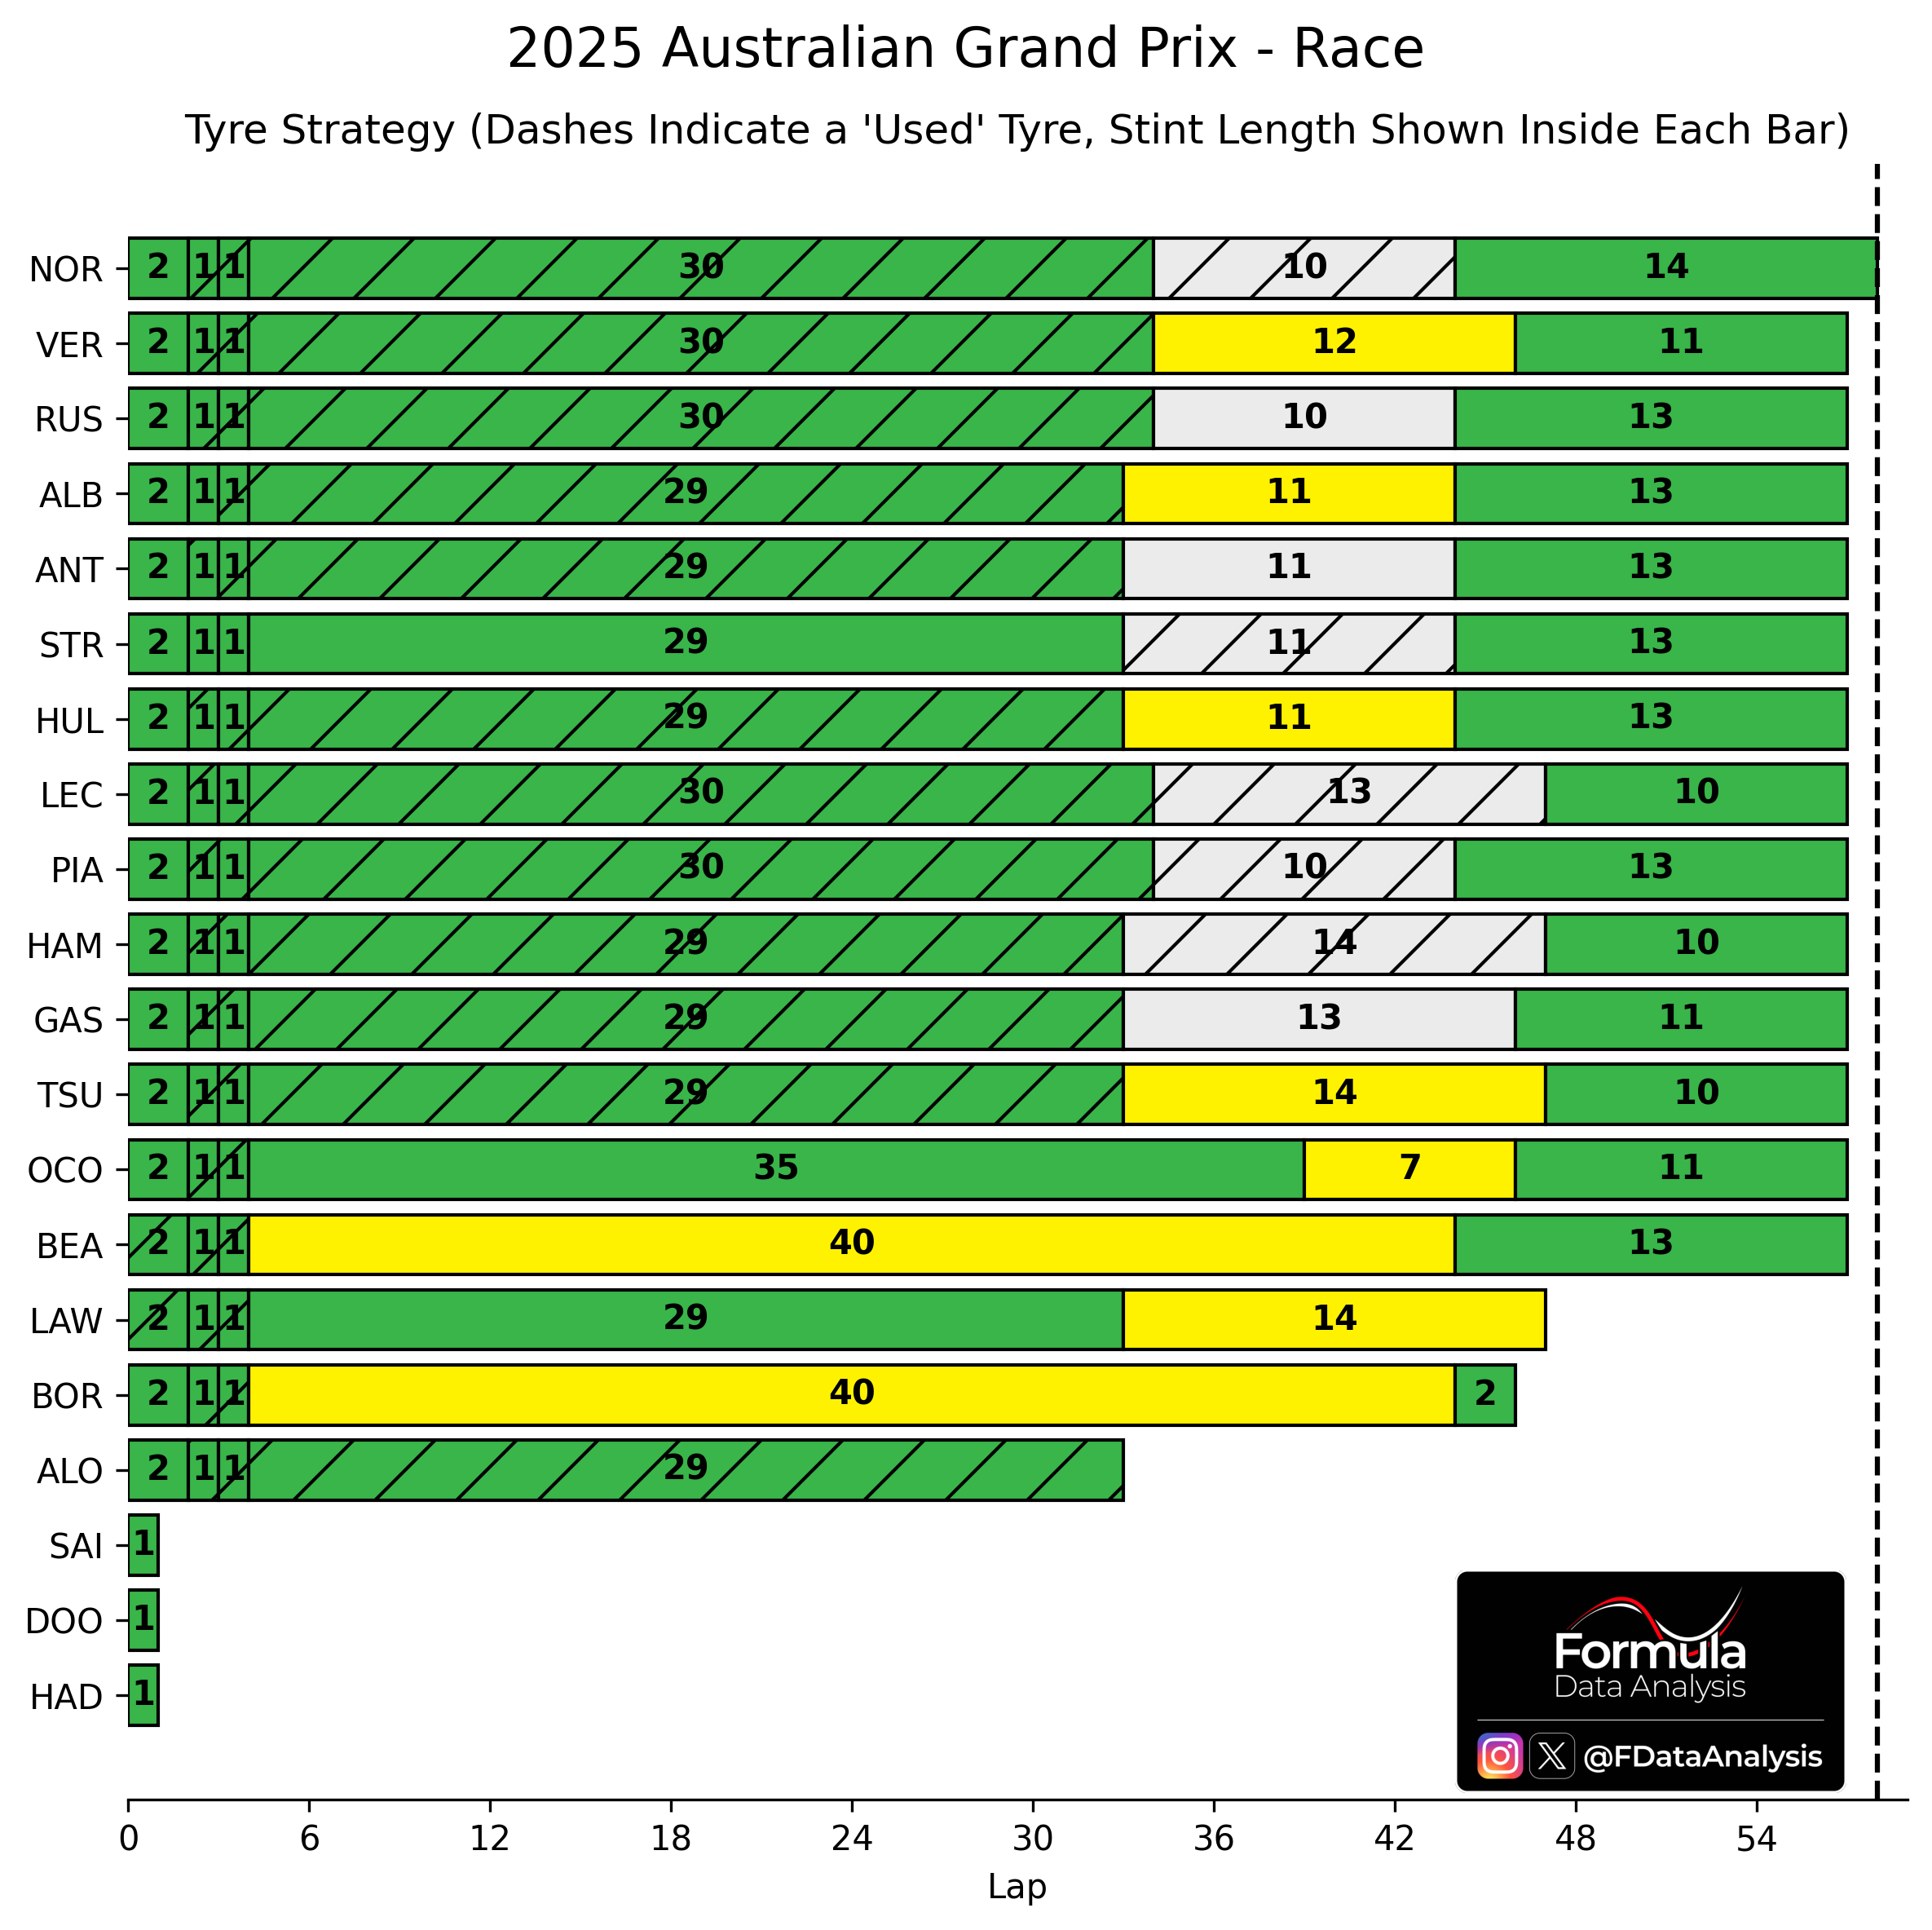
How to read: each bar represents a distinct stint; the number inside the bar is the total number of laps driven on that compound; a dashed bar means that the tyre set was a used one.
All drivers started on Intermediates (a new set for everyone except for BEA and LAW) (Laps 3 and 4 are considered a 'pit lap' as the drivers followed the SC into the pits, but they didn't change tyres except for BEA and BOR who bet on Mediums). Most drivers put the slicks on L33 or L34. Most opted for Hards, which are harder to heat up but are affected by less graining. Lastly, everyone finished the race on Inters: most drivers put them on L44, but LEC/HAM/TSU waited as late as L47, losing huge time and many places due to that gamble.
Longest stint: 40L on mediums by BEA and BOR. The longest stint on Inters was 35L by OCO
Race Pace
How to read: The upper plot shows the synthesis of each driver's pace during the race. The lower plot shows the (smoothed) evolution through the laps. Each bar contains the central 50% of the distribution: the shorter, the more consistent the pace. Inside it, the solid line indicates the MEDIAN (how quick was the TYPICAL lap), while the dashed line indicates the MEAN (how quick was a lap ON AVERAGE). The whiskers include all the laps from a driver which are not uncharacteristically slow for that driver: the lower whisker, in particular, shows that driver's quickest lap. The mean lap time is indicated below each drive's name, and below is the gap to the quickest driver. The bottom line indicates the tyres used: only compare directly drivers who did the same number of pit stops, as using more tyre sets makes one faster on average, at the expense of more total time being lost in the pits.
The race pace analysis reveals McL's superiority: although NOR finished the race closely in front of VER, his pace was miles better (0.63s/lap quicker). In this sense, VER maximised his chances by making just one minor mistake and executing his team's good strategy in the chaotic, changeable conditions. PIA's pace was closer to NOR than it looks here, as he was a bit stuck in traffic in the last part of the race after his spin. Still, he rejoined one lap down and still finished P9, which highlights his impressive pace. Mercedes was the clear 3rd force in Australia: RUS was in a land-of-no-one between VER and LEC, finishing on the podium. His rookie teammate ANT drove flawlessly, recovering from his bad qualifying and finishing P4!
LEC was only the 6th fastest, preceding ALB, TSU, and HAM. His pace was good enough for a P6 finish, but was screwed by strategy. Notably, STR was just 11th fastest and HUL 12th fastest, yet finished P6 and P7 respectively: they really maximised their outcome via steady driving and good strategic calls! Haas was dead last, not aided by the wear choice of Mediums early in the race.

Top Speeds
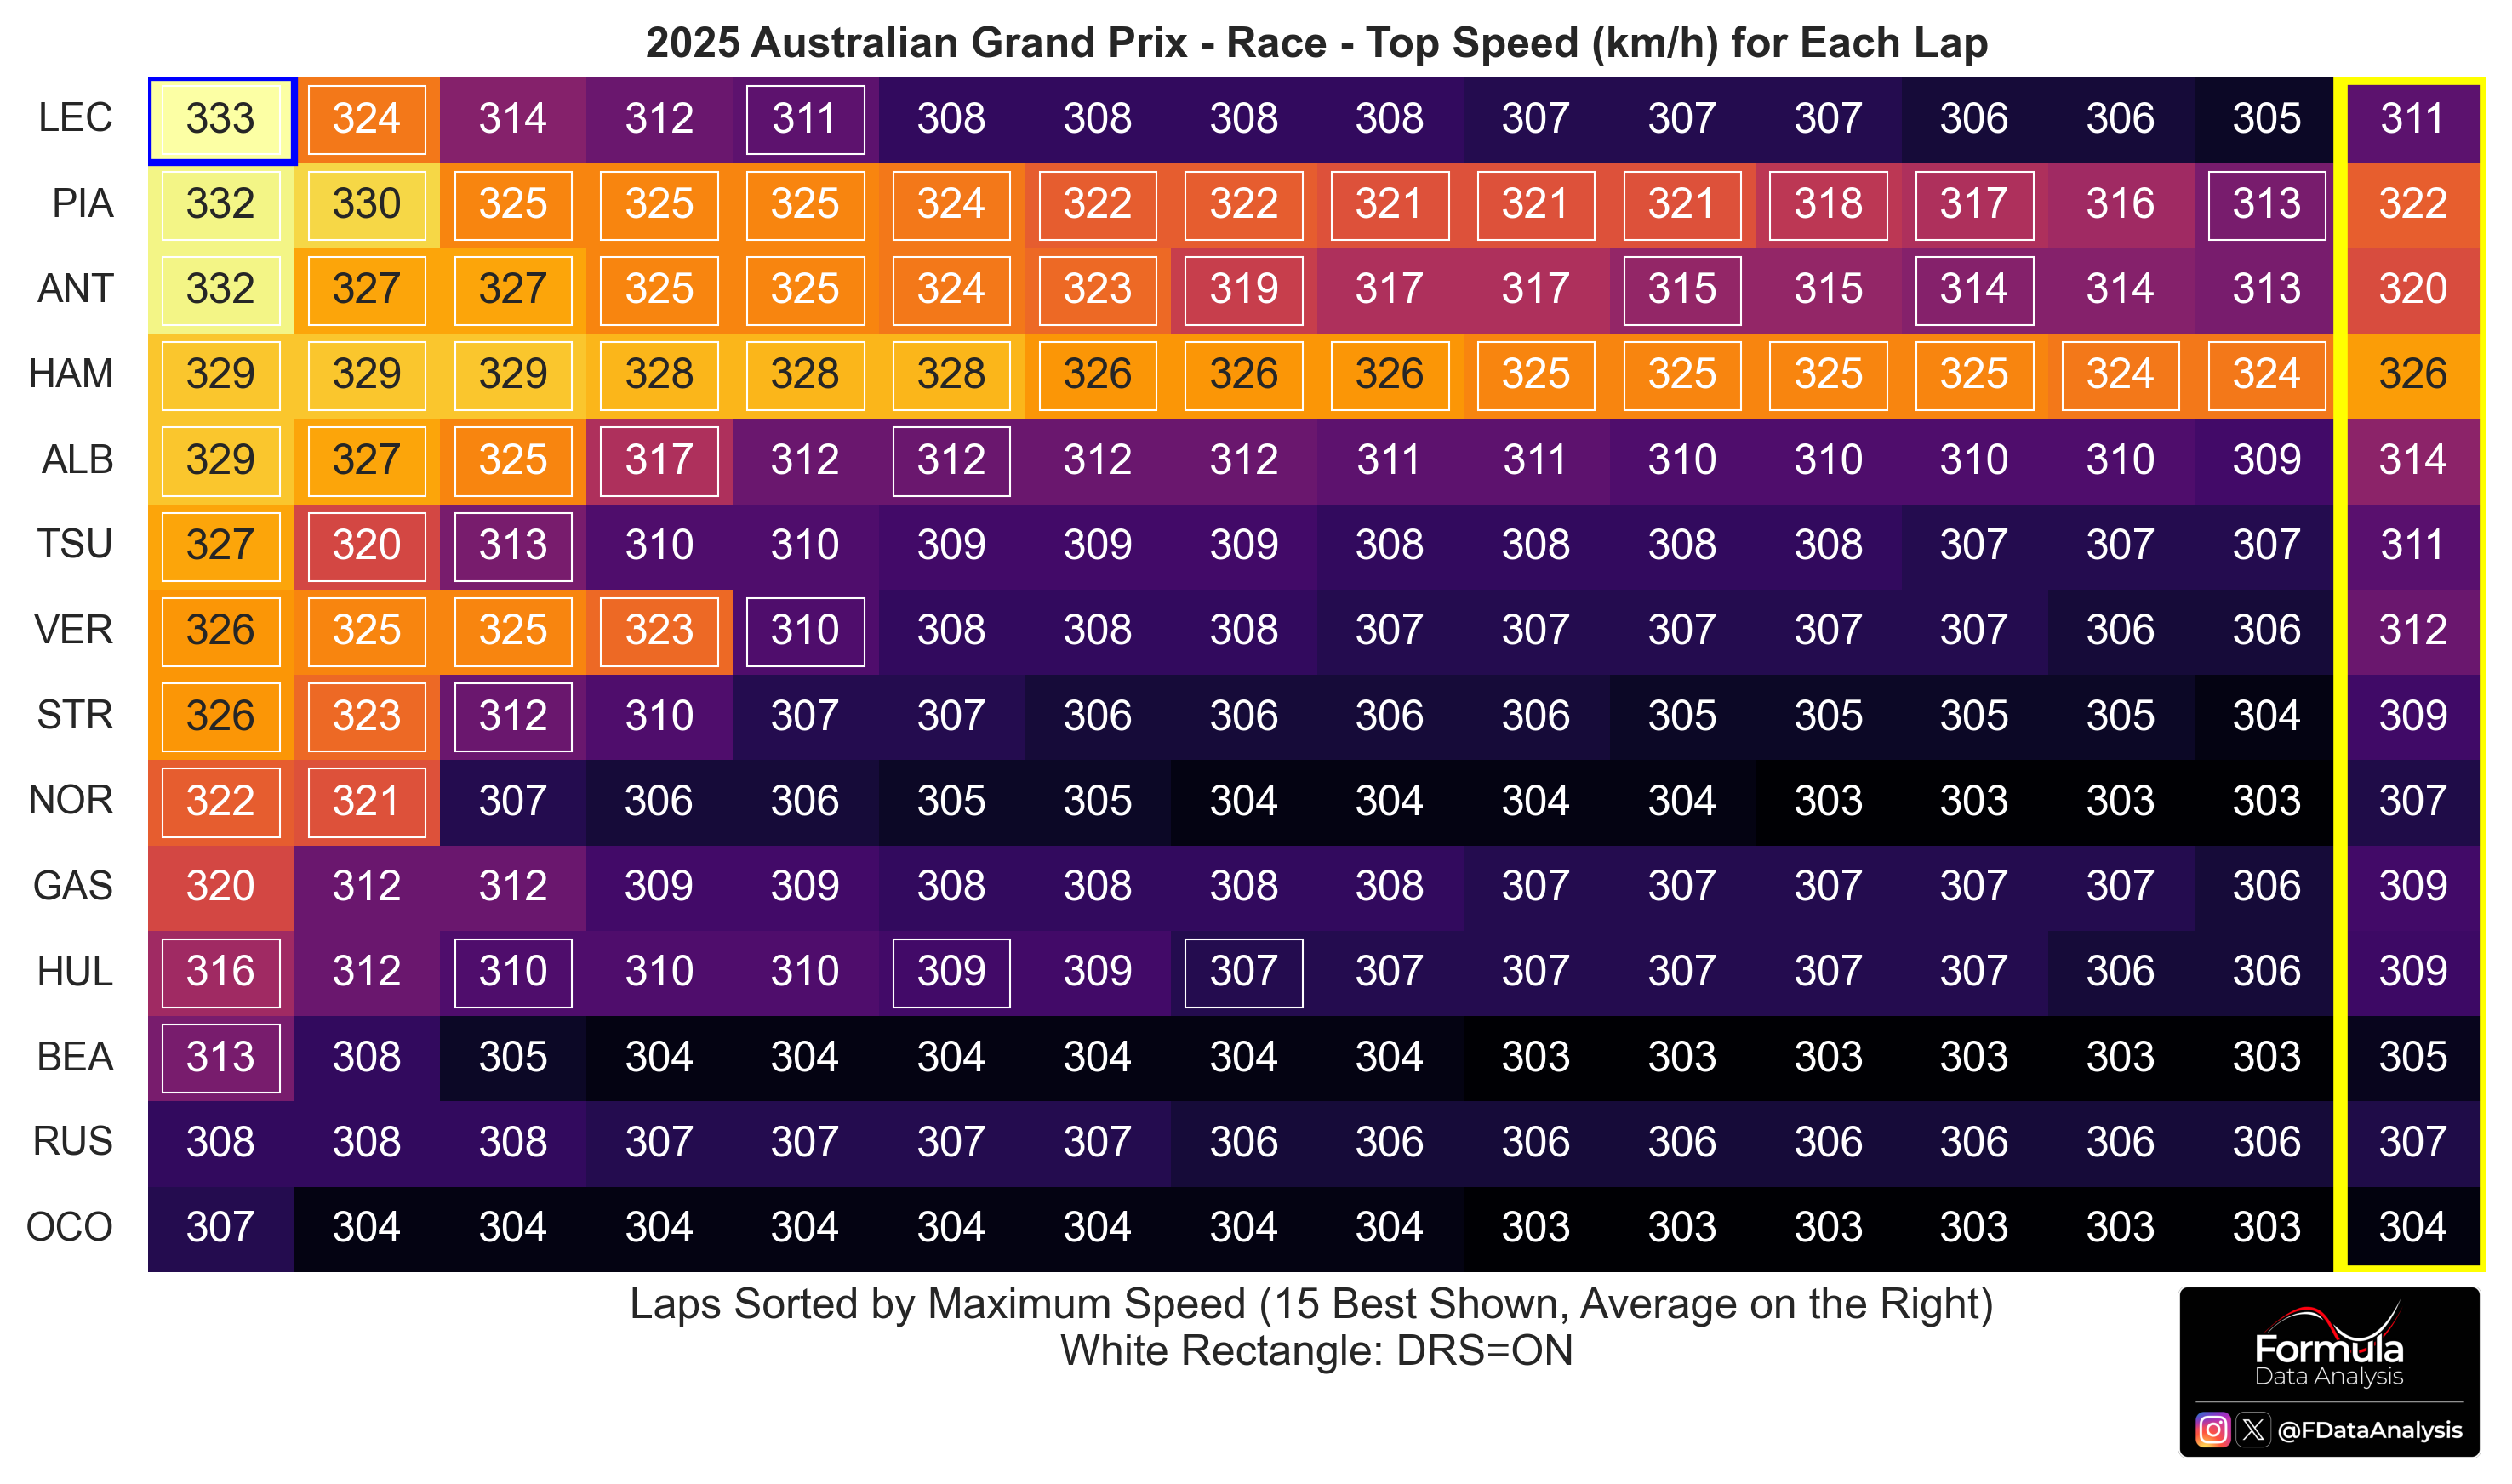
How to read: the chart shows the highest top speed values reached by each driver during the race. The drivers are sorted in descending order of highest to lowest top speed. For a given driver, the top speeds in each lap are sorted from highest (left) to lowest (right): the highest 15 values are shown. The column on the right shows the average of these 15 values. The values relative to DRS being active are surrounded by a white box.
Ferrari topped the top-speed game: LEC reached the highest top speed (333km/h), while HAM's average in his 15 best laps was the highest (326km/h). Although the latter was aided by frequent tows and DRS opportunities, Ferrari seemed to be faster (in terms of top speed) in the race than in qualifying: definitely what you would not expect from a 'wet-focused' setup! As the performance in the race was as disappointing as the one in qualifying, Sky Italia's insights (about Ferrari being forced to raise the car to avoid excessive plank wear) seems plausible: it would reduce downforce significantly, making it modest despite their more loaded wing.
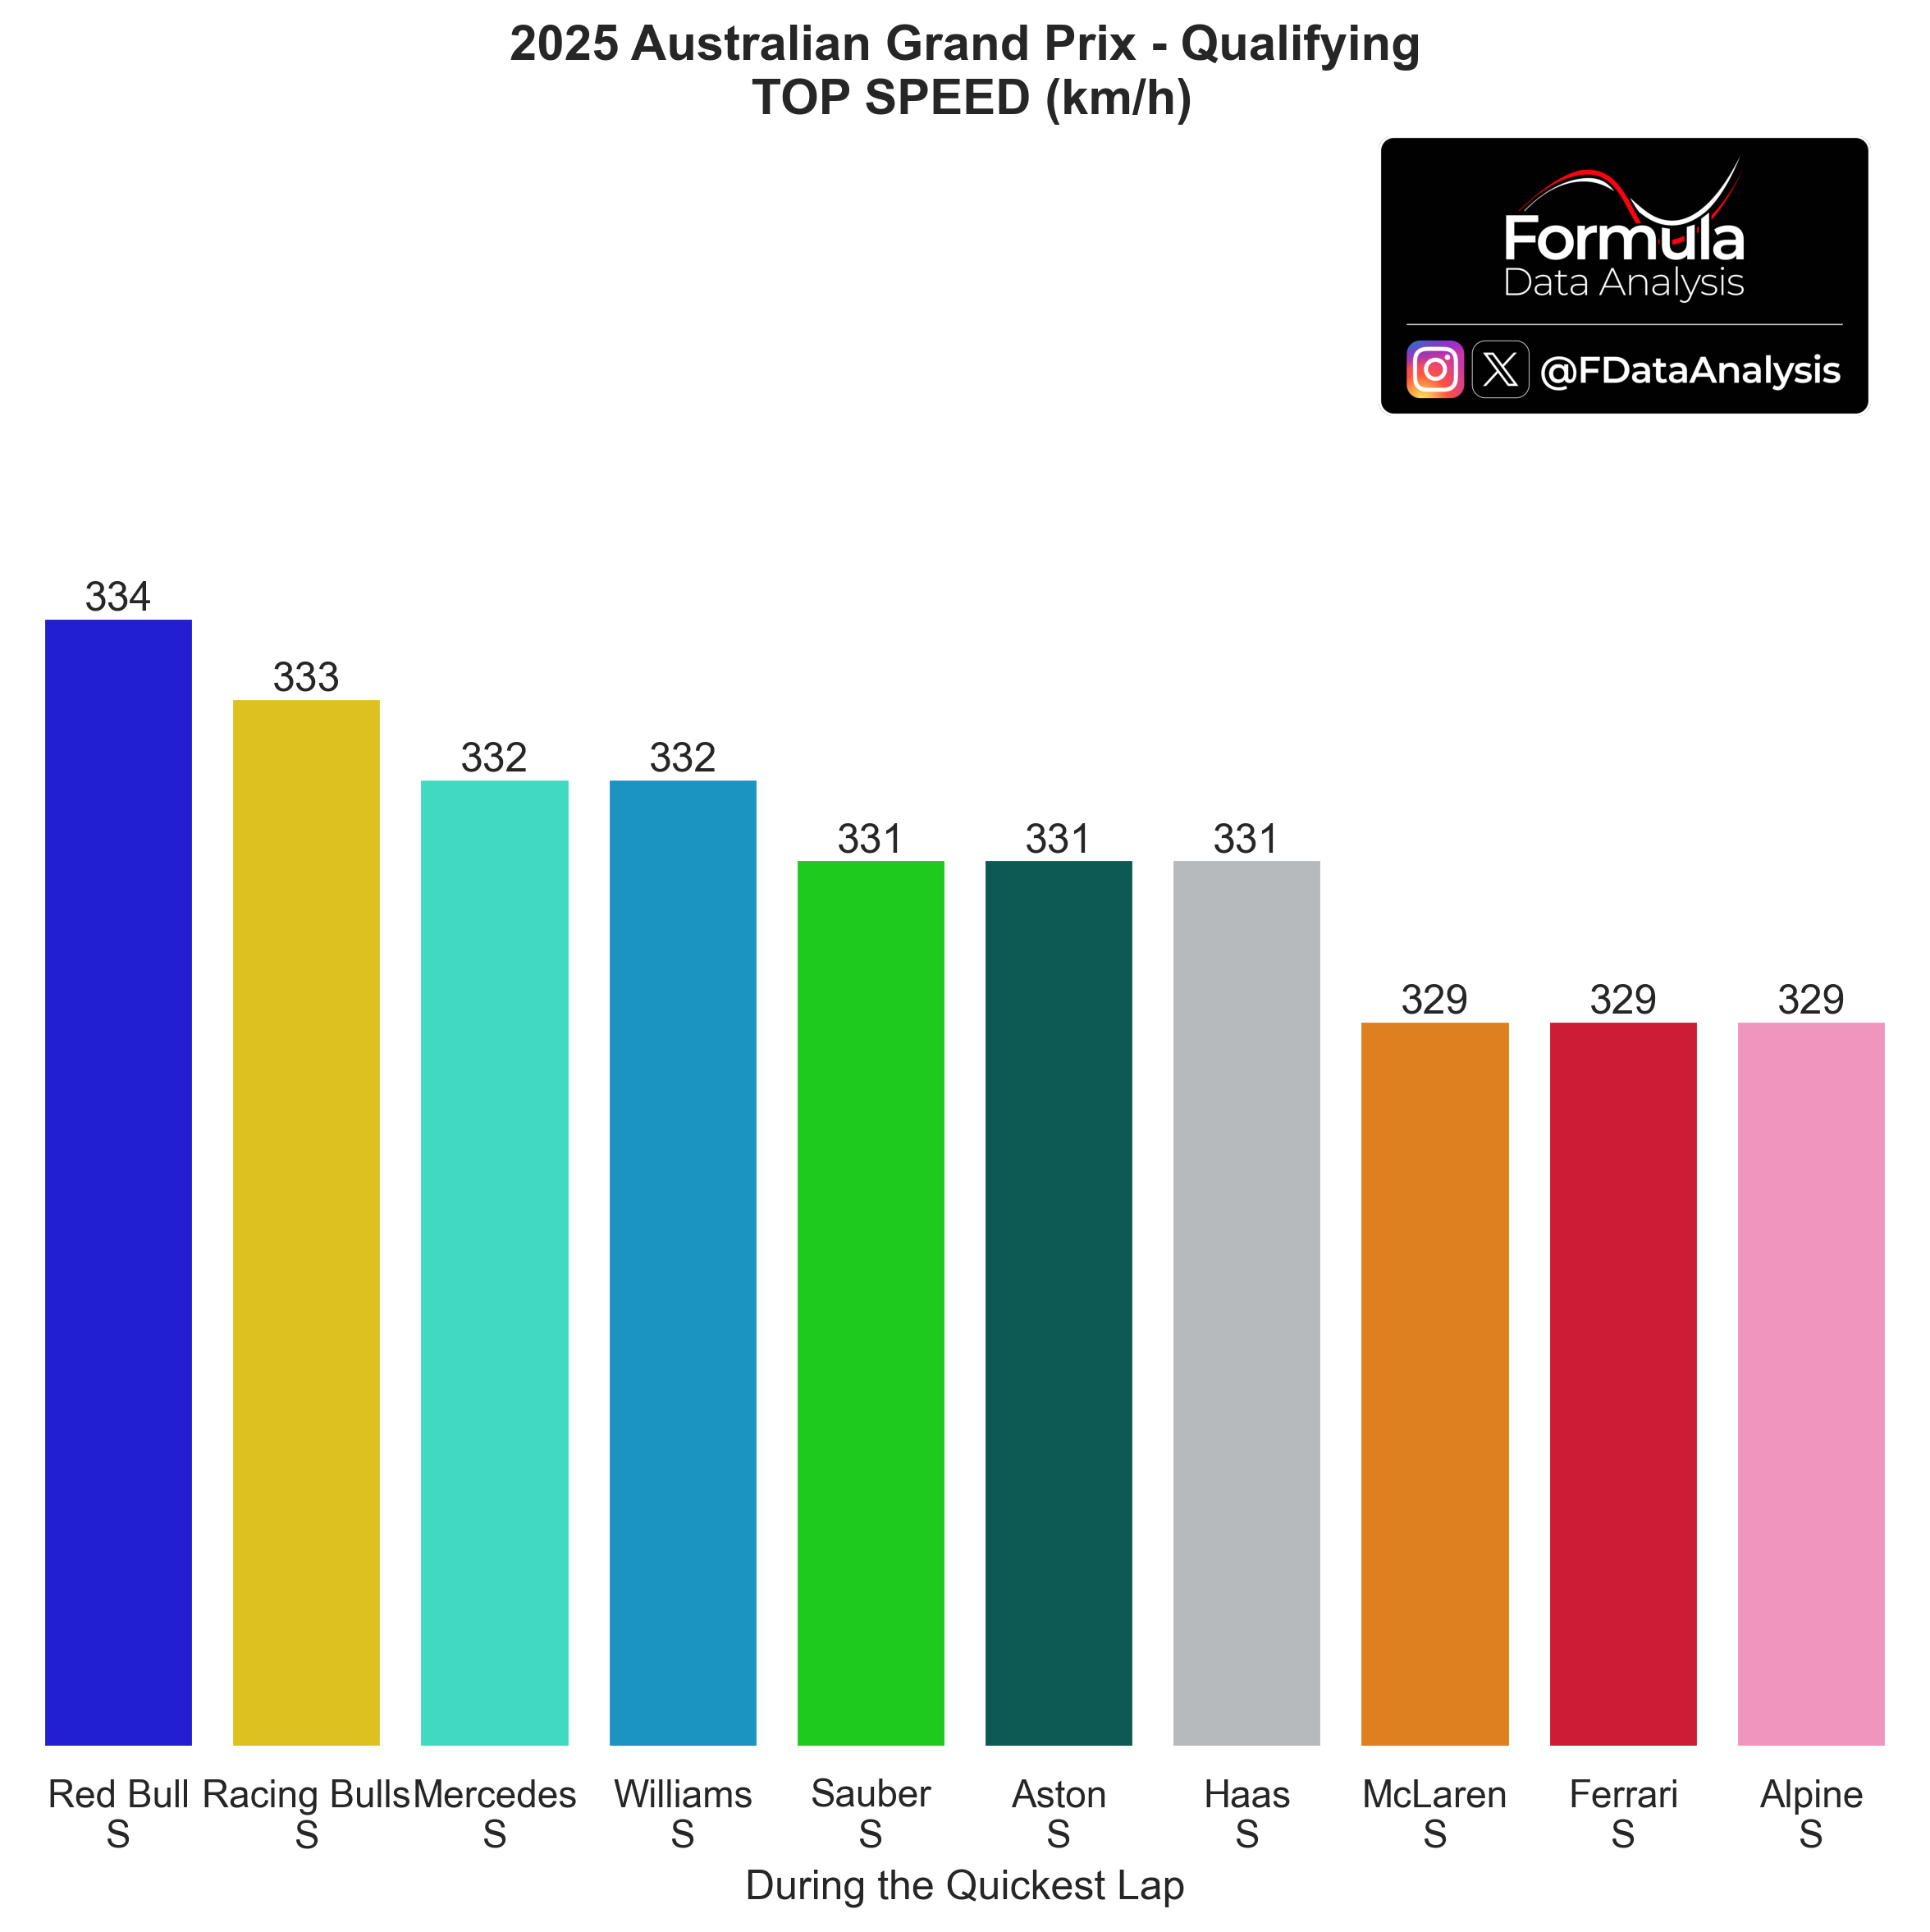
The top speeds from qualifying (below) provide a clearer picture of who was running less drag, as all drivers were under similar conditions (maximum ERS deployment, DRS, and no or minimal tows):
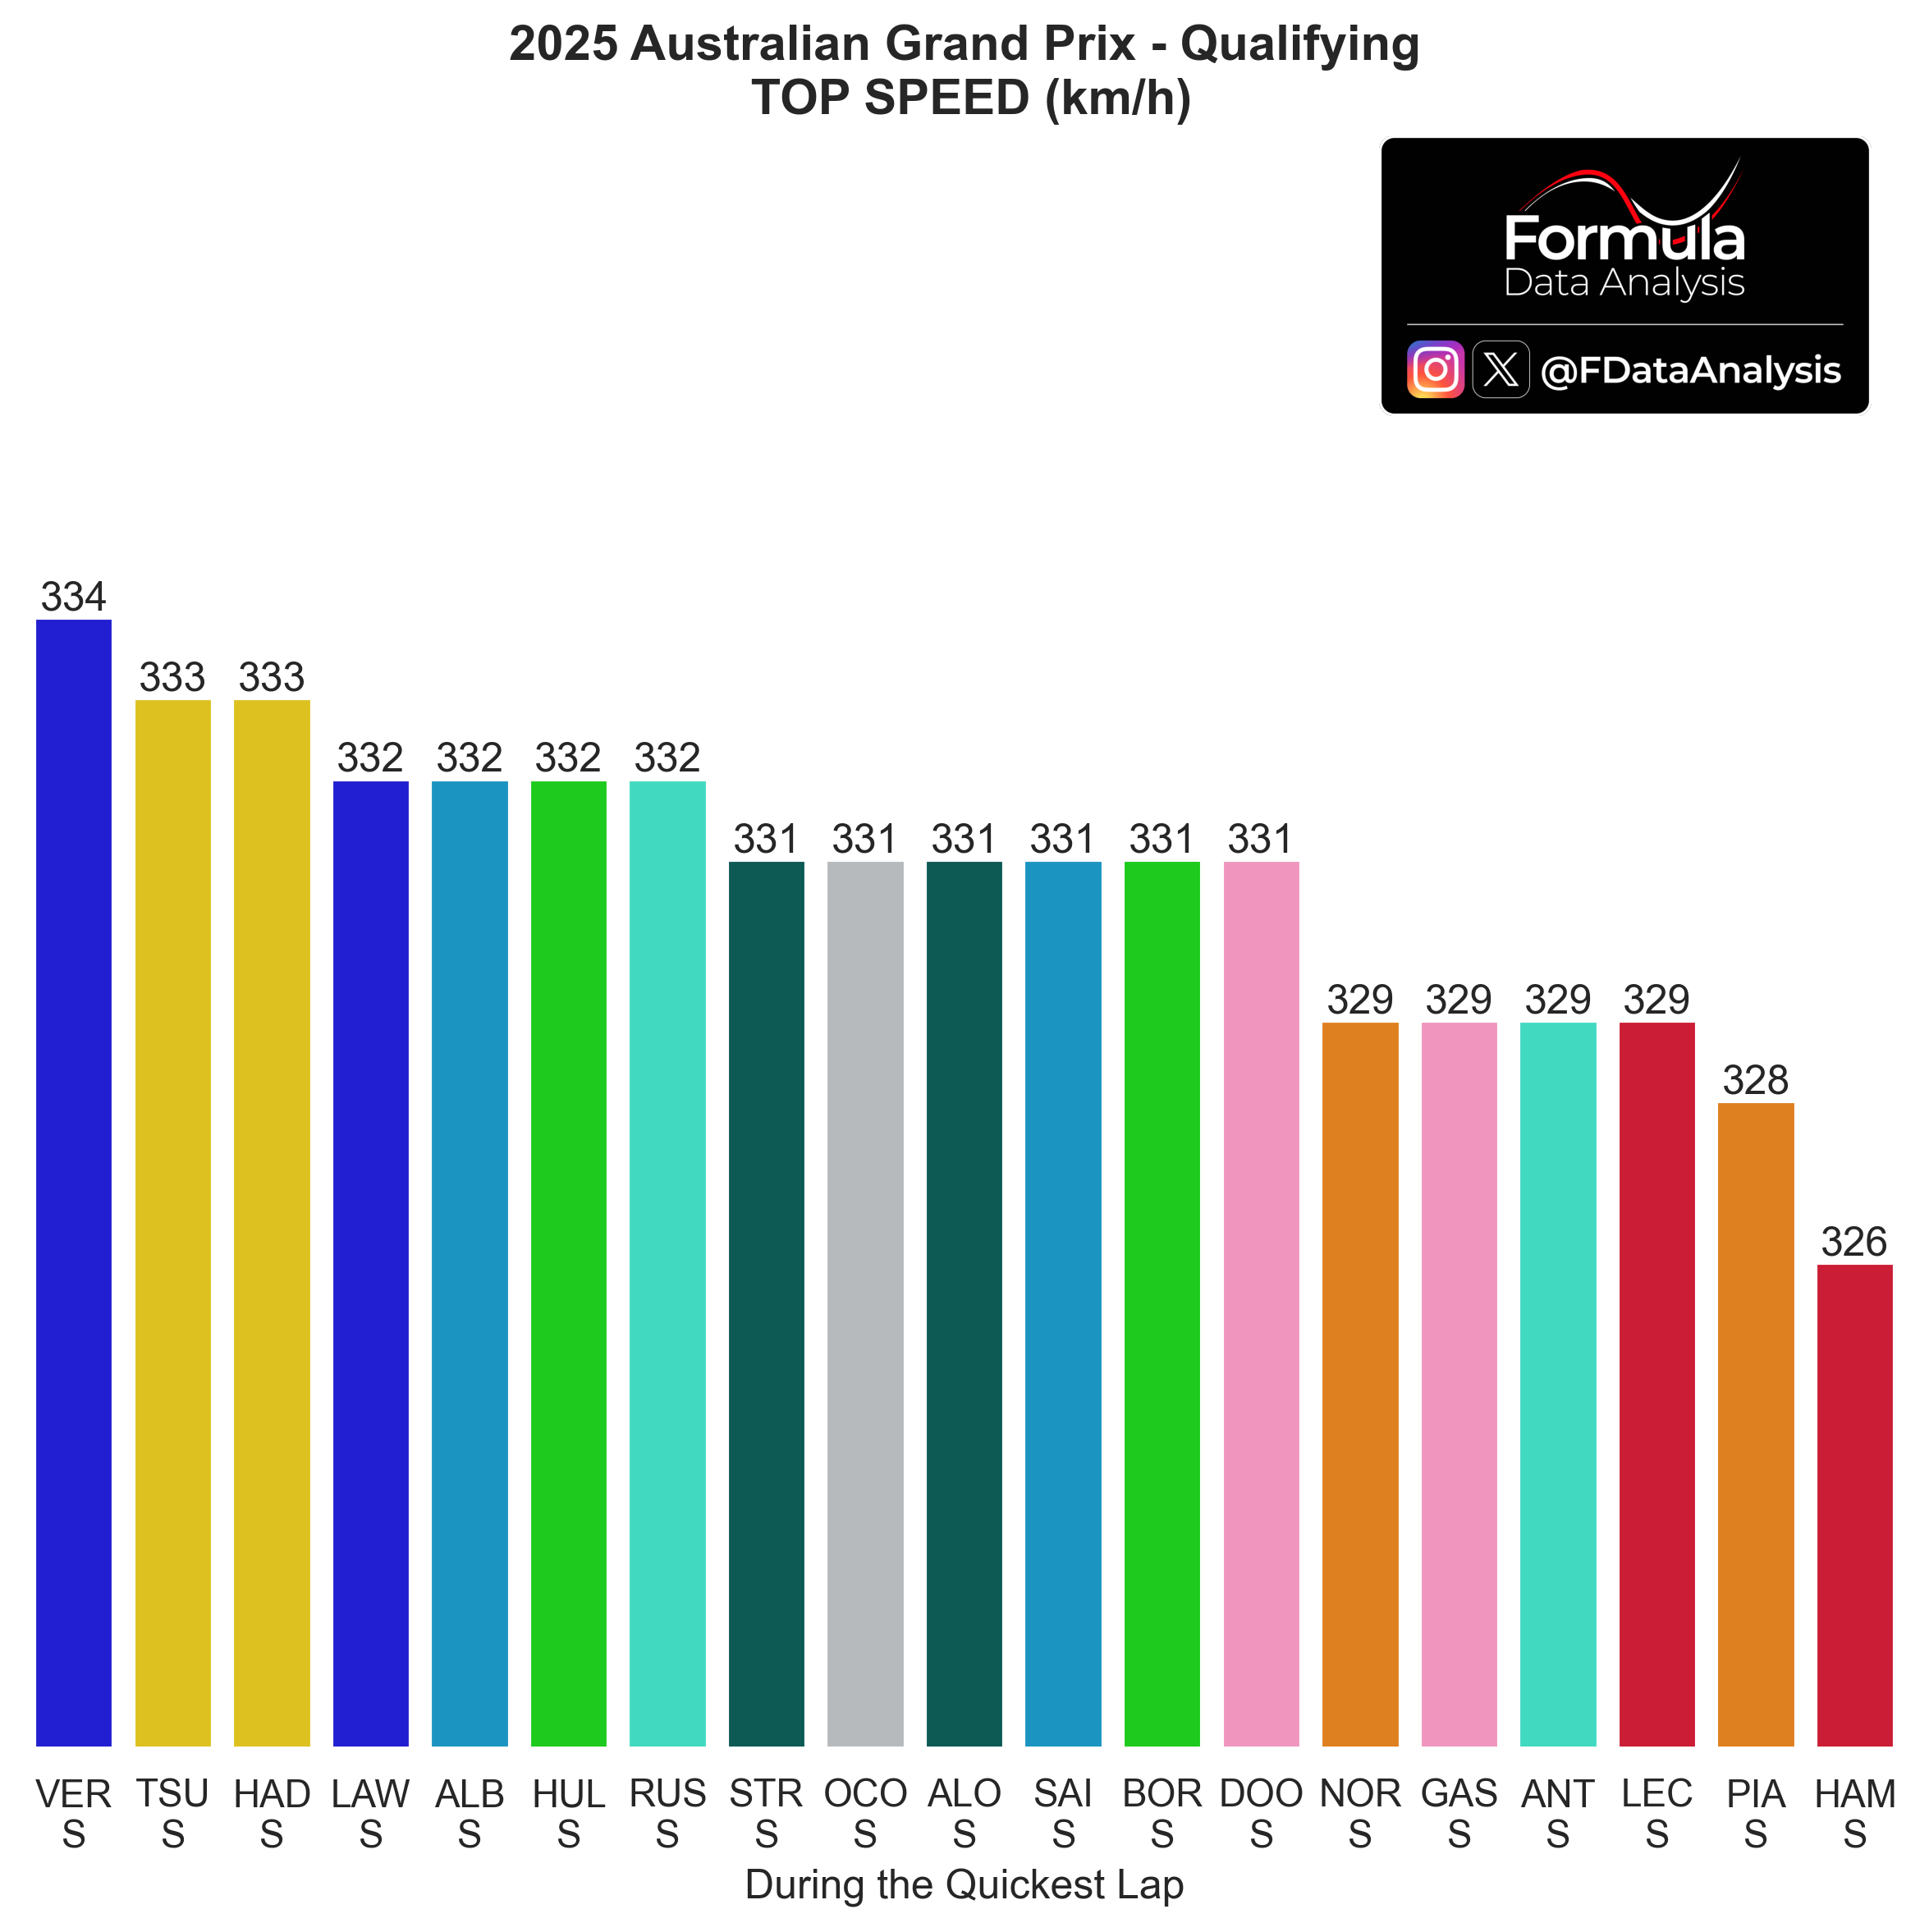
The two RBR-powered teams topped the charts, while McL, Ferrari, and Alpine had the lowest top speeds.
Same chart, per driver:
Minimum Speeds
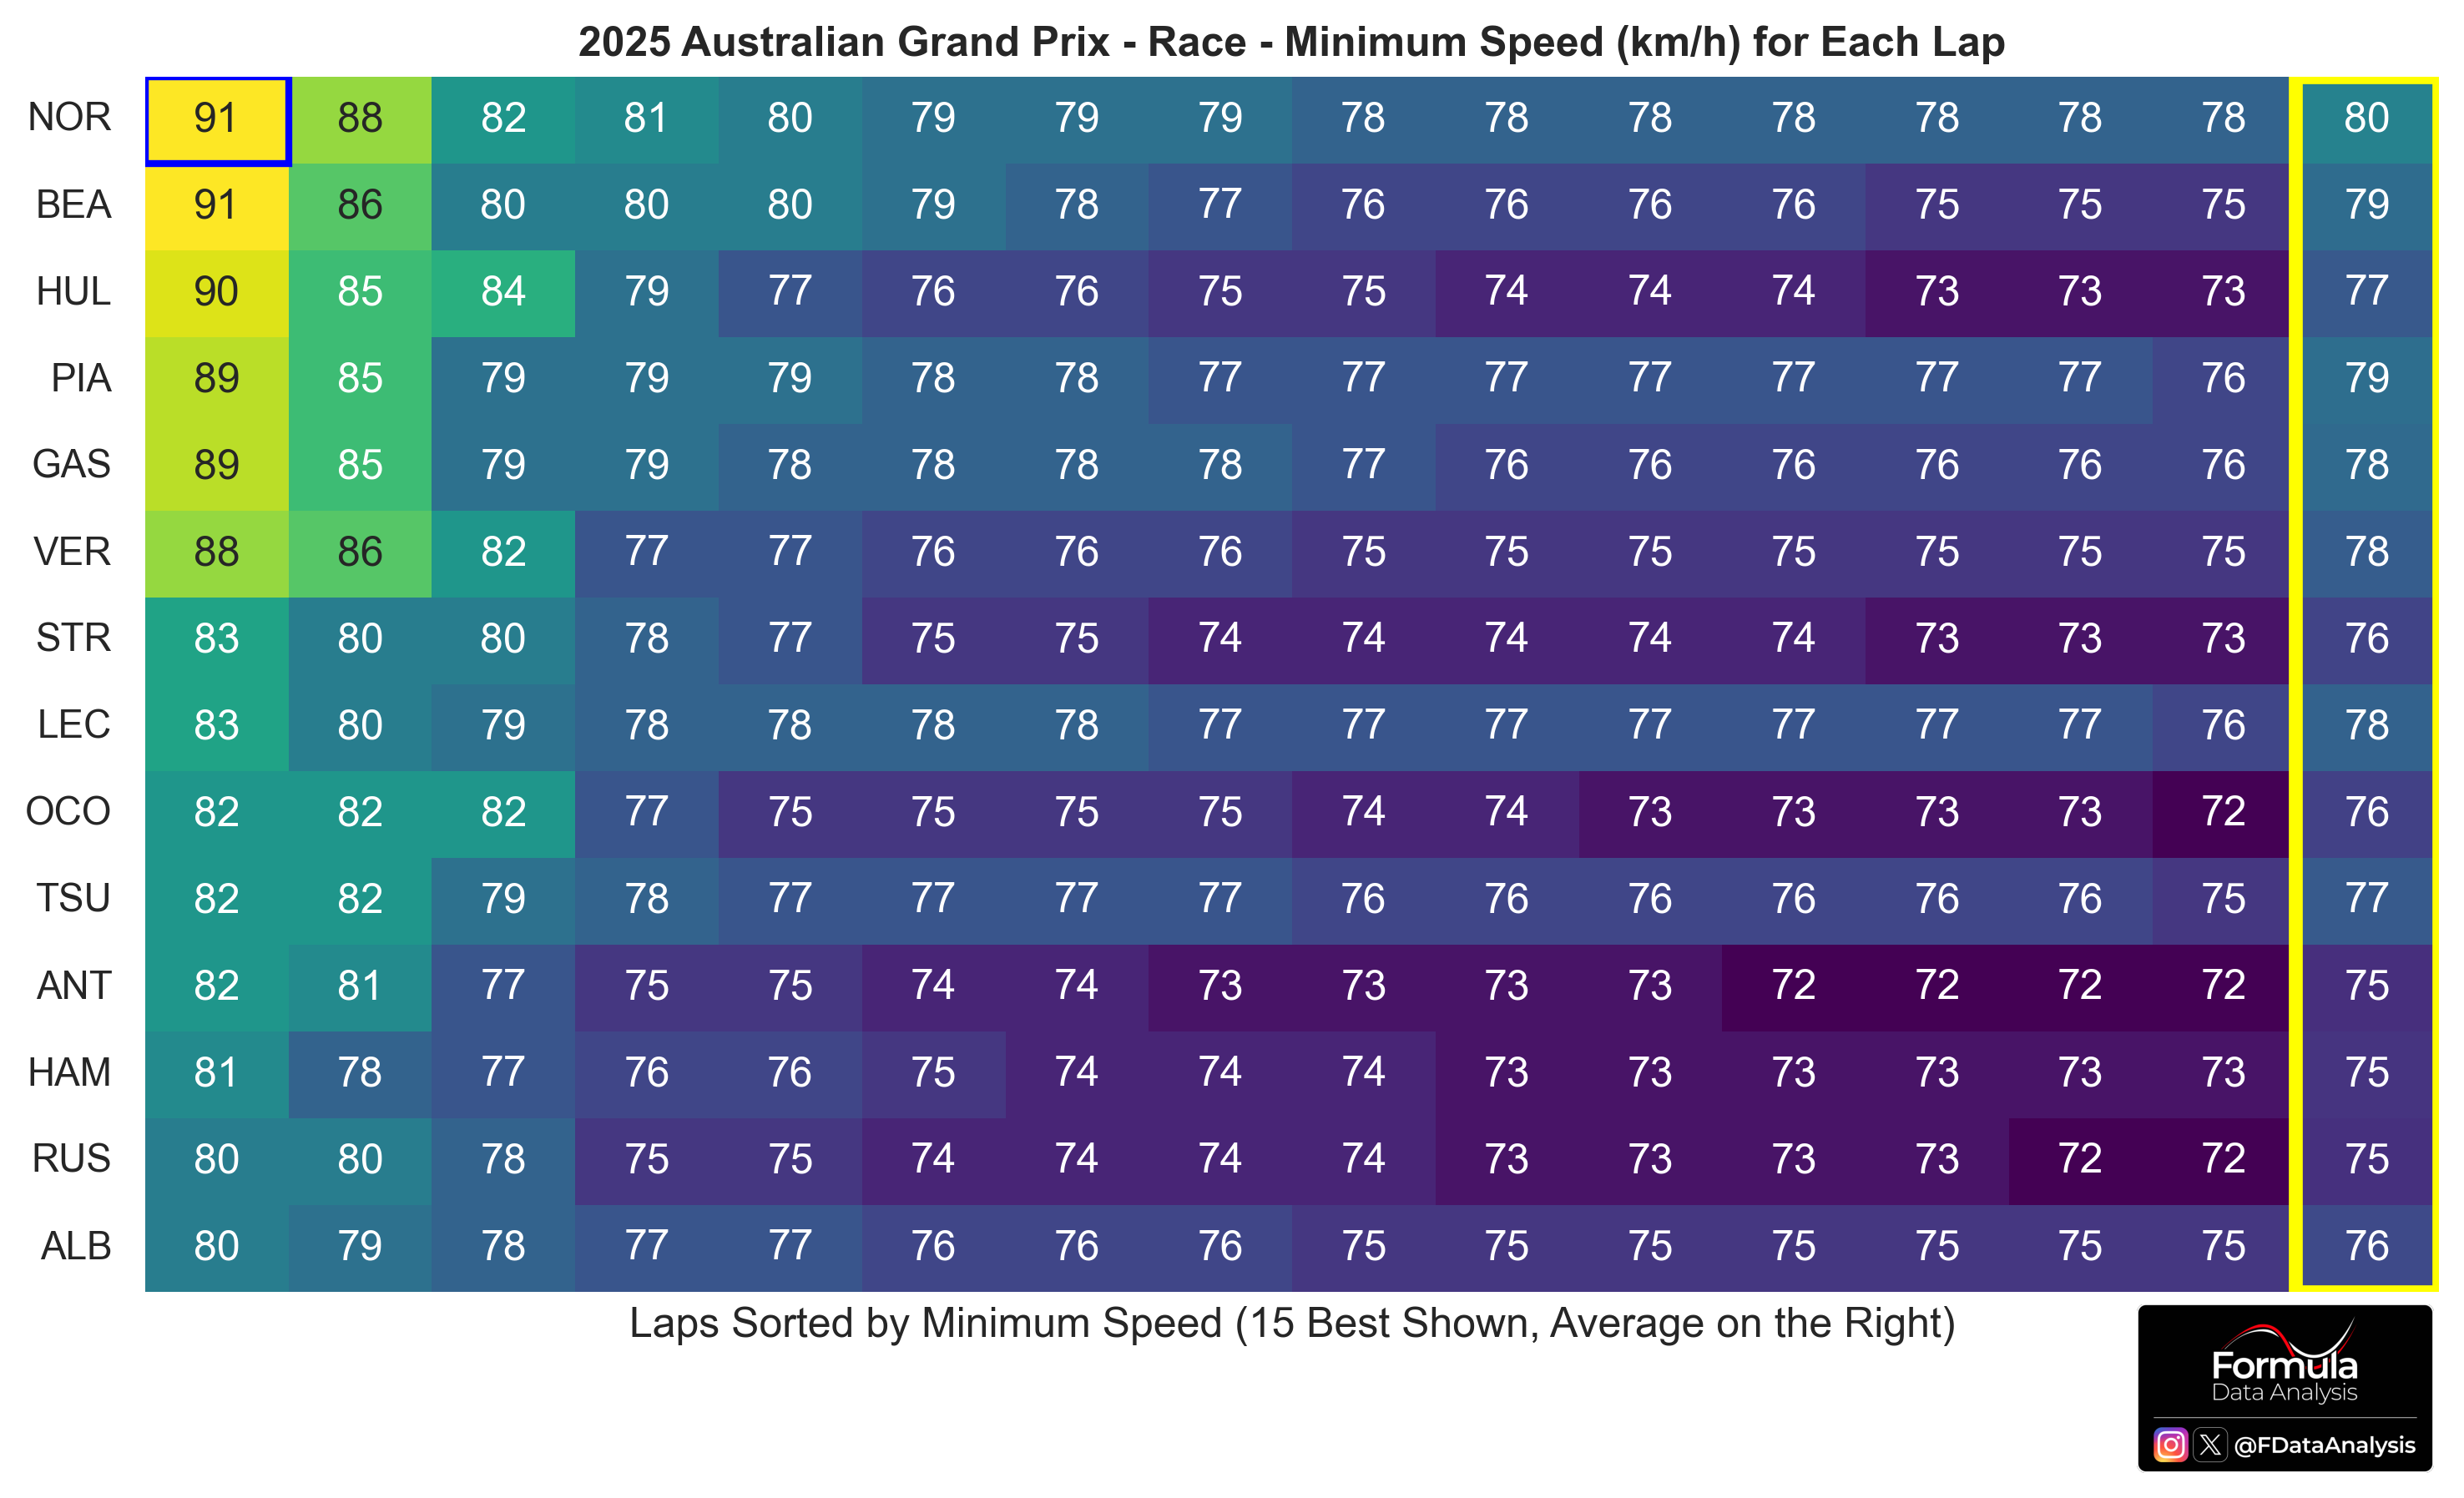
Interesting trends here: NOR and PIA could maintain the highest minimum speeds on average (rightmost column), HAM and the two Mercedes the lowest ones.
Pit Stops
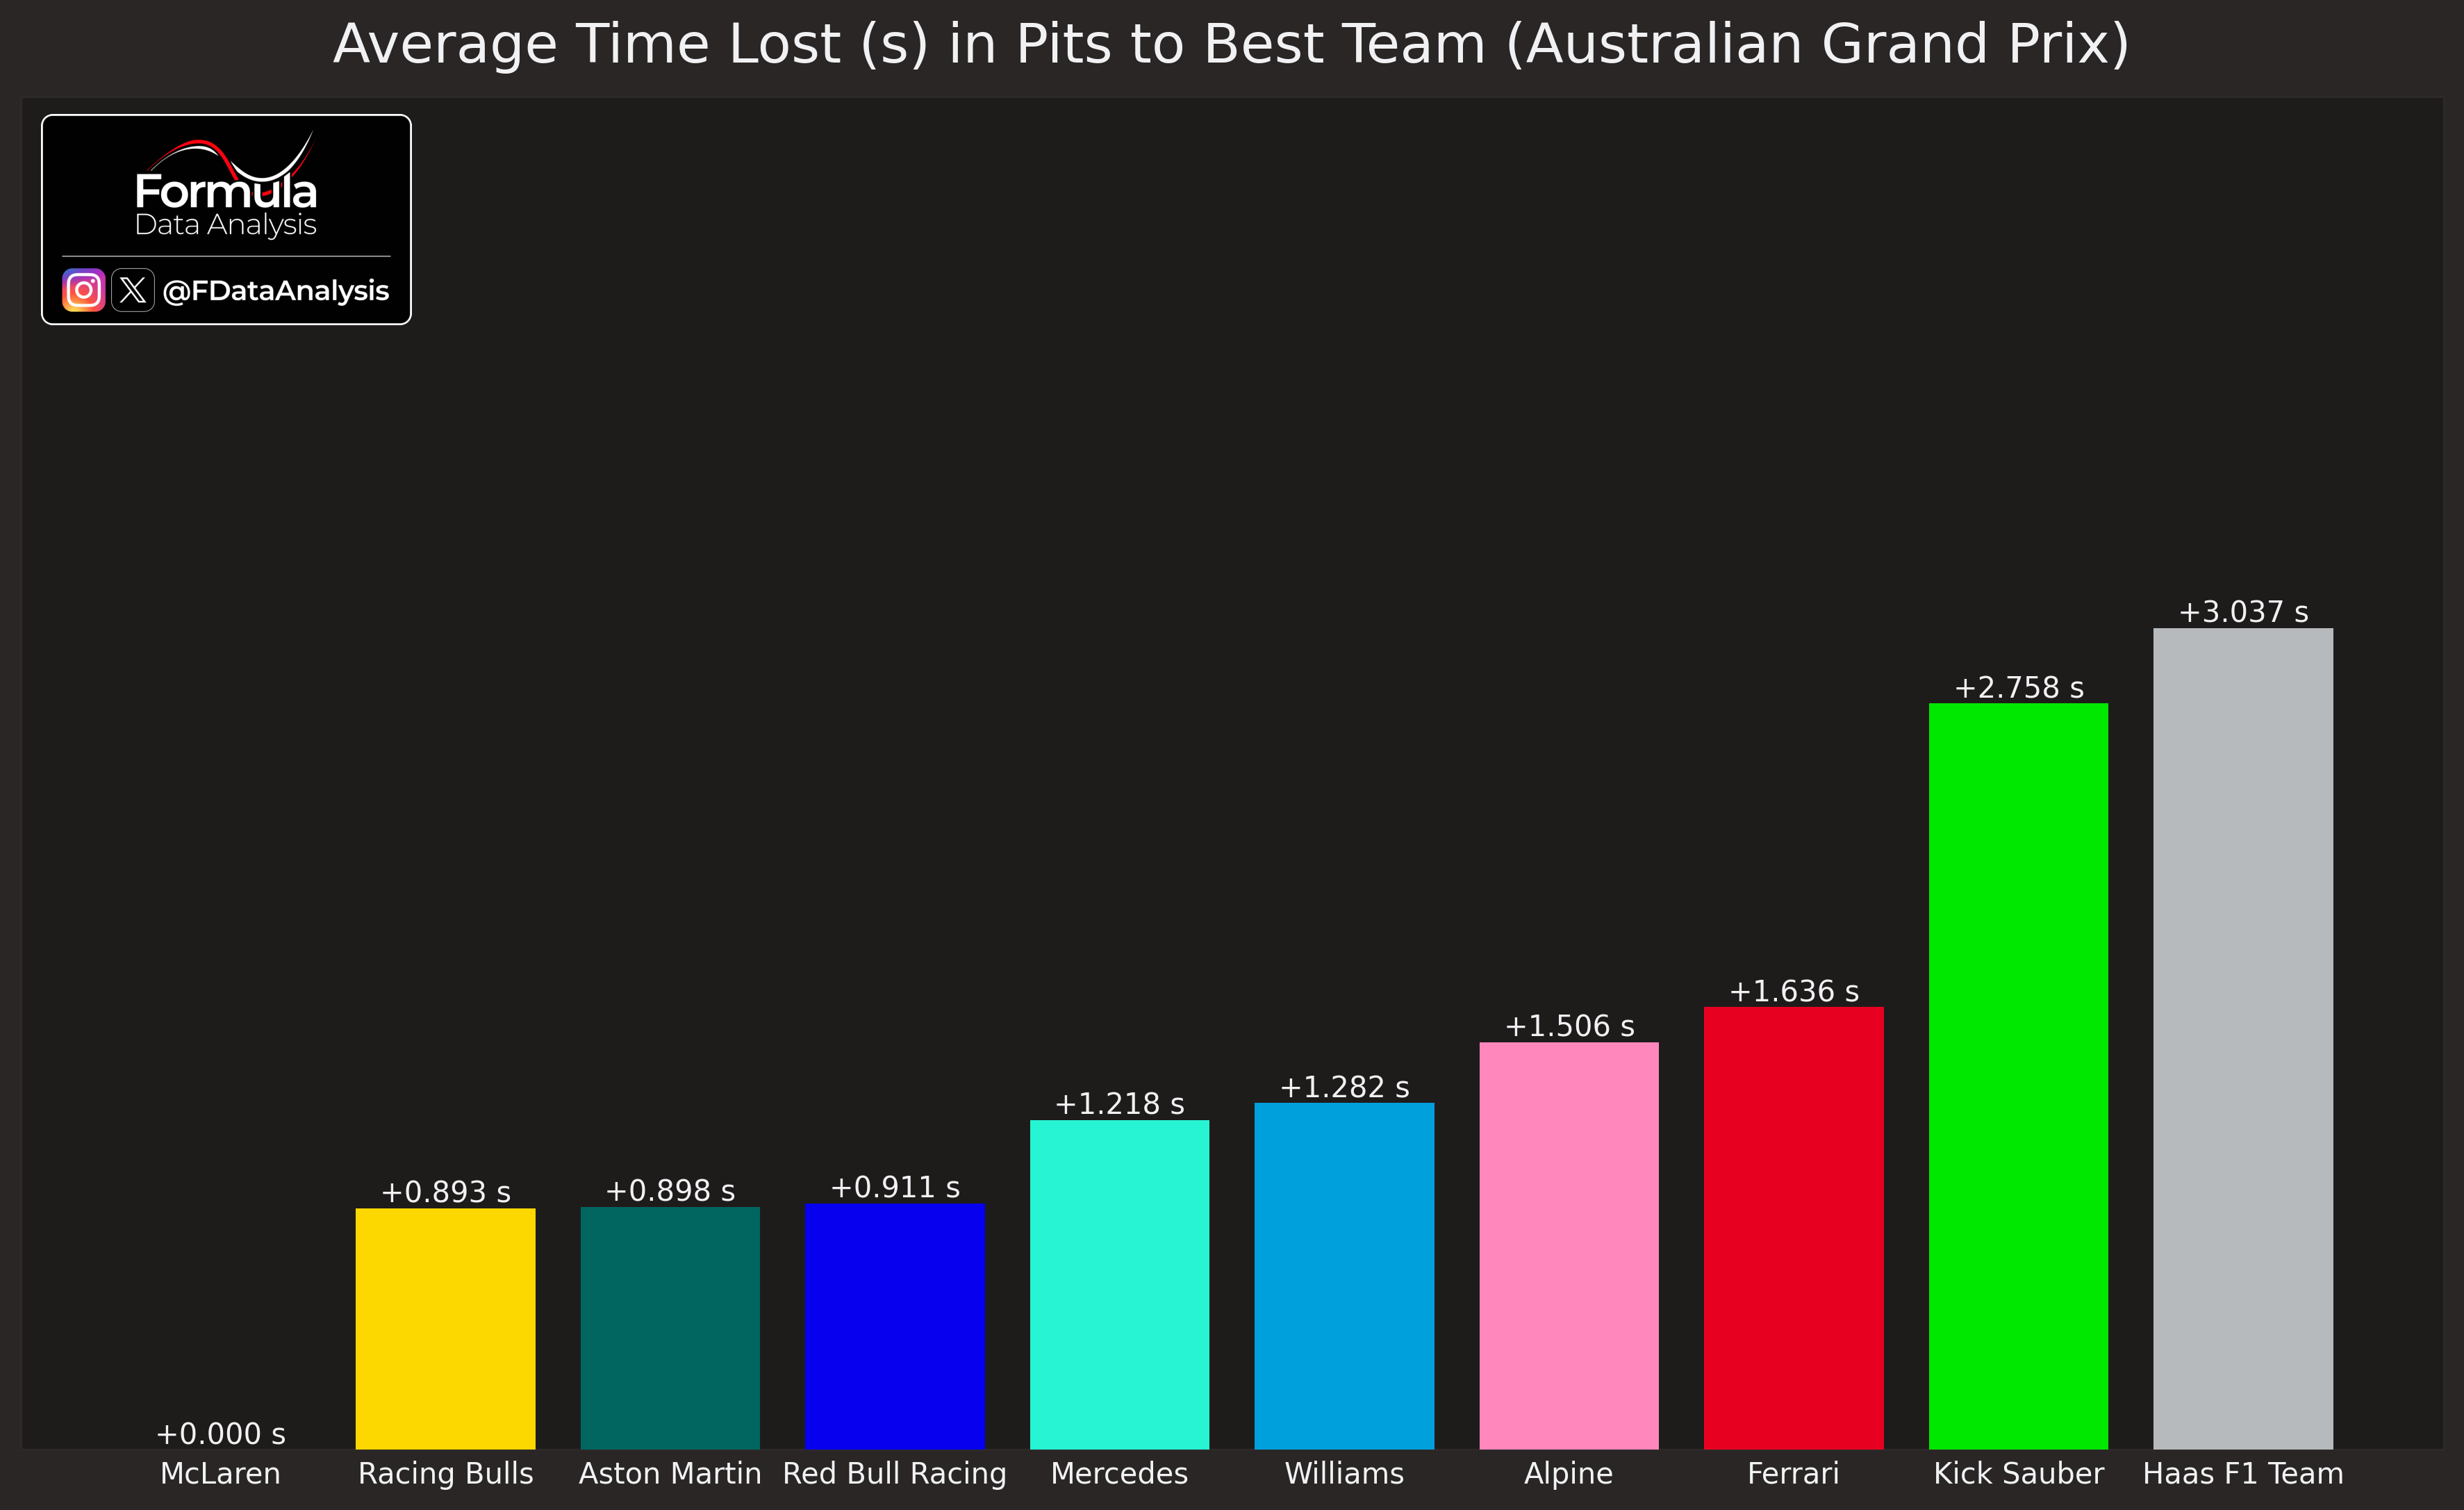
How to read: The average time spent in the pit (from the entry to the exit line) is shown for each team. The mean for all teams is also shown as a dashed line.
McL was ahead of the field, even in the pit stops! Ferrari, and more so Sauber and Haas, have room for improvement here.
Race start analysis
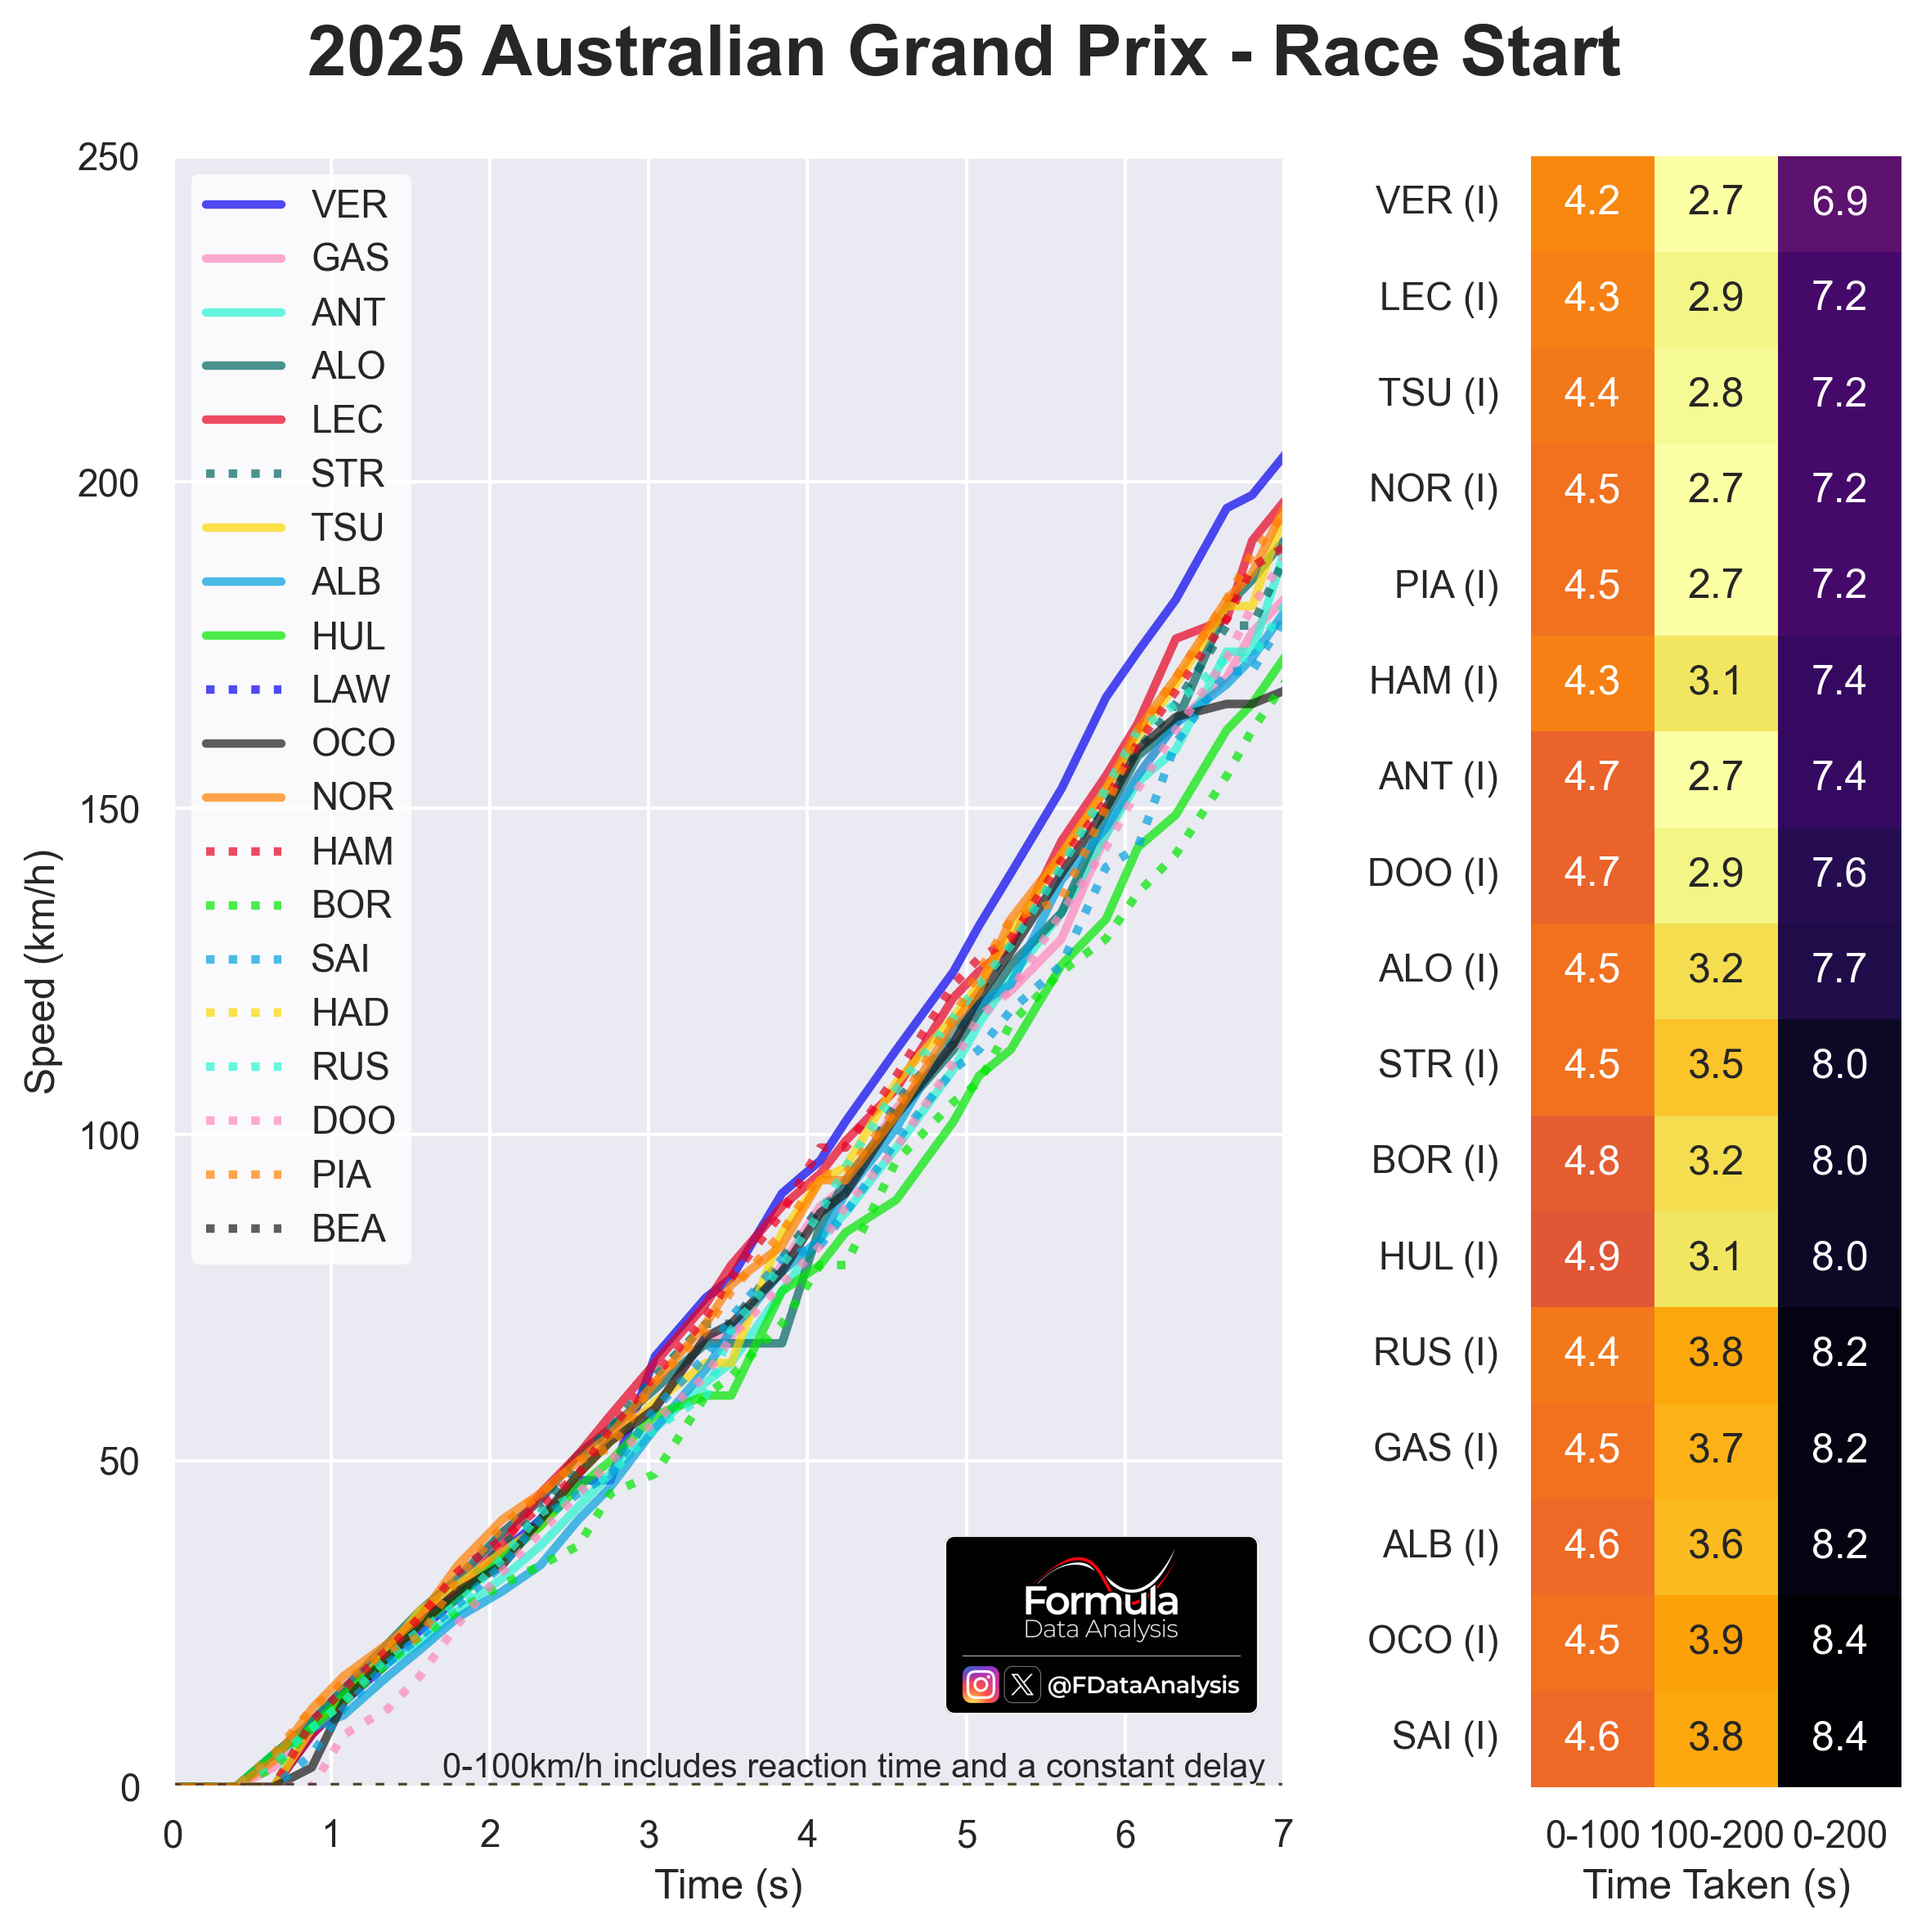
How to read: The table on the right shows the time needed to go from 0 to 100km/h (first column), to go from 100 to 200km/h (second column), and the total time to reach 200km/h (third column, sum of the previous 2). The 0-100km/h time included the reaction time but is higher than the value shown on TV as the lights go off slightly later than the start time considered. However, as this delay is the same for all drivers, it does not impact the comparison between drivers.
VER had the best start: 6.9s to reach 200 km/h in the wet! LEC, TSU, NOR, and PIA were the next best, but VER was so quick that he could still overtake PIA. Williams (ALB, SAI) and Haas (OCO) struggled the most.
Positions change in the race
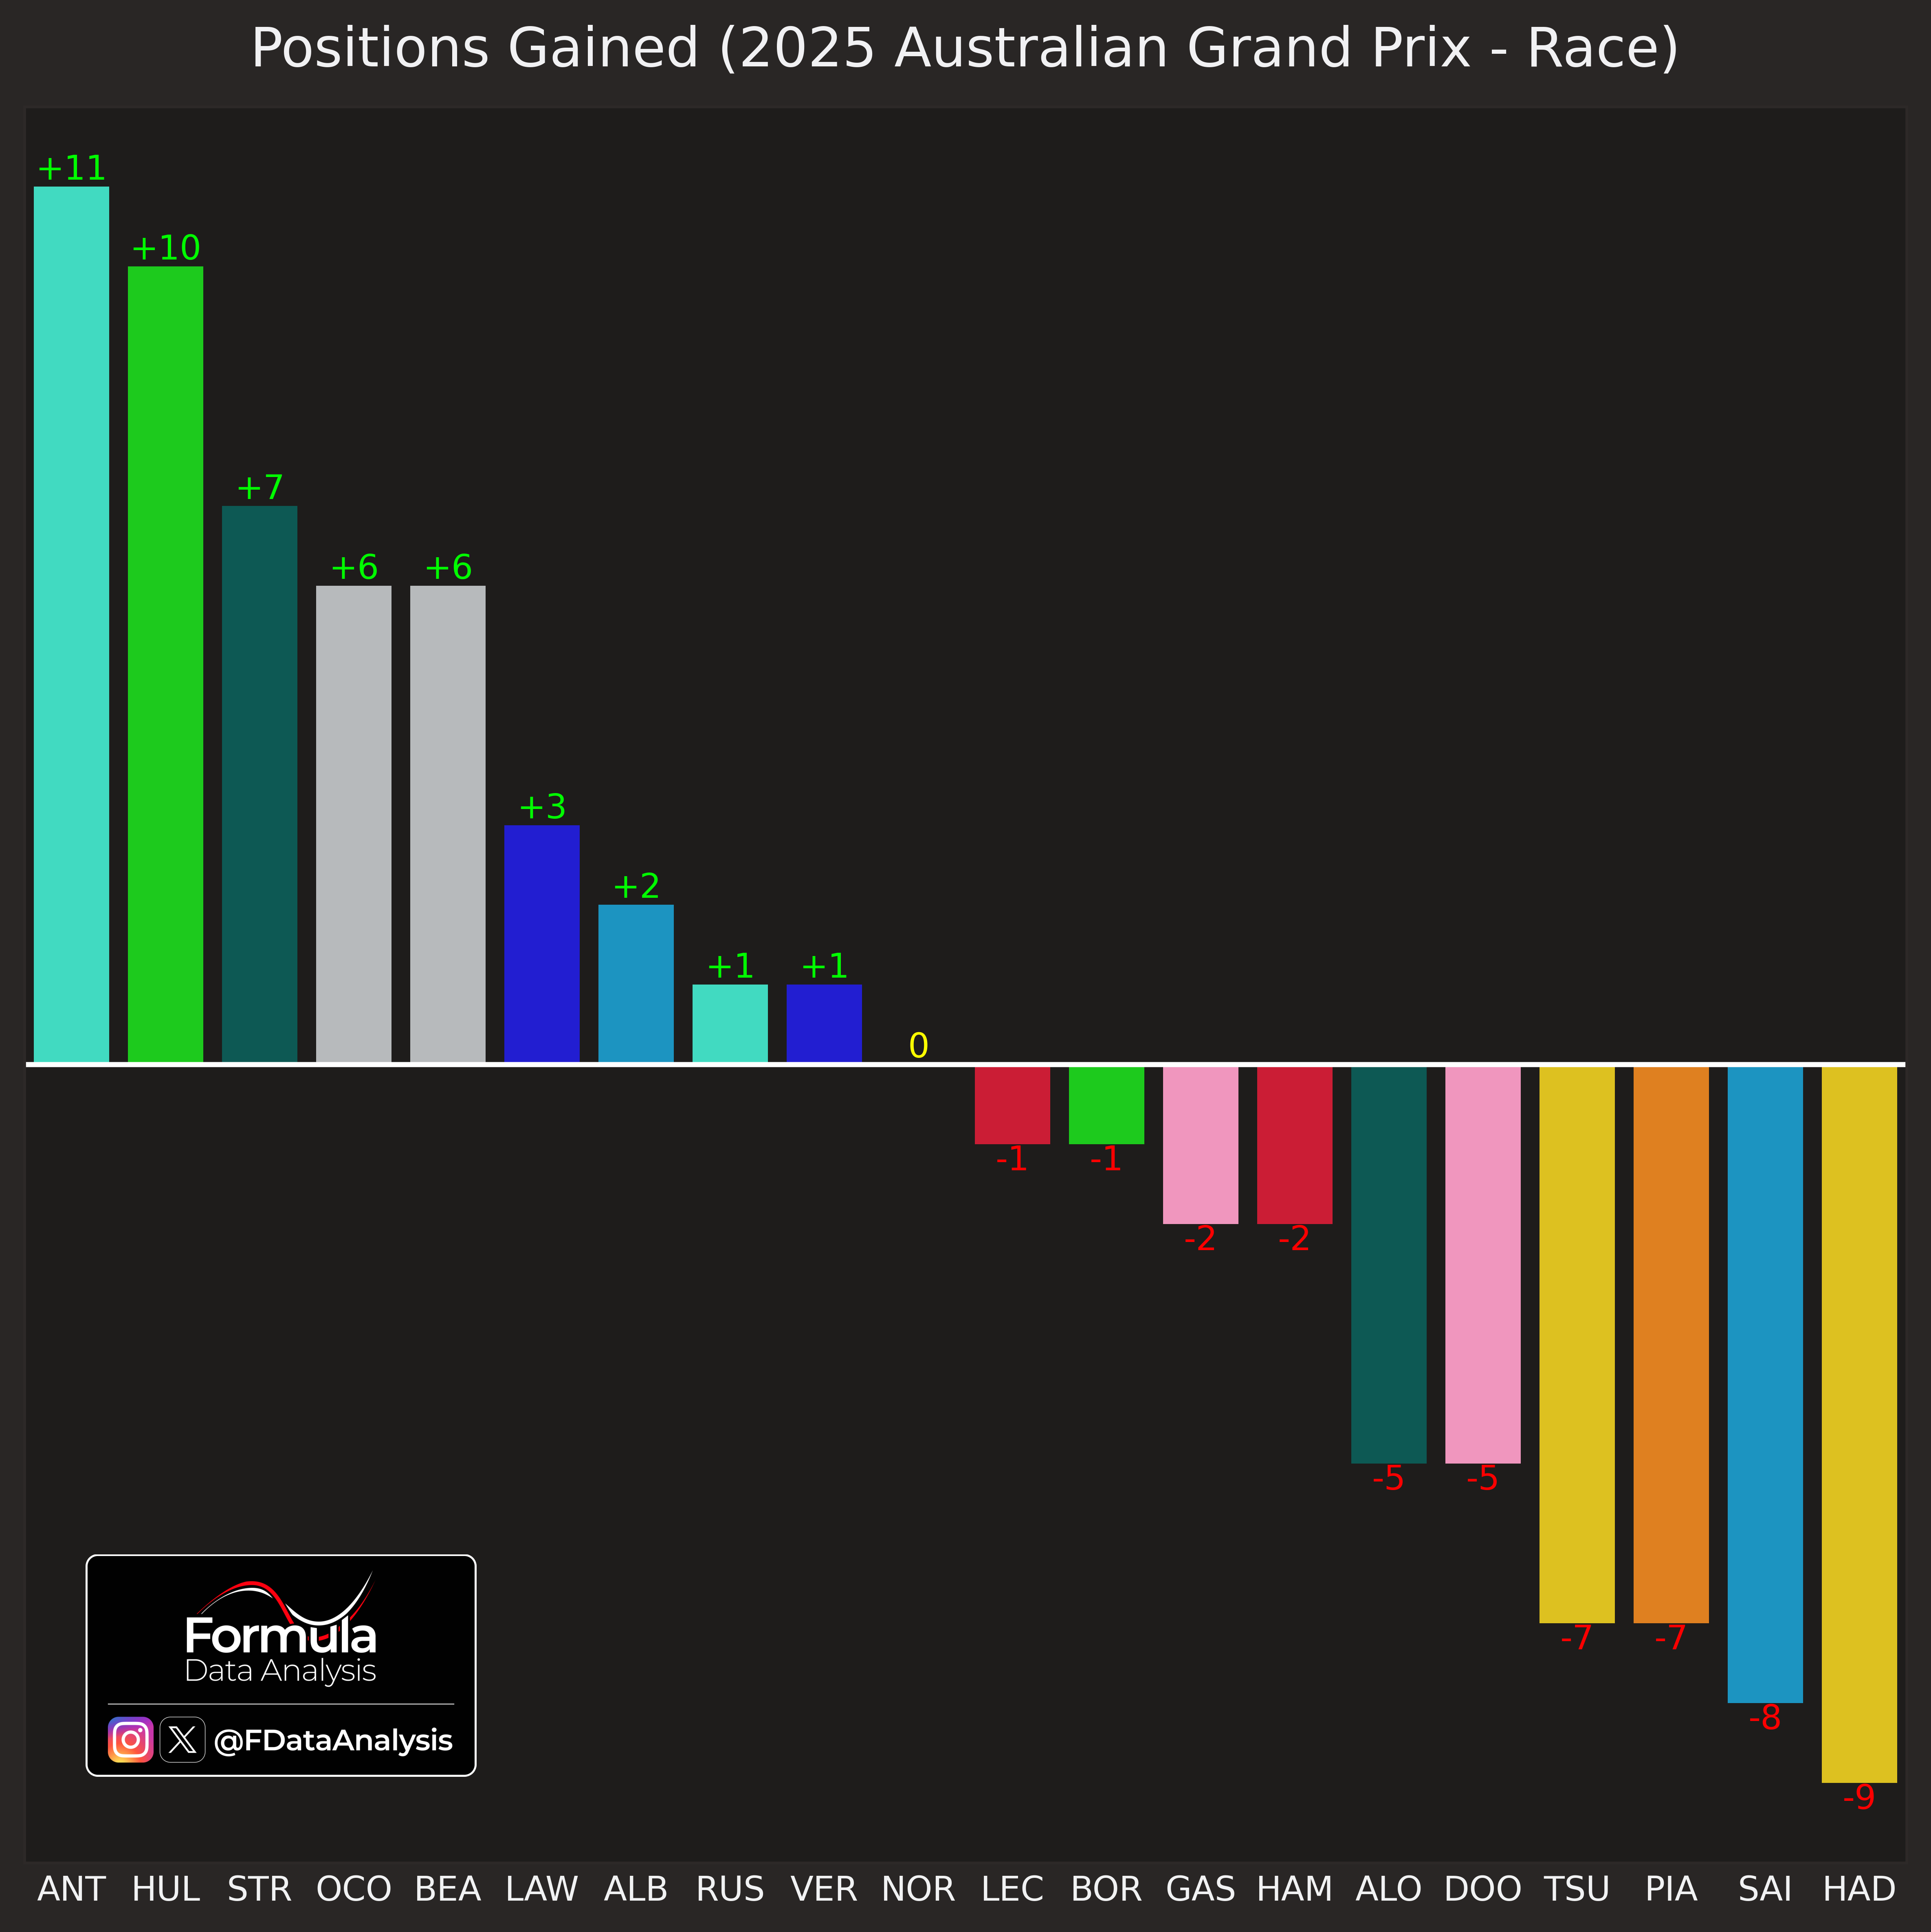
How to read: The graph shows how many positions each driver gained (+) or lost (-) at the chequered flag compared to their starting positions. Drivers are sorted left to right from those who gained the most places to those who lost the most.
ANT (+11), HUL (+10), and STR (+7) gained the most places. Among the drivers who didn't retire, TUS (-7) and PIA (-7) lost the most, which is disappointing considering their excellent starting positions.
Next Race: China!
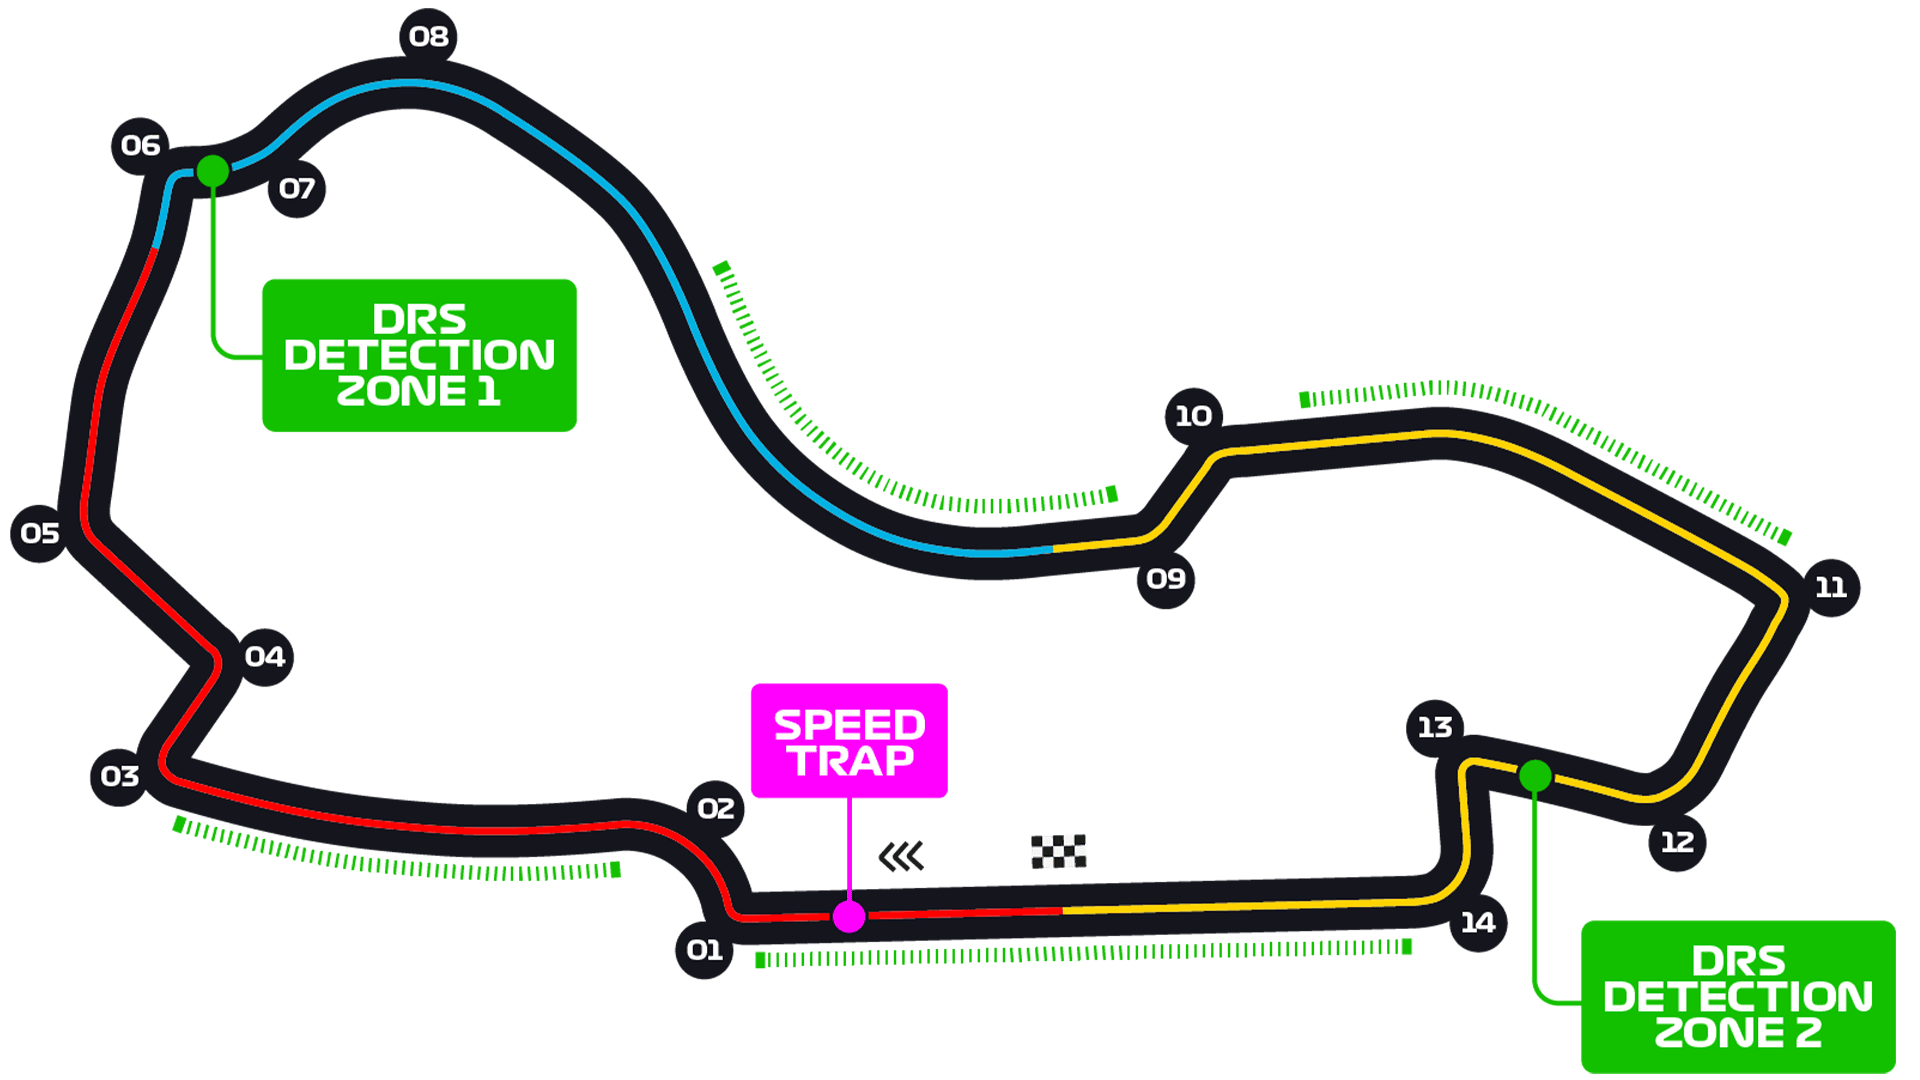
The next race will be in China. This track is normally more representative of the season's outlook, as it features a mix of long straights, tight corners, and fast-flowing sections. It features a very long back straight (1.2km) leading into a heavy braking zone at Turn 14. In particular, the first sector is very technical, with a unique, tightening-radius Turn 1.. The mix of slow, medium, and high-speed corners tests the overall car balance, and lastly, elevation changes impact braking and traction. Braking and lateral grip are most important for performance

Based on Pirelli's notes, track evolution is normally very strong there. Tyre wear, especially on the left rear tyre, will be very high. Overall, this is a very well-rounded track. Let's see who will be quickest there!

Thanks again for supporting this project!
If you have any questions, please ask, and I will gladly answer them! And remember to keep an eye on the Data Repository as well. See you soon!
Mirco / Formula Data Analysis