

Hi, dear F1 Data Analysts,
We've finally reached the end of this very long (24 GPs!) season: well worth the time, though, as it was the best season since 2021 at least! 3 teams fighting for the WCC, a 4th one able to get frequent podia and some wins, an open WDC until the last few races, a very unpredictable development path for the various cars, and many on-track overtakes and fights for the win. I hope my analyses made it even more engaging, and I'm glad to have followed it as closely as I did!
Let's look at the data for the last race this season (but not for the last time: there will be some off-season content for you supporters!).
Starting Grid and Results
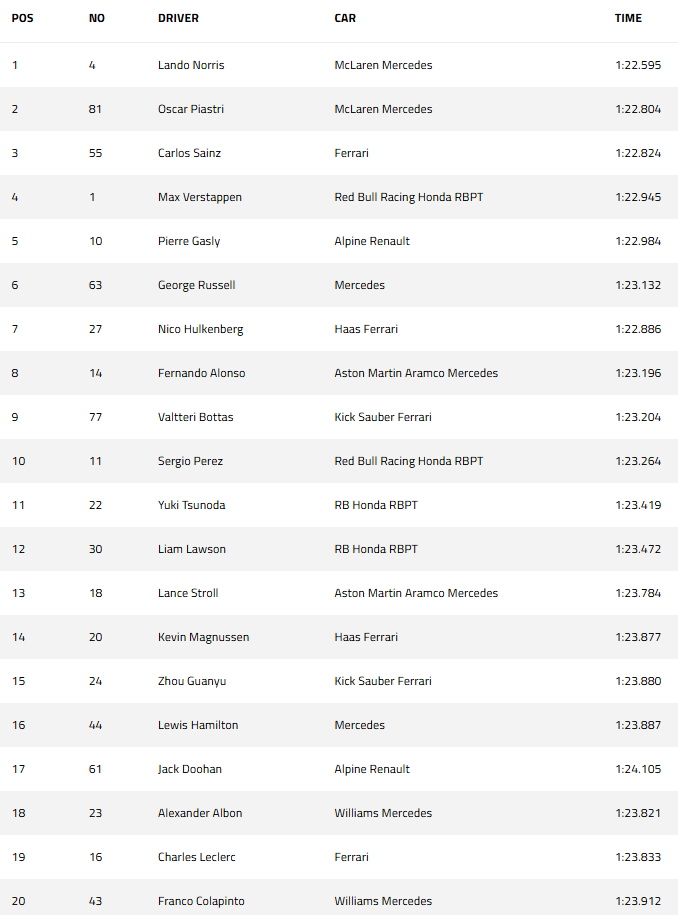
A quick look at the starting grid, to provide context to the results:
A McL front row, which should have given them an almost certain WCC result. And they got that, but after lap 1 the pendulum had swung significantly! (Albeit it still was solidly in their field). NOR (who dominated qualifying), then PIA.
SAI and VER were in the 2nd row, hoping to leapfrog a McL at the start. Next were Gasly (another extraordinary quali performance from him: Alpine turned the tables in the final quarter of the season!) and RUS. Behind them, the midfield: HUL (Still P7 despite the penalty!), ALO, BOT, and PER completed the top 5 rows. HAM started P16, after his shocking Q1 elimination, and LEC P19 after an extremely unlucky weekend (up to that point)
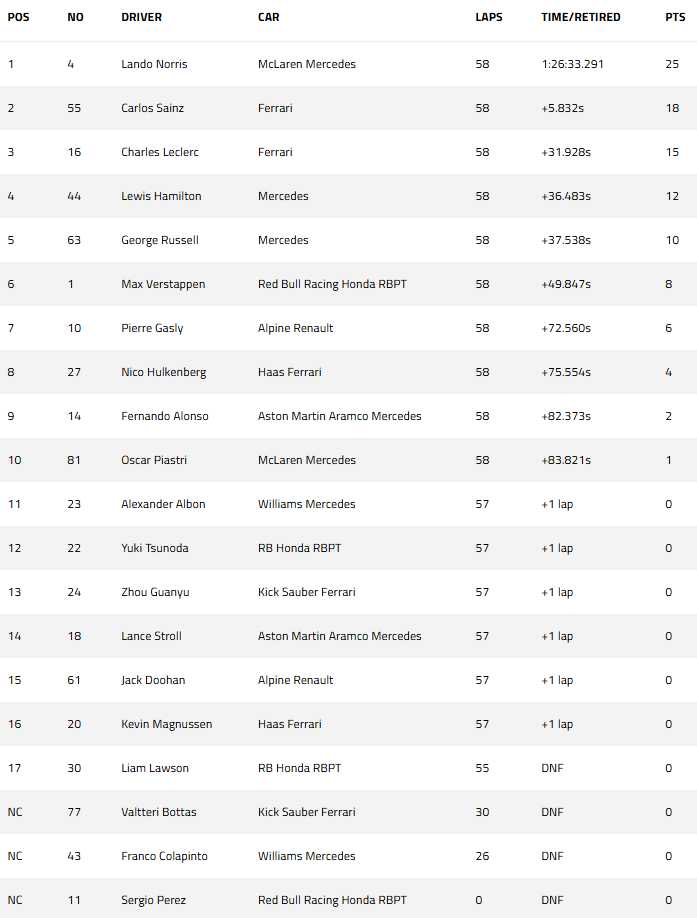
Below is the final classification:
Who would have expected a Ferrari DOUBLE podium? LEC did one of his best drives ever, gaining 16 places. SAI did an excellent drive too, gaining from the PIA-VER drama ahead and posing a challenge (which, in the end, could not be won) to NOR. The final gap was 5.8s for SAI, and 31.9s for LEC (his tyres were shot due to the battles, running in dirty air, and the early pit)
HAM shined, too: he recovered from P16 to P4 (in an inferior car compared to the Ferrari) and finished in front of his current teammate and behind his next season's one. RUS struggled to pass GAS: a testament to Alpine's excellent form. Next was VER, who had to recover from his opening lap spin and the ensuing 10s penalty.
GAS finished 72s behind NOR, but still good enough for P7. HUL crossed the line 3s after him. ALO and PIA took the last 2 point positions: PIA finished the race 83s behind his teammate, after resuming the race in last place after the first corner and serving a 10s penalty for crashing into COL. His pace was unimpressive all the race.
Only the point-finishers were not lapped. There were 4 retirements: LAW, BOT, COL, and PER. For BOT and PER, at least, this could be their final F1 race.
Tyres Used and Strategy
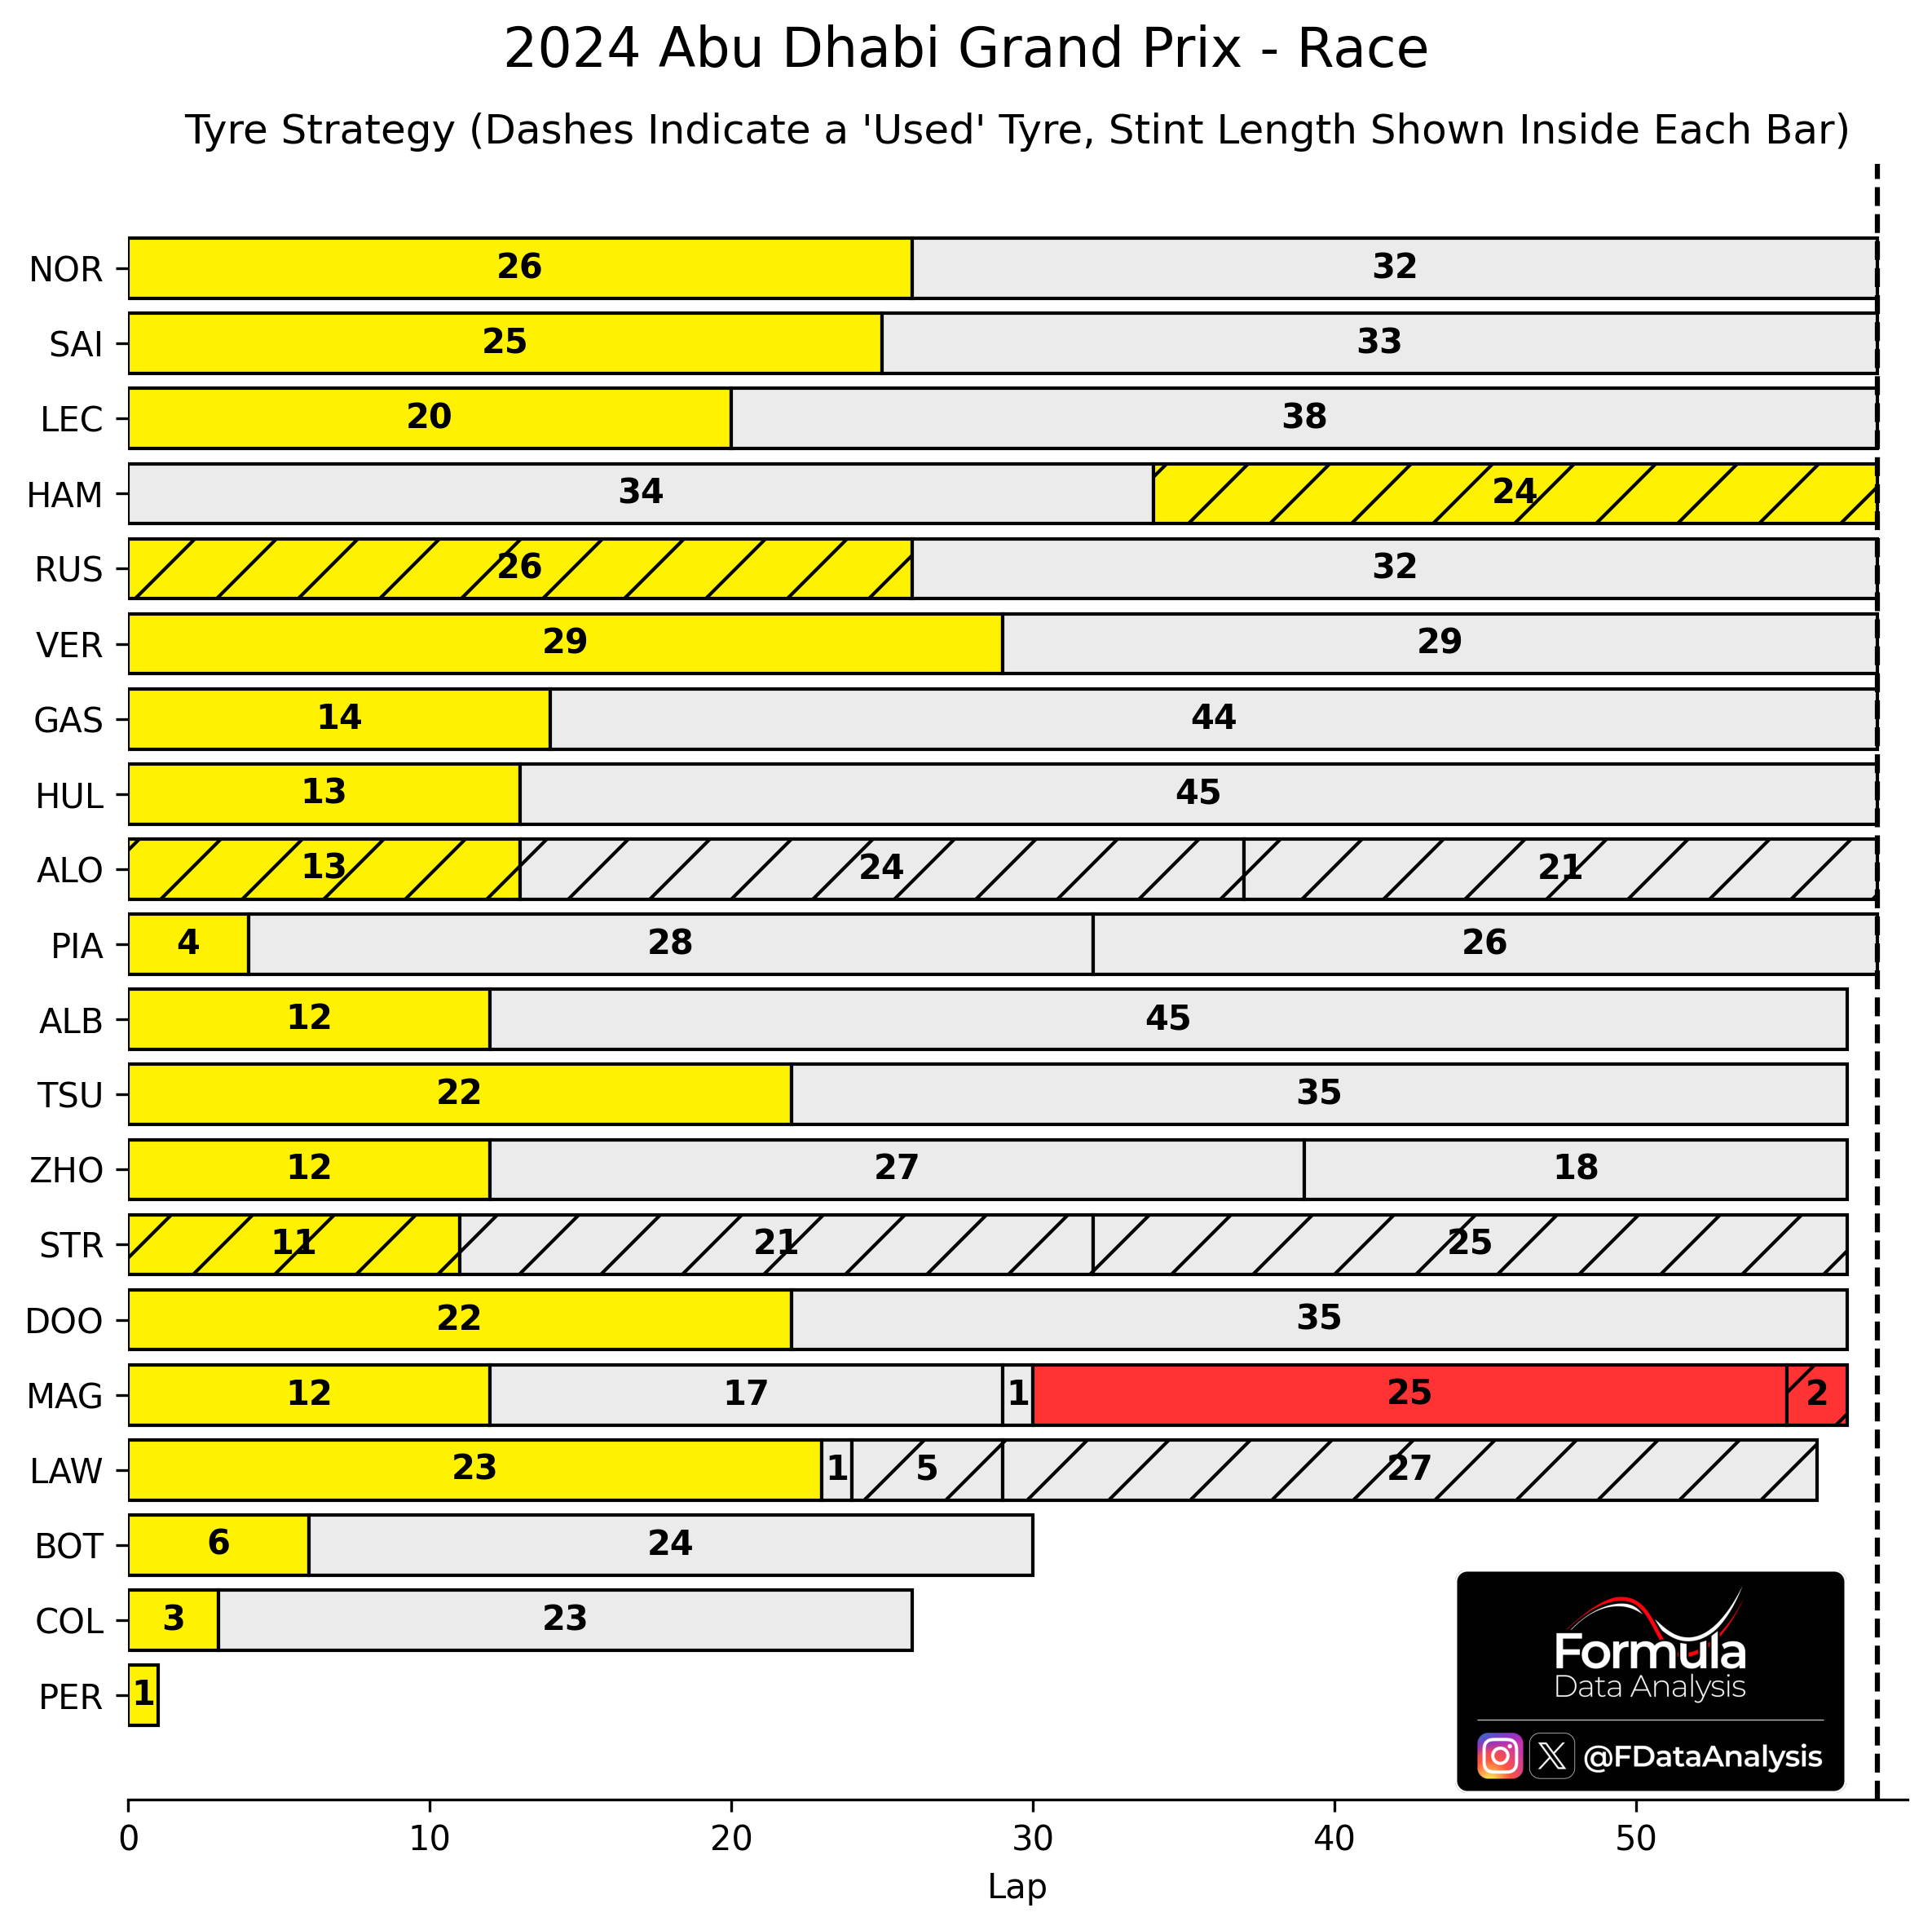
How to read: each bar represents a distinct stint; the number inside the bar is the total number of laps driven on that compound; a dashed bar means that the tyre set was a used one.
Only HAM started on Hards. Most drivers did an M-H strategy, while he did an H-M one: he started from the back and used that to try to overcut several drivers, and then put a fresher Medium to attack in the last part of the race (and it worked!). Note that LEC did the exact opposite: started on Mediums and went in full attack mode, then switched to Hards and started managing more.
Among the top drivers, LEC was the first one to pit. SAI, then RUS, NOR, and VER followed him (in this order), sacrificing the first part of the race to have a fresher set towards the end. ALO made a two-stopped work: he did M-H-H, which gave him a good enough pace boost to make up for the additional time lost in the pits. No driver except for MAG used the soft.
Race Pace
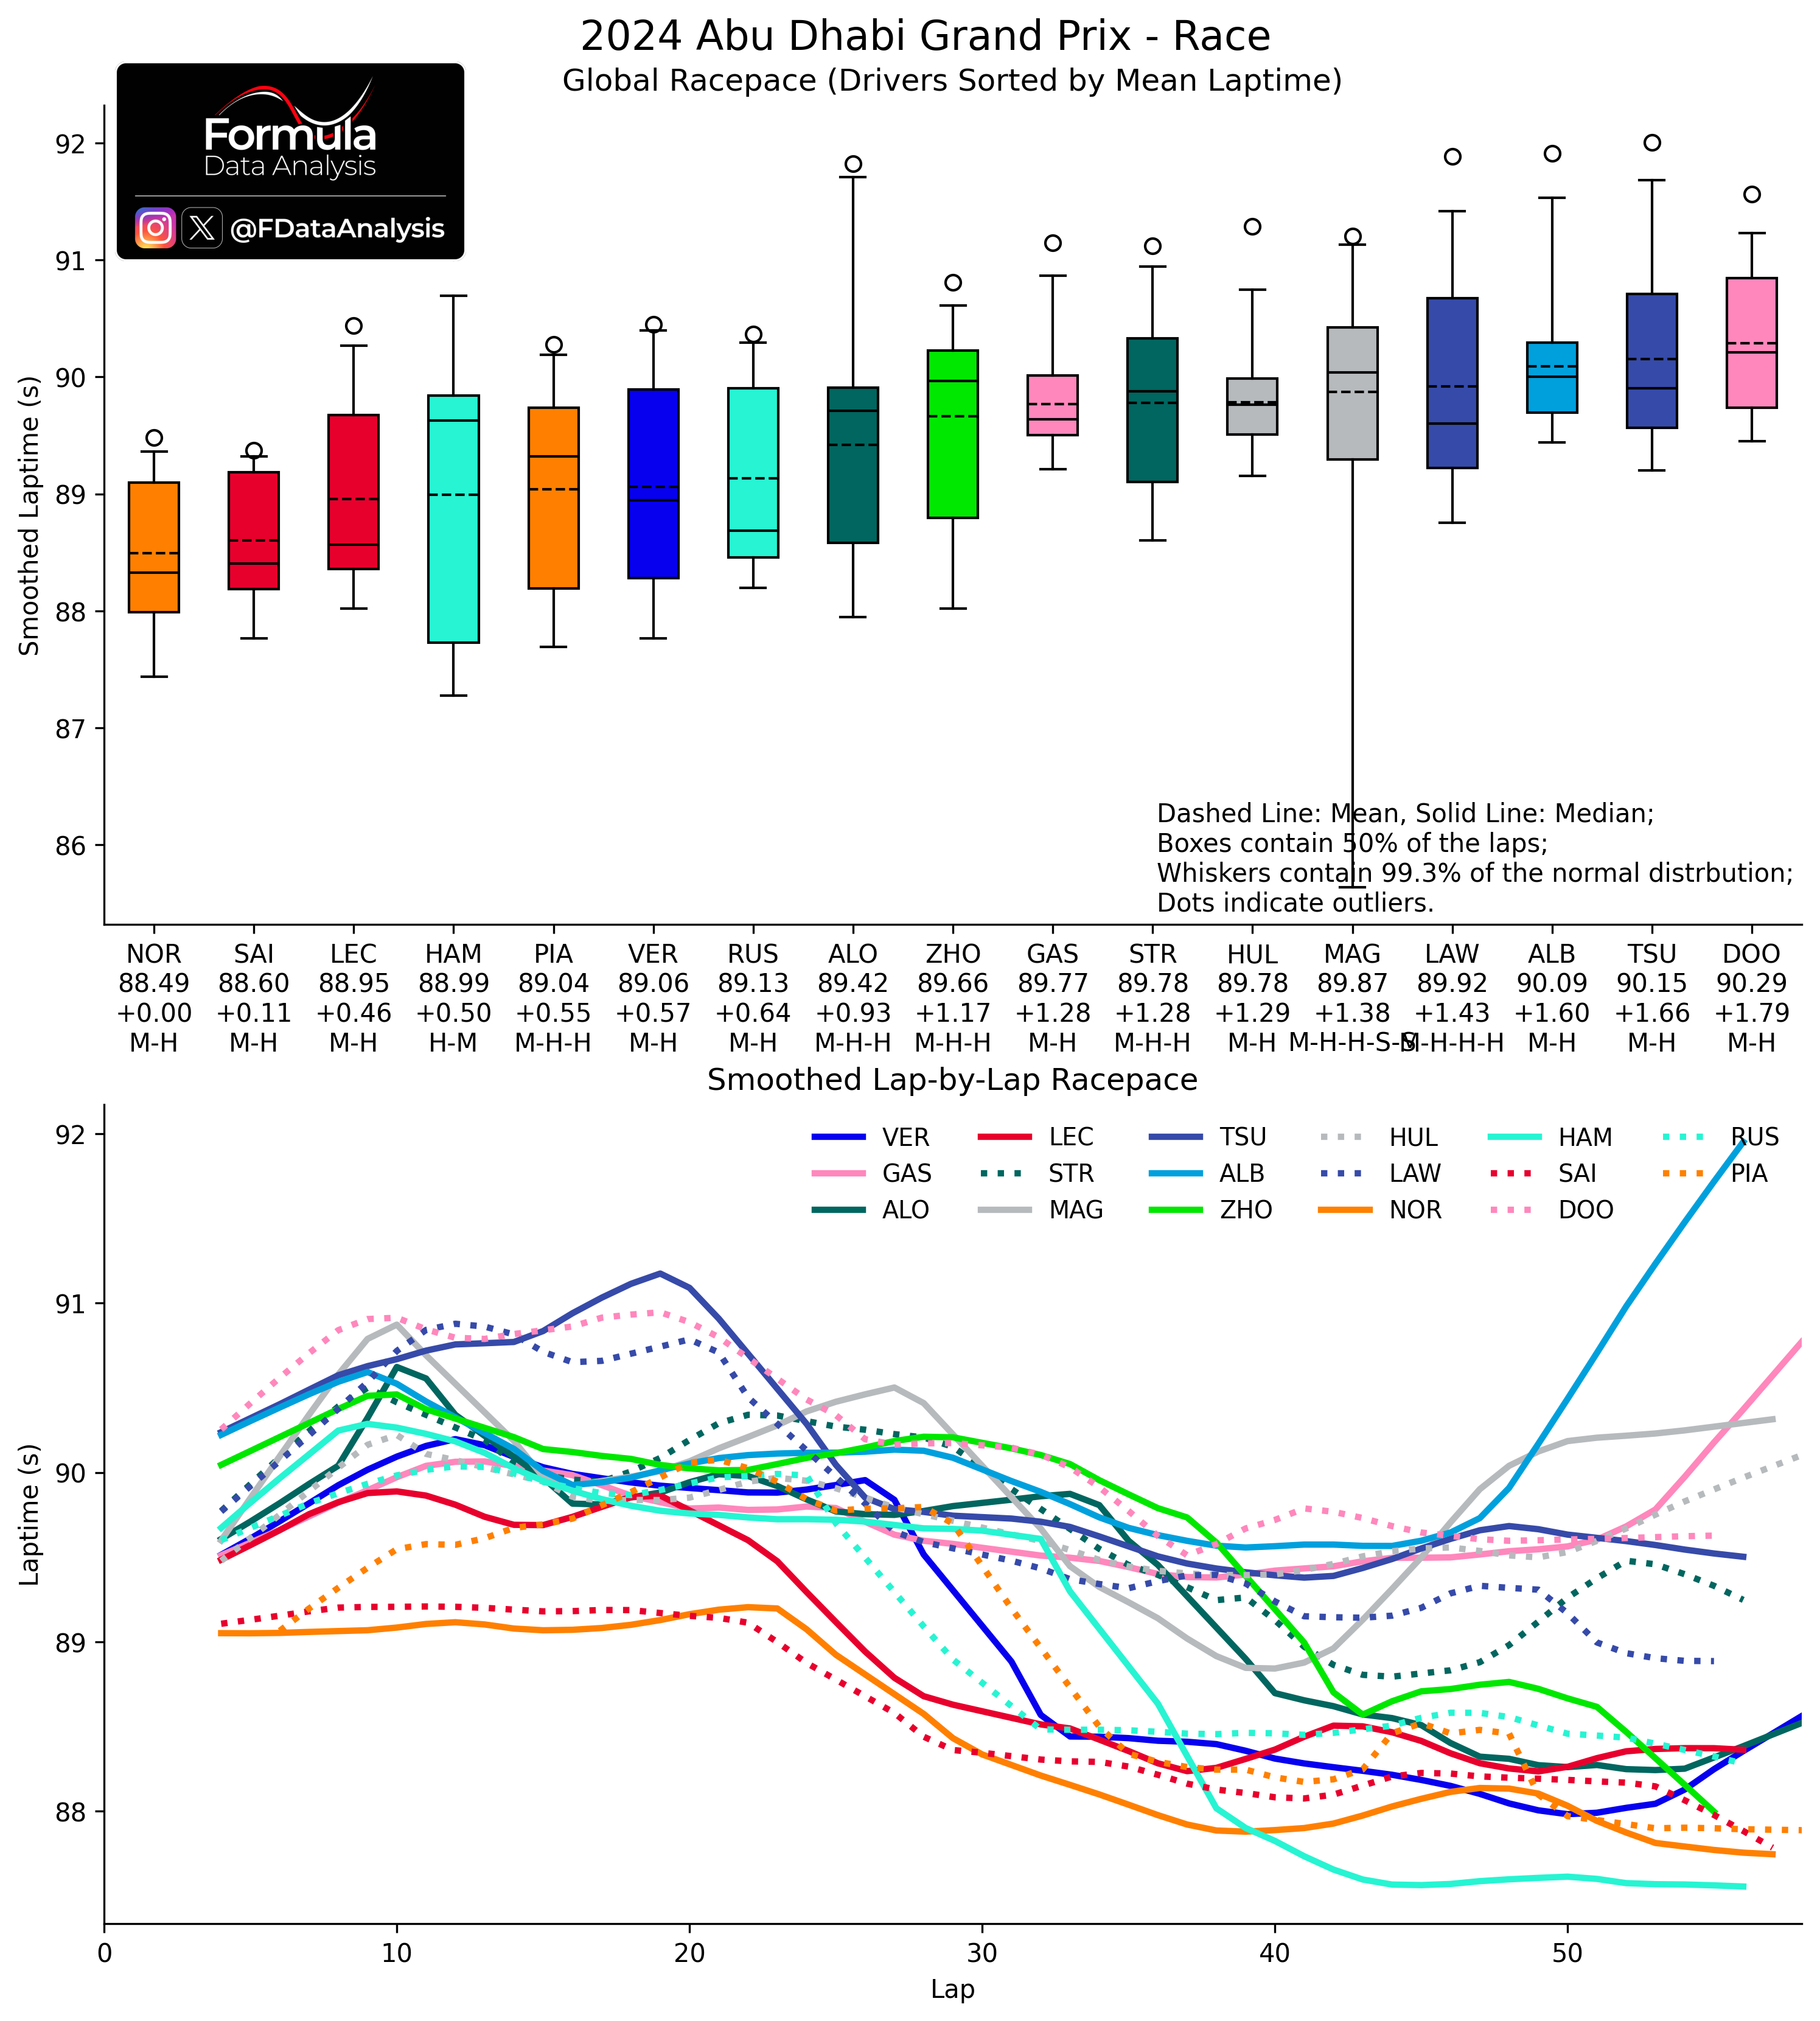
How to read: The upper plot shows the synthesis of each driver's pace during the race. The lower plot shows the (smoothed) evolution through the laps. Each bar contains the central 50% of the distribution: the shorter, the more consistent the pace. Inside it, the solid line indicates the MEDIAN (how quick was the TYPICAL lap), while the dashed line indicates the MEAN (how quick was a lap ON AVERAGE). The whiskers include all the laps from a driver which are not uncharacteristically slow for that driver: the lower whisker, in particular, shows that driver's quickest lap. The mean lap time is indicated below each drive's name, and below is the gap to the quickest driver. The bottom line indicates the tyres used: only compare directly drivers who did the same number of pit stops, as using more tyre sets makes one faster on average, at the expense of more total time being lost in the pits.
NOR was quickest, and that was clear from the TV. His advantage over SAI was 0.11s/lap: nothing huge, all things considered. The gap grew in the second part of the race, as SAI could not keep up with his pace on worn Hards.
LEC was 3rd quickest, which is impressive considering that he overtook more drivers than anybody else! He could do little in the last 20 laps to make up for the worn state of his Hards.
HAM had a very high variance in lap times: his slow laps were slower than LEC's, but his fastest ones were better than NOR's! That is the effect of driving in traffic in the first part, and then having fresh and softer tyres in the end to push 100% in free air. He was 0.14s/lap quicker than his teammate. PIA and VER had a pace similar to his. By using one additional tyre set compared to GAS and HUL, ALO and ZHO were quicker than them on average. Still, they finished behind them, due to the additional time lost in the pits. Not a terrible debut for DOO, in my opinion: 0.5s/lap slower than GAS (who drove excellently) in his very first F1 race
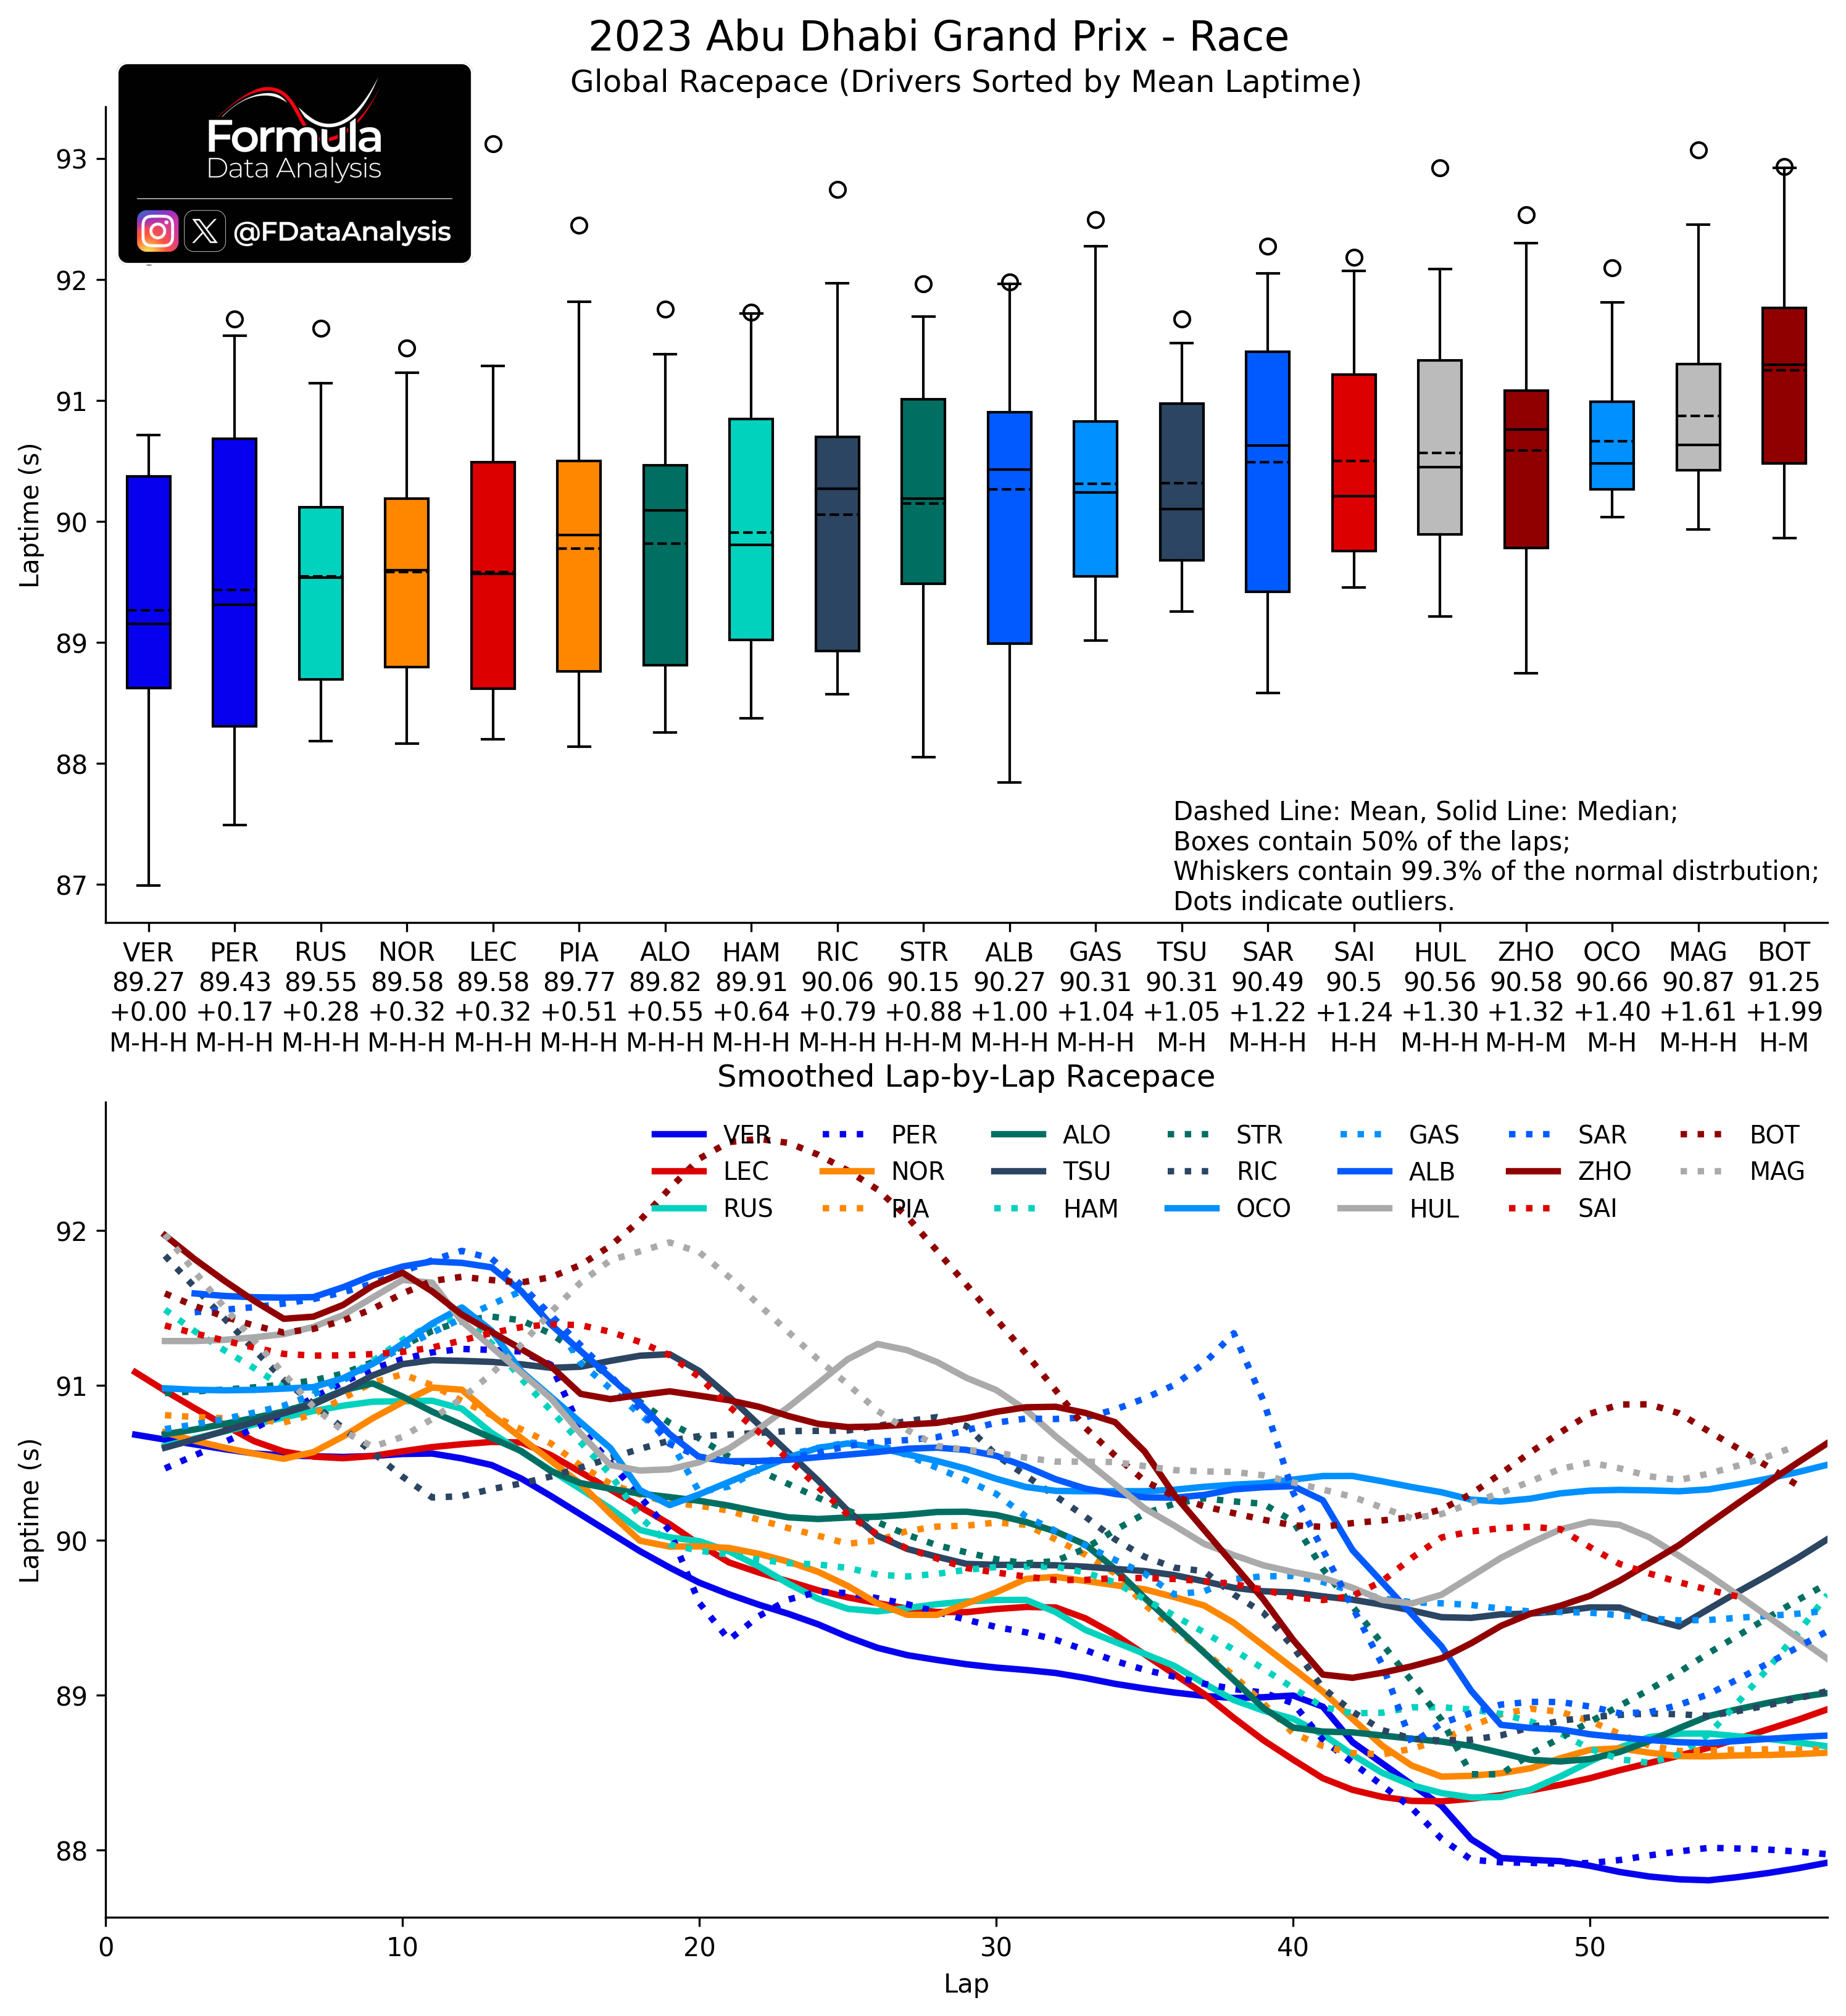
Last year's race pace, for comparison:
RBR's strong pace has disappeared, and Mercedes has gotten slower too. Ferrari continued to fight McL, being slightly slower than them. Aston's downfall doesn't cease to surprise.
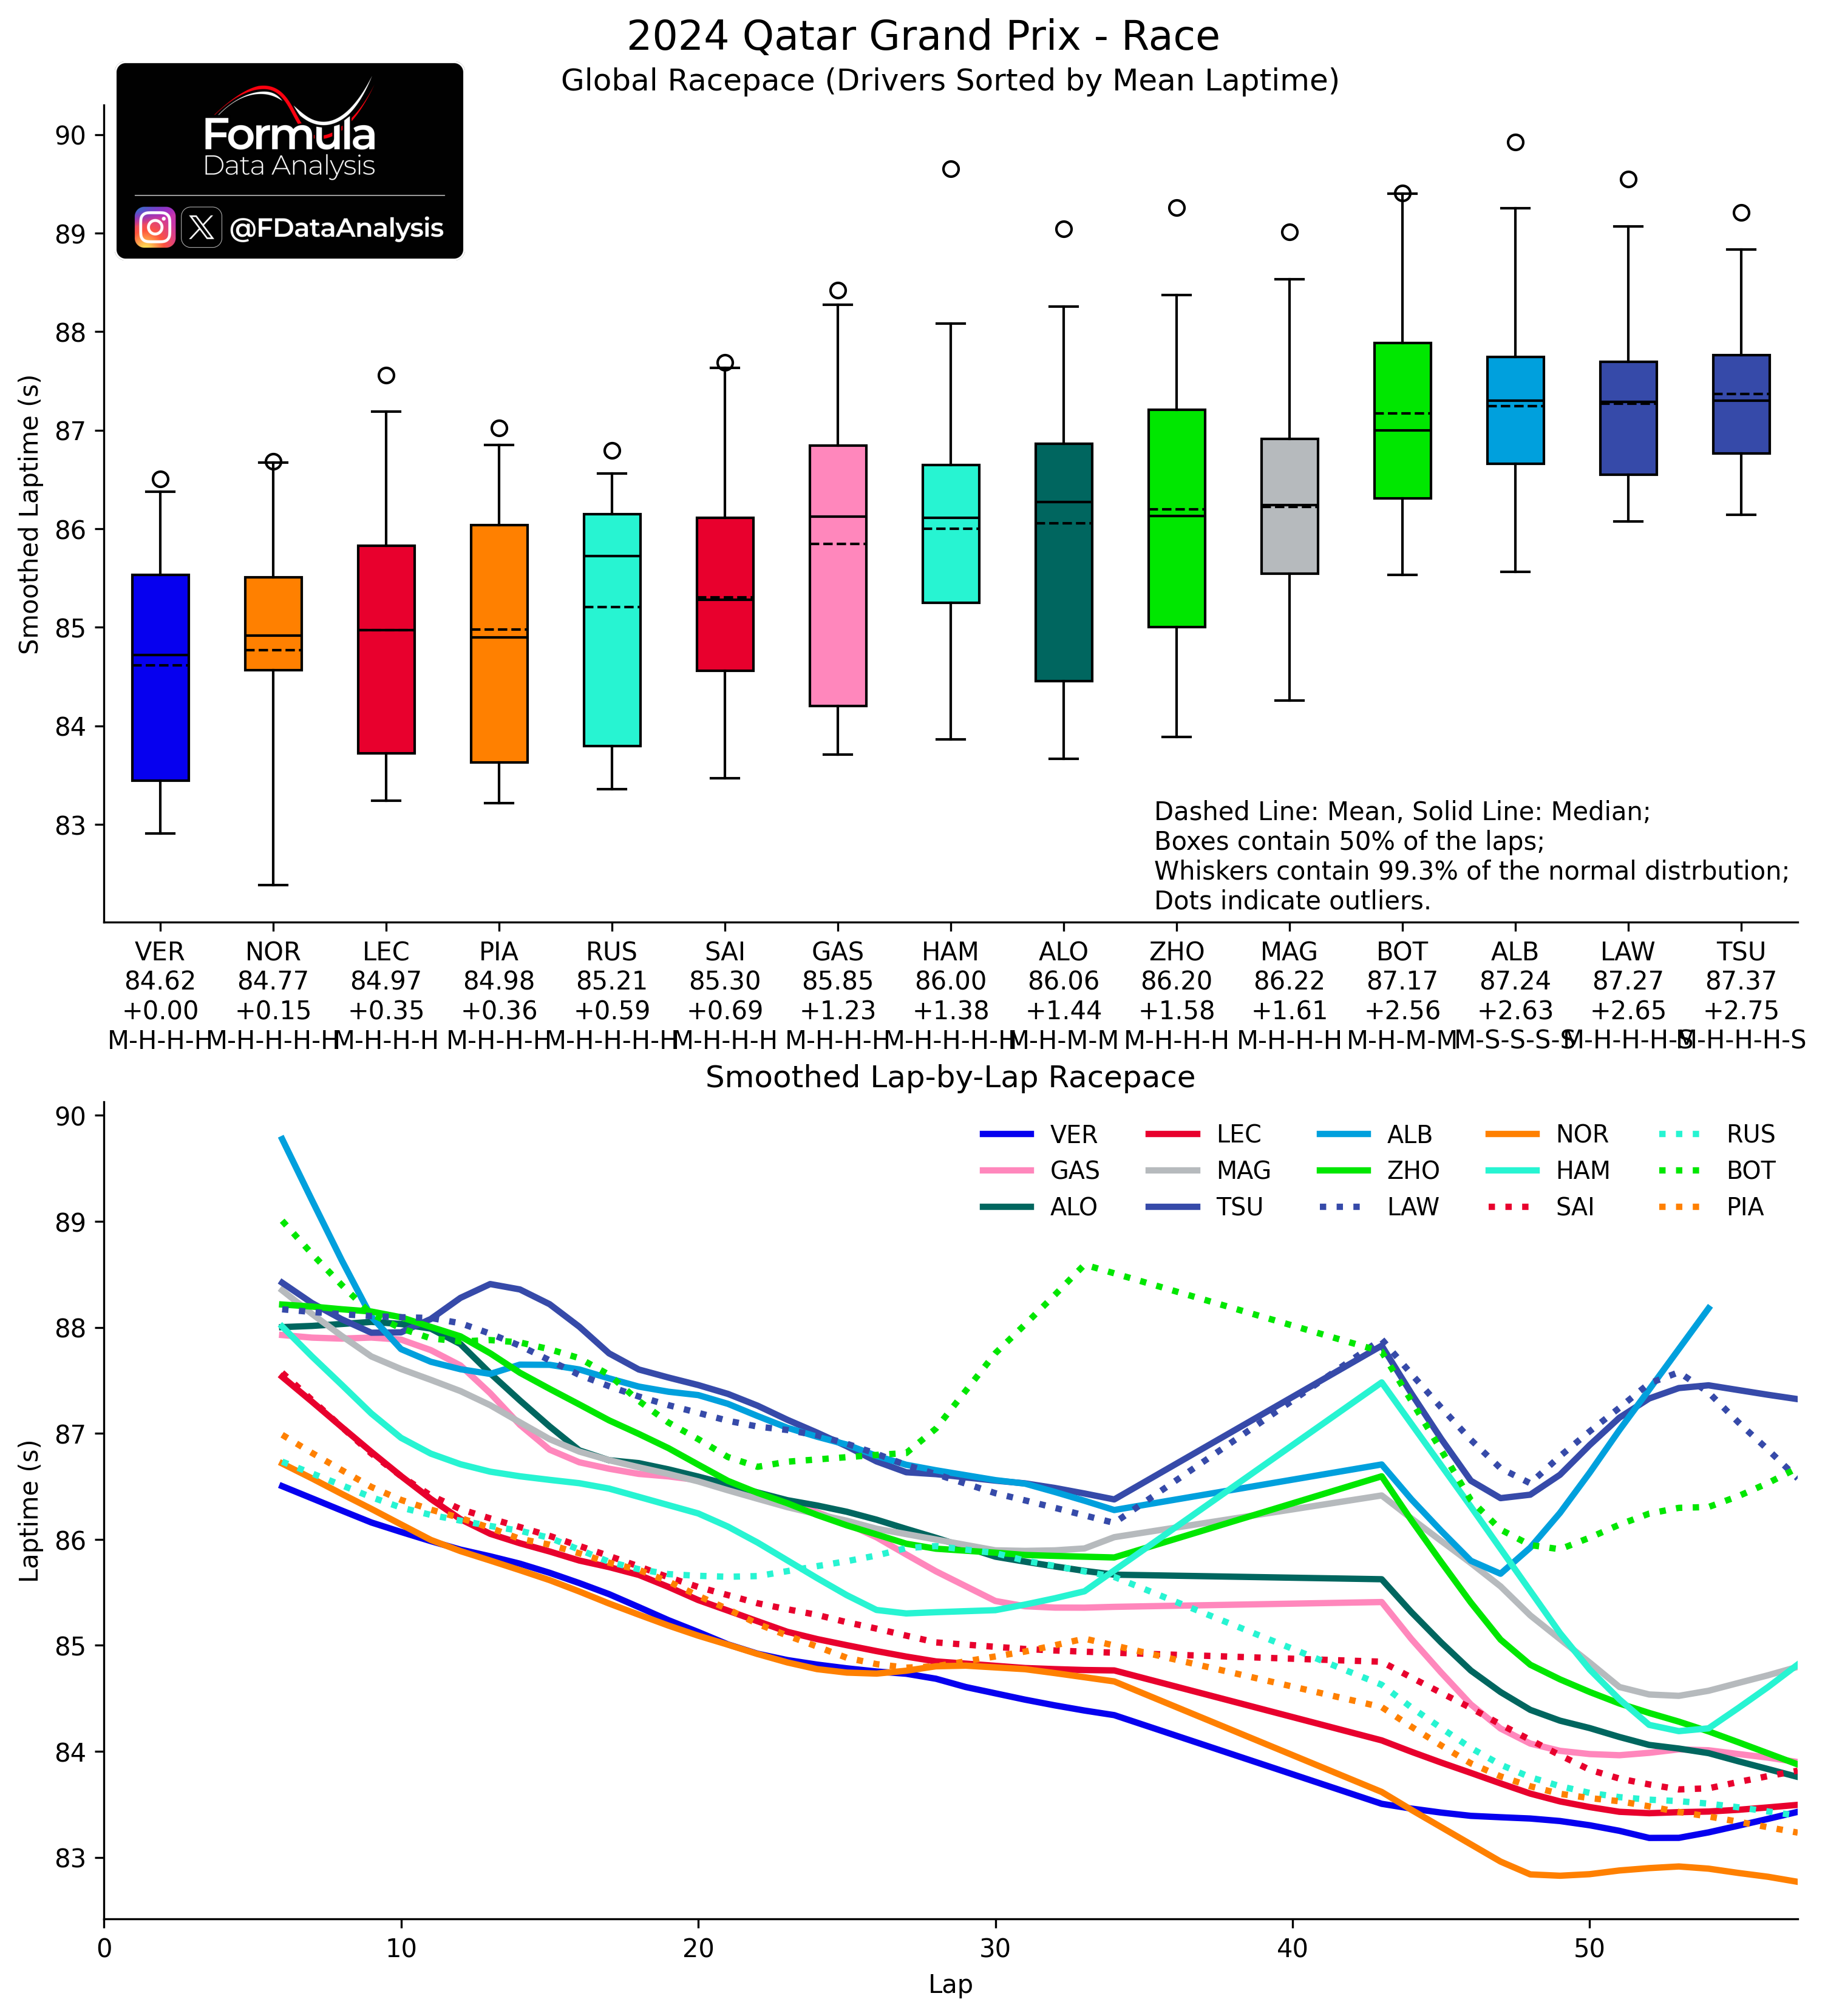
Race pace in the last race (Qatar) was, for comparison:
RBR's strong form didn't last: Ferrari and McL were back on top! The pecking order didn't change concerning McL, Ferrari, and Mercedes, but the Italian team was closer to the papaya one in Abu Dhabi than in Qatar.
Top Speeds
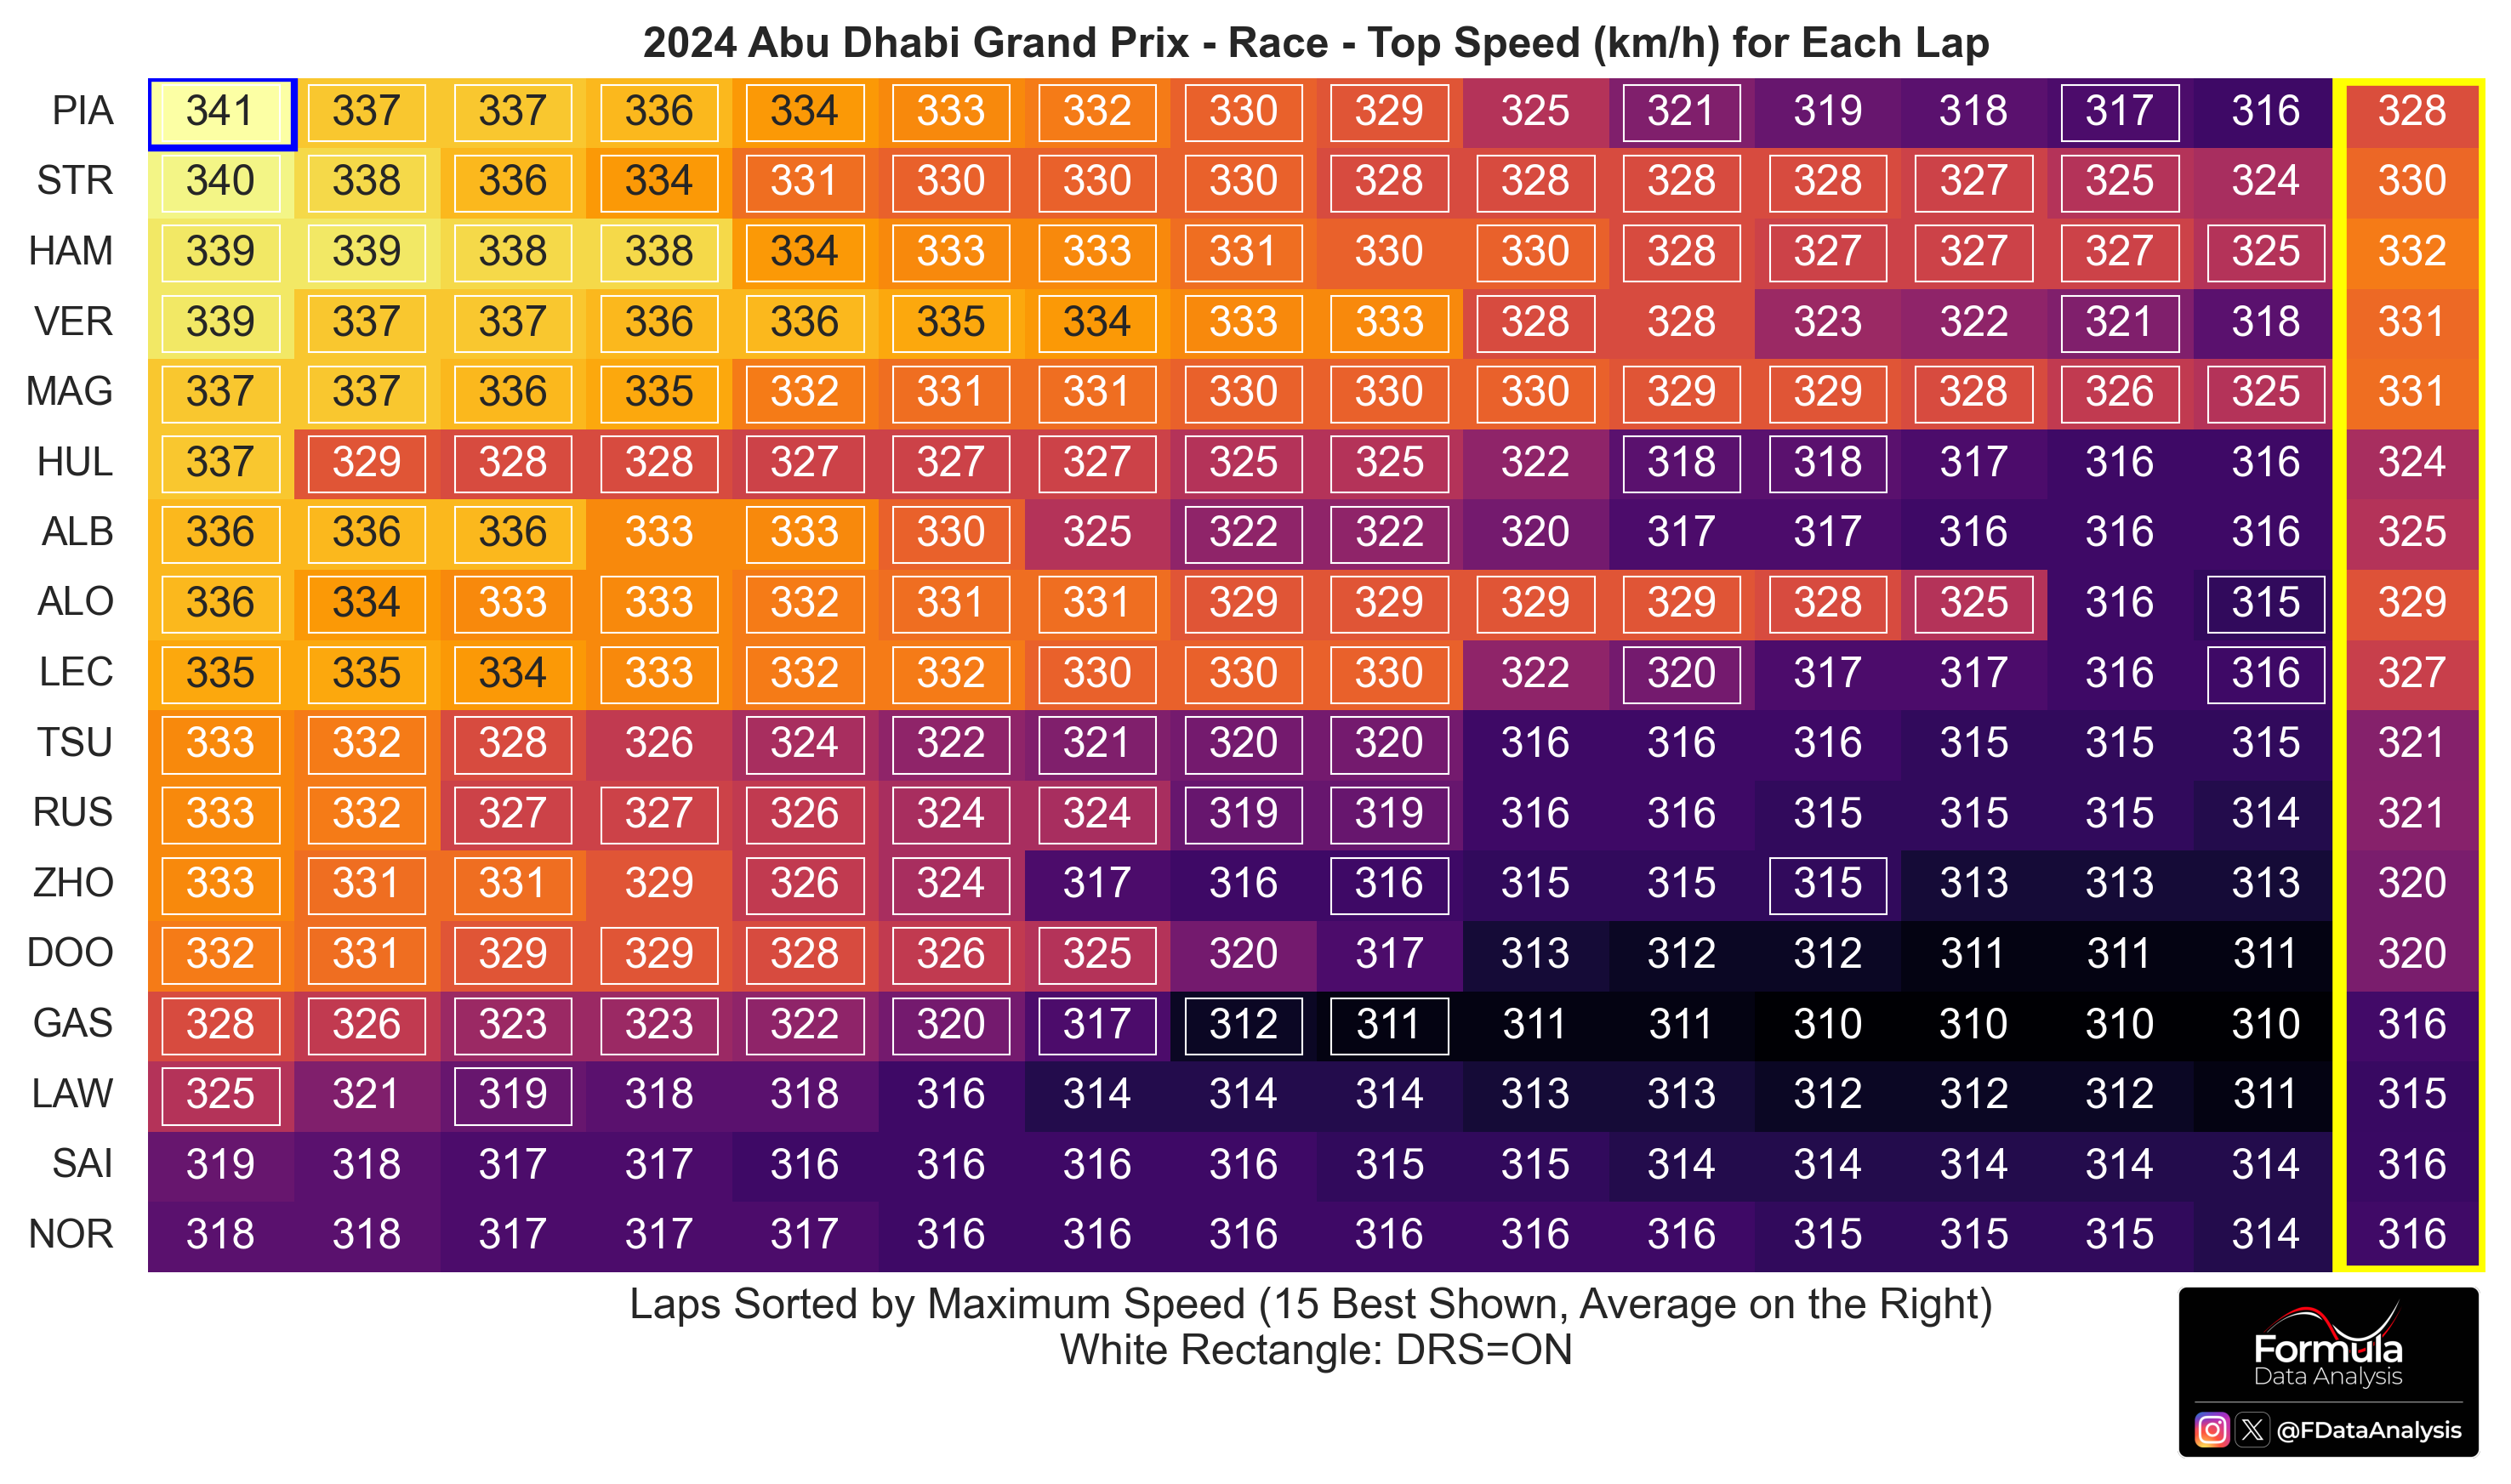
How to read: the chart shows the highest top speed values reached by each driver during the race. The drivers are sorted in descending order of highest to lowest top speed. For a given driver, the top speeds in each lap are sorted from highest (left) to lowest (right): the highest 15 values are shown. The column on the right shows the average of these 15 values. The values relative to DRS being active are surrounded by a white box.
PIA reached 341km/h in the race, during his recovery drive. Meanwhile, his teammate reached the lowest top speed (318km/h). On average, HAM was the fastest. Notably, ALB reached 325 without DRS.
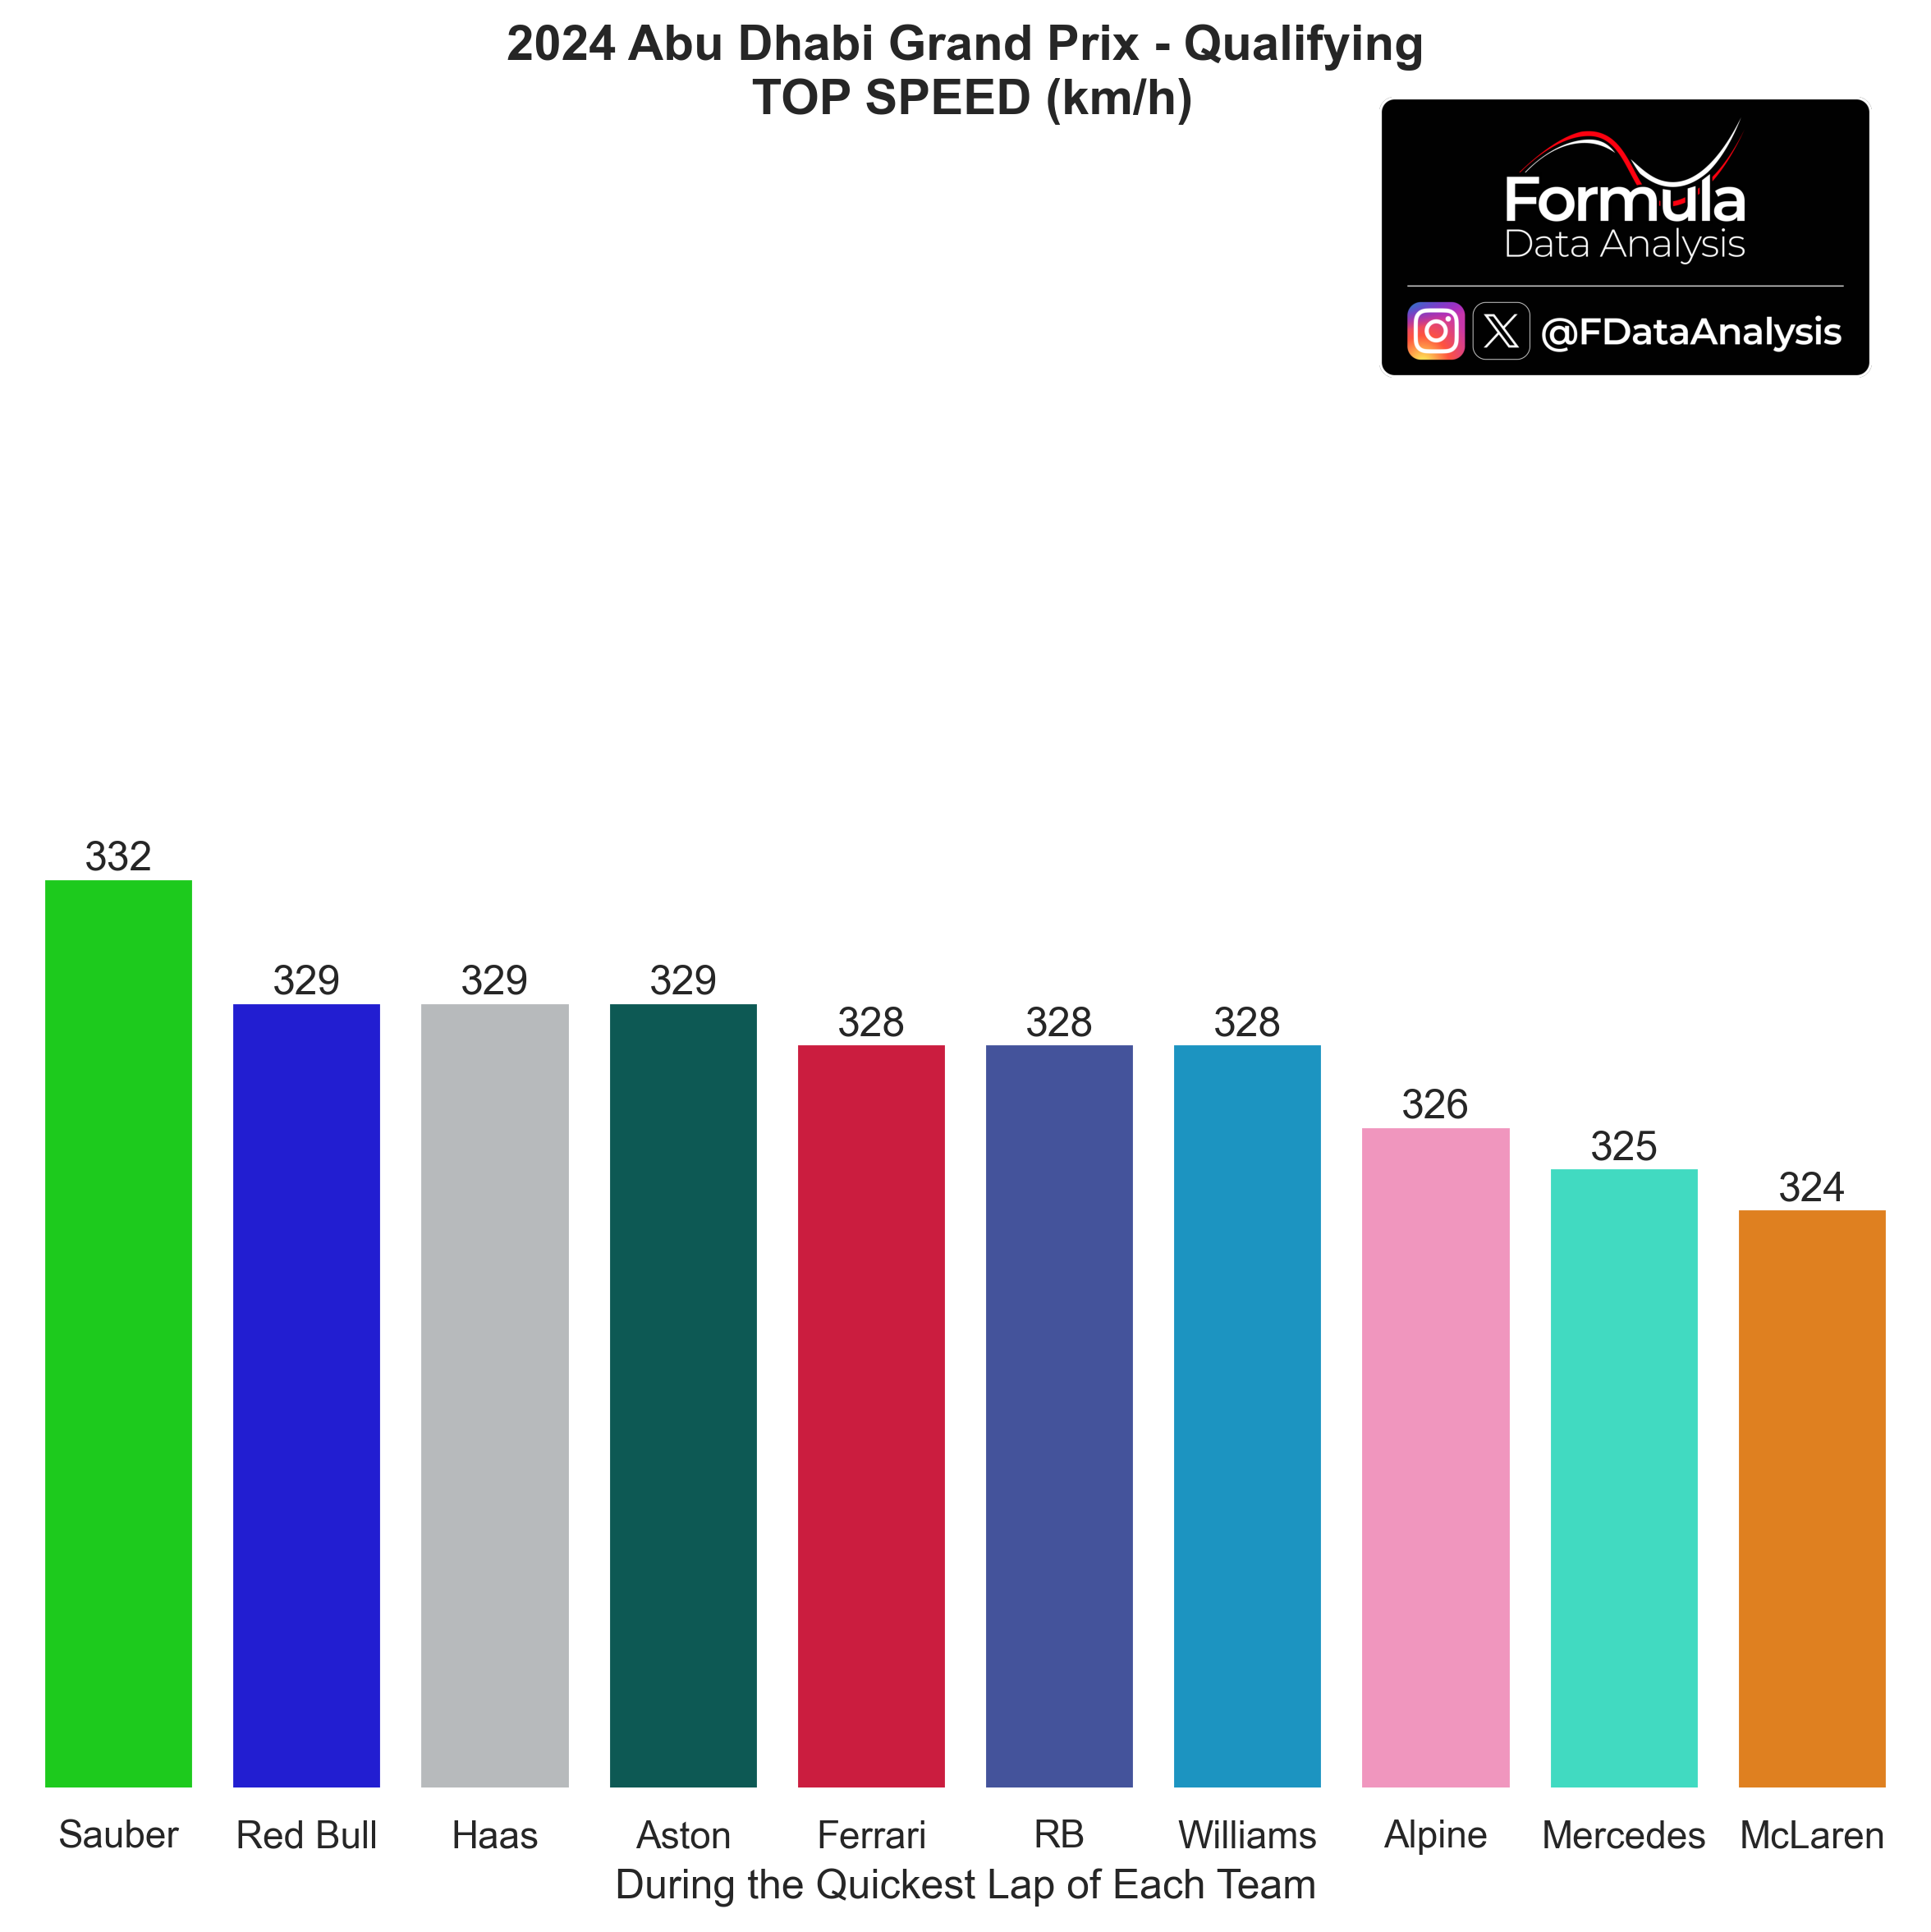
The top speeds from qualifying (below) provide a clearer picture of who was running less drag, as all drivers were under similar conditions (maximum ERS deployment, DRS, and no or minimal tows):
Sauber's excellent top speed didn't make them top the top speed charts in the race. Conversely, McL's and Mercedes' high drag didn't prevent them from being very fast in the race (due to PIA's and HAM's frequent tows)
Overall Compound Performance
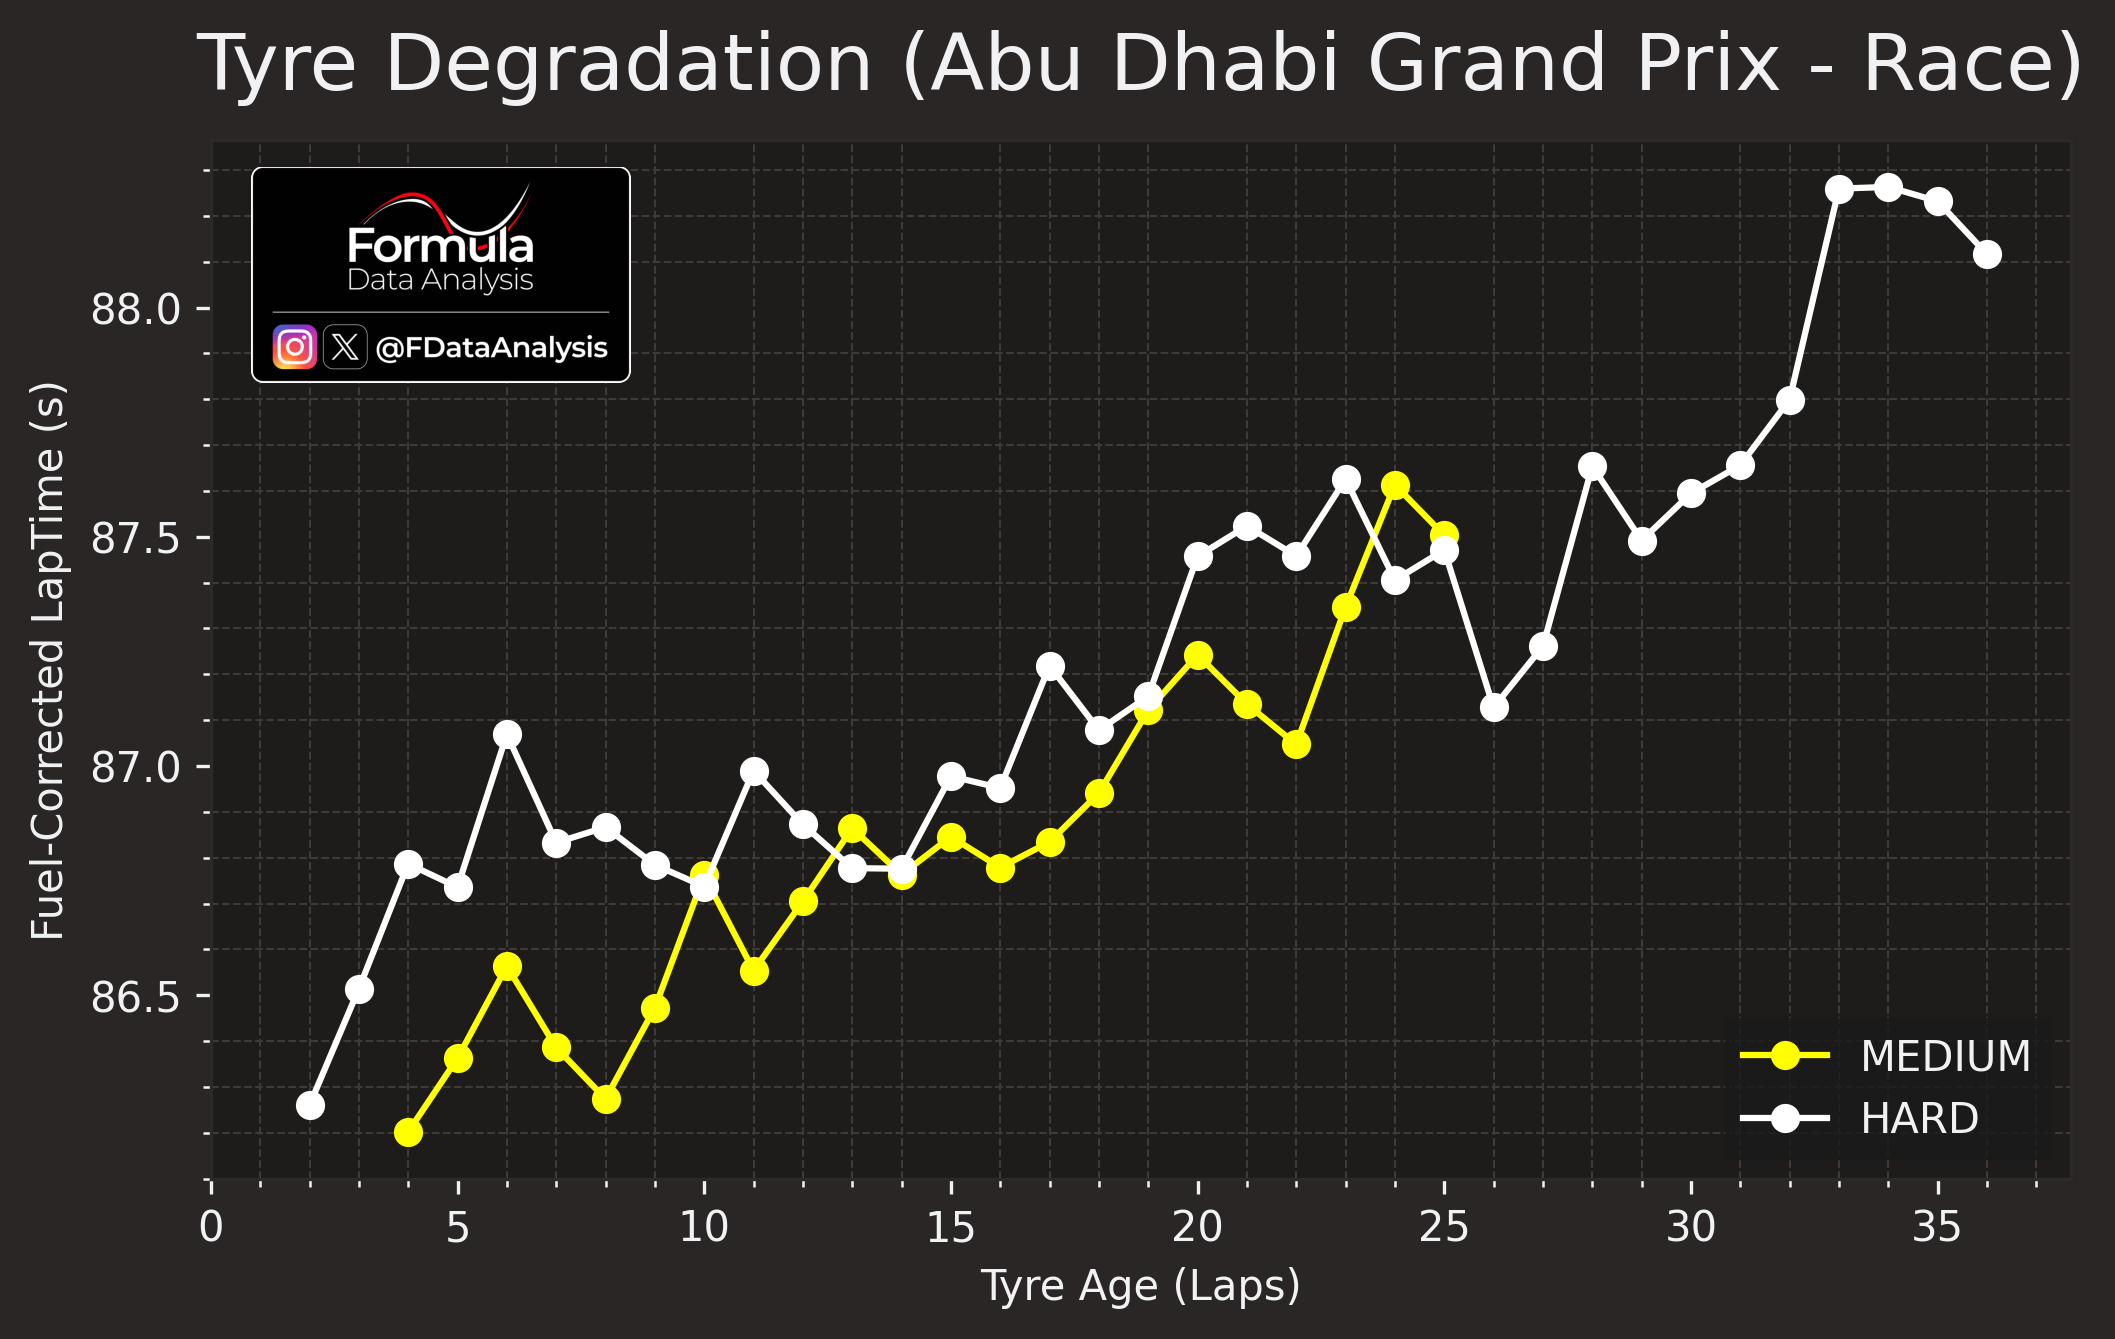
How to read: the chart shows the fuel-corrected lap time produced on each tyre compound at a given 'tyre age'. It is produced by taking the fastest lap for a given tyre age when at least 3 drivers reached that tyre age.
The Mediums were quickest or at least as quick throughout all their life. Hards allowed to perform more laps, but were overall inferior.
Pit Stops
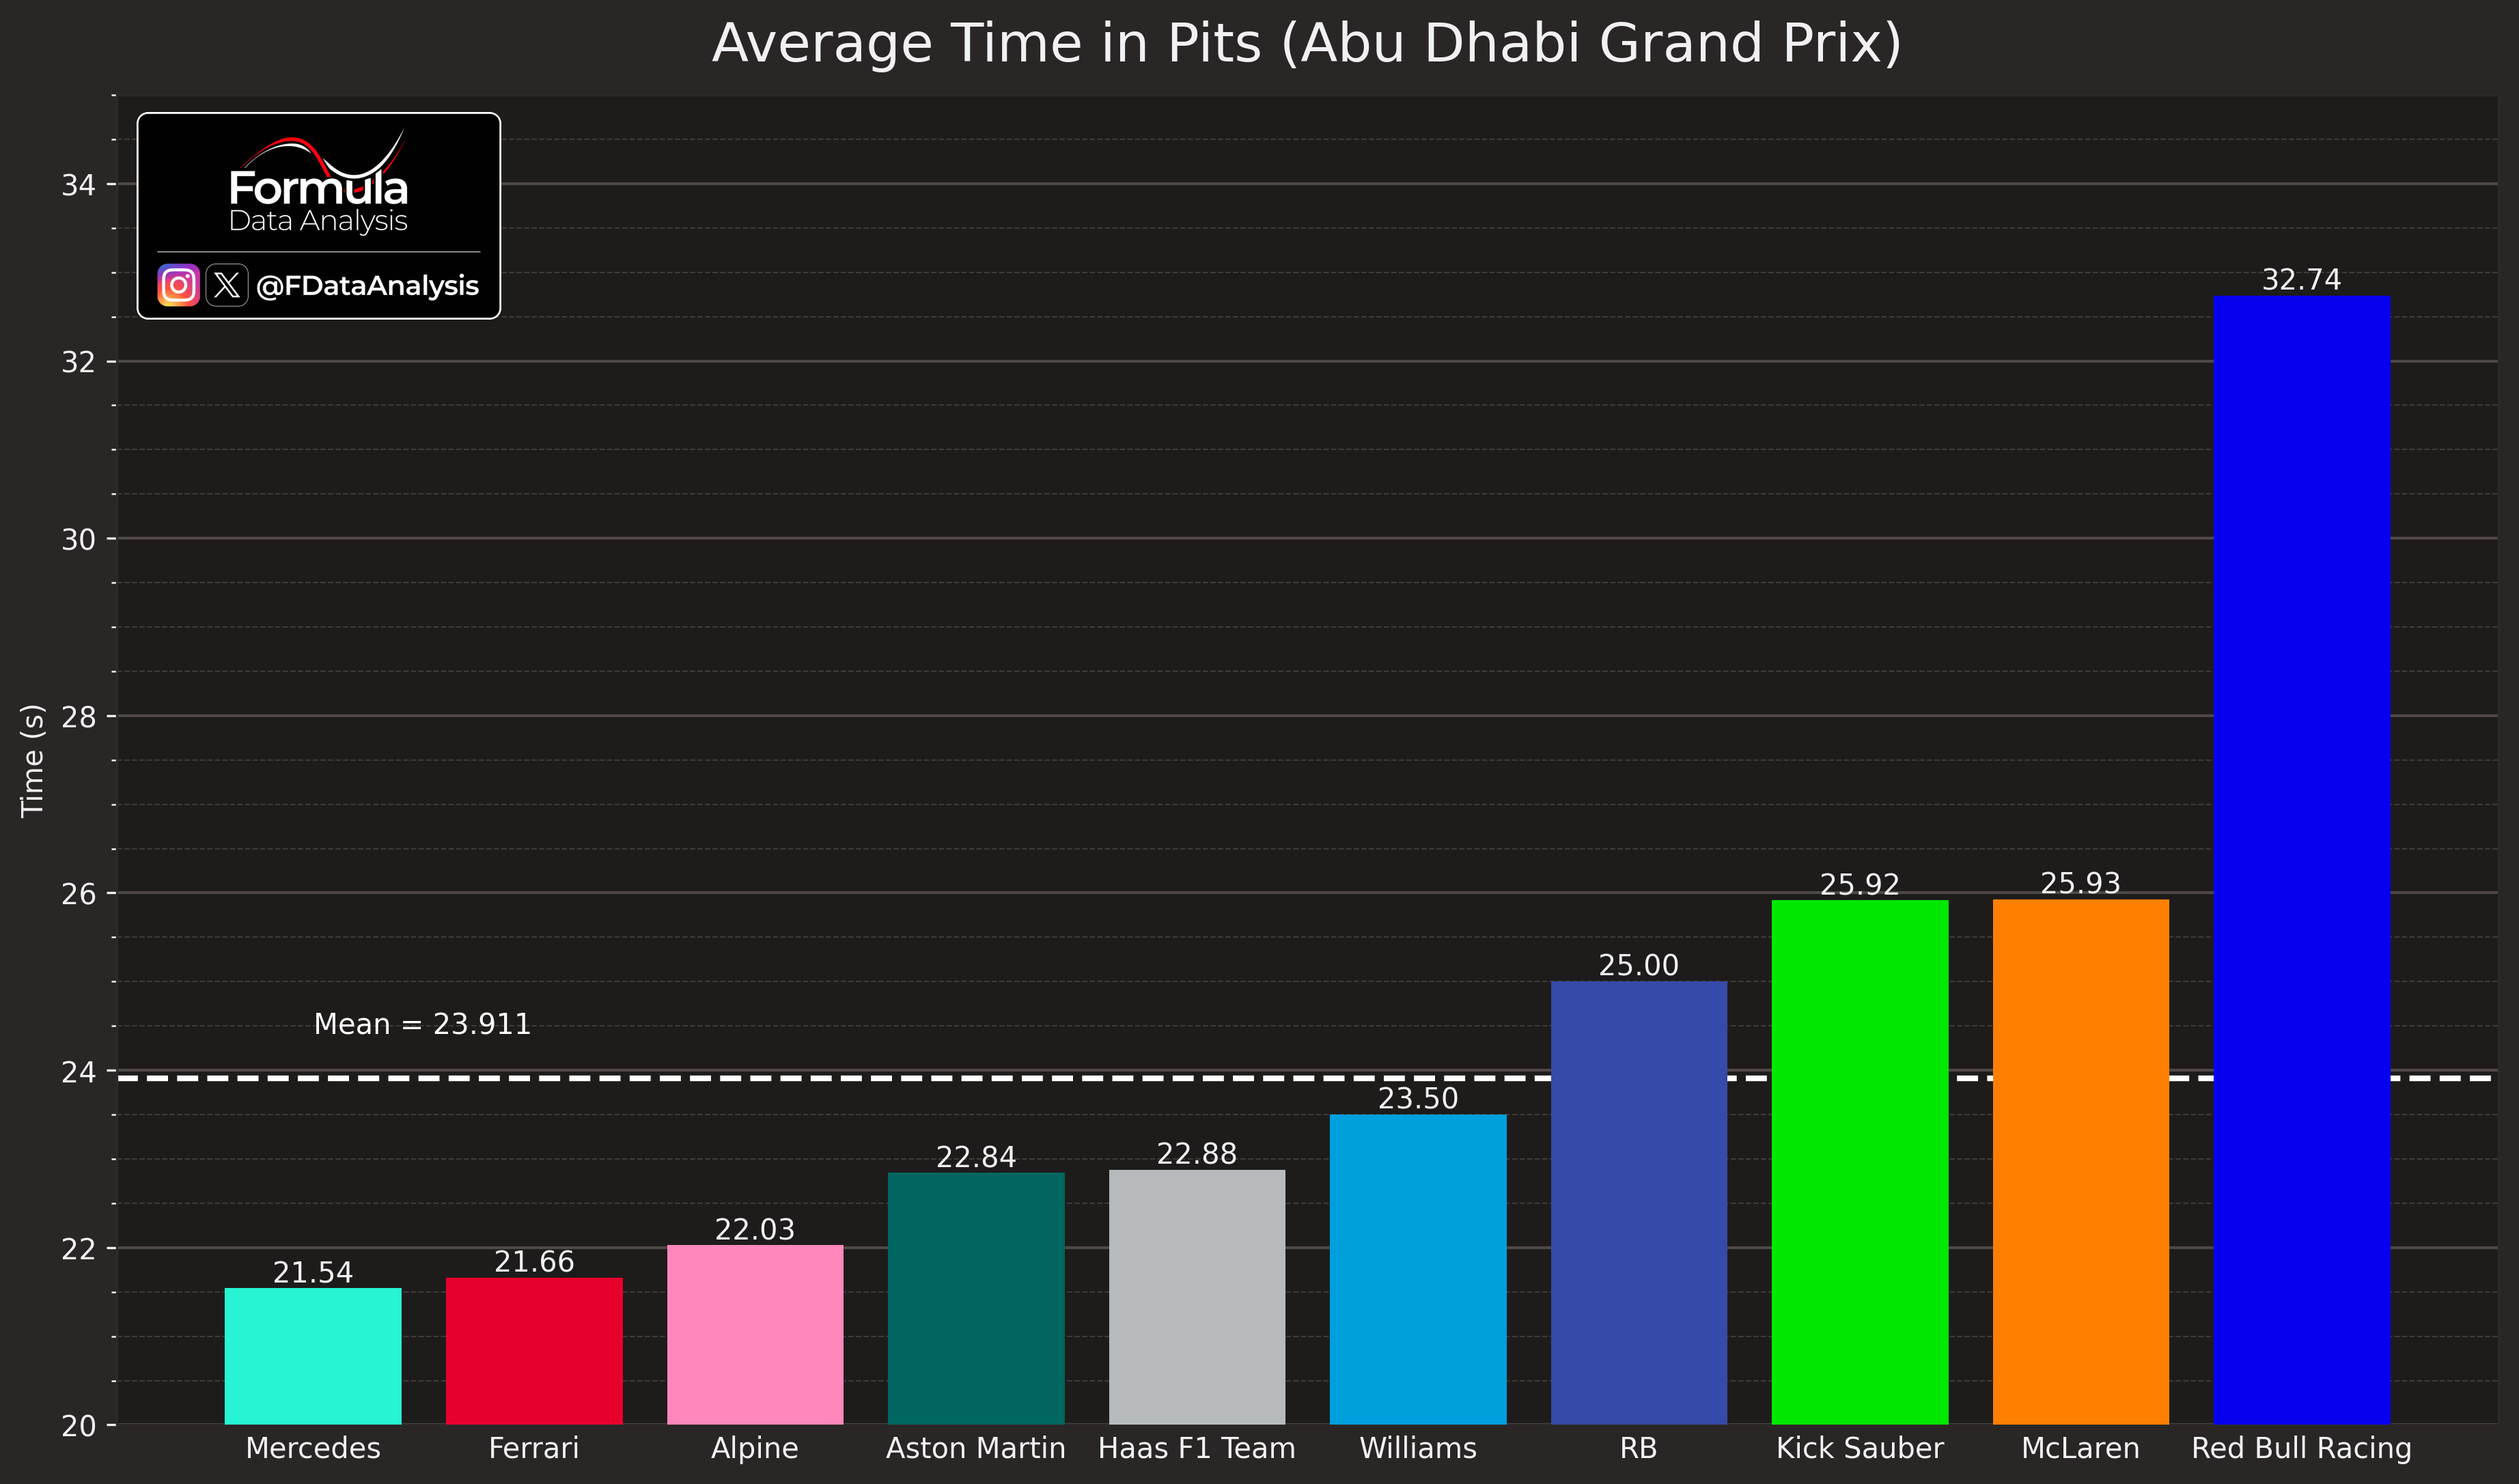
How to read: The average time spent in the pit (from the entry to the exit line) is shown for each team. The mean for all teams is also shown as a dashed line.
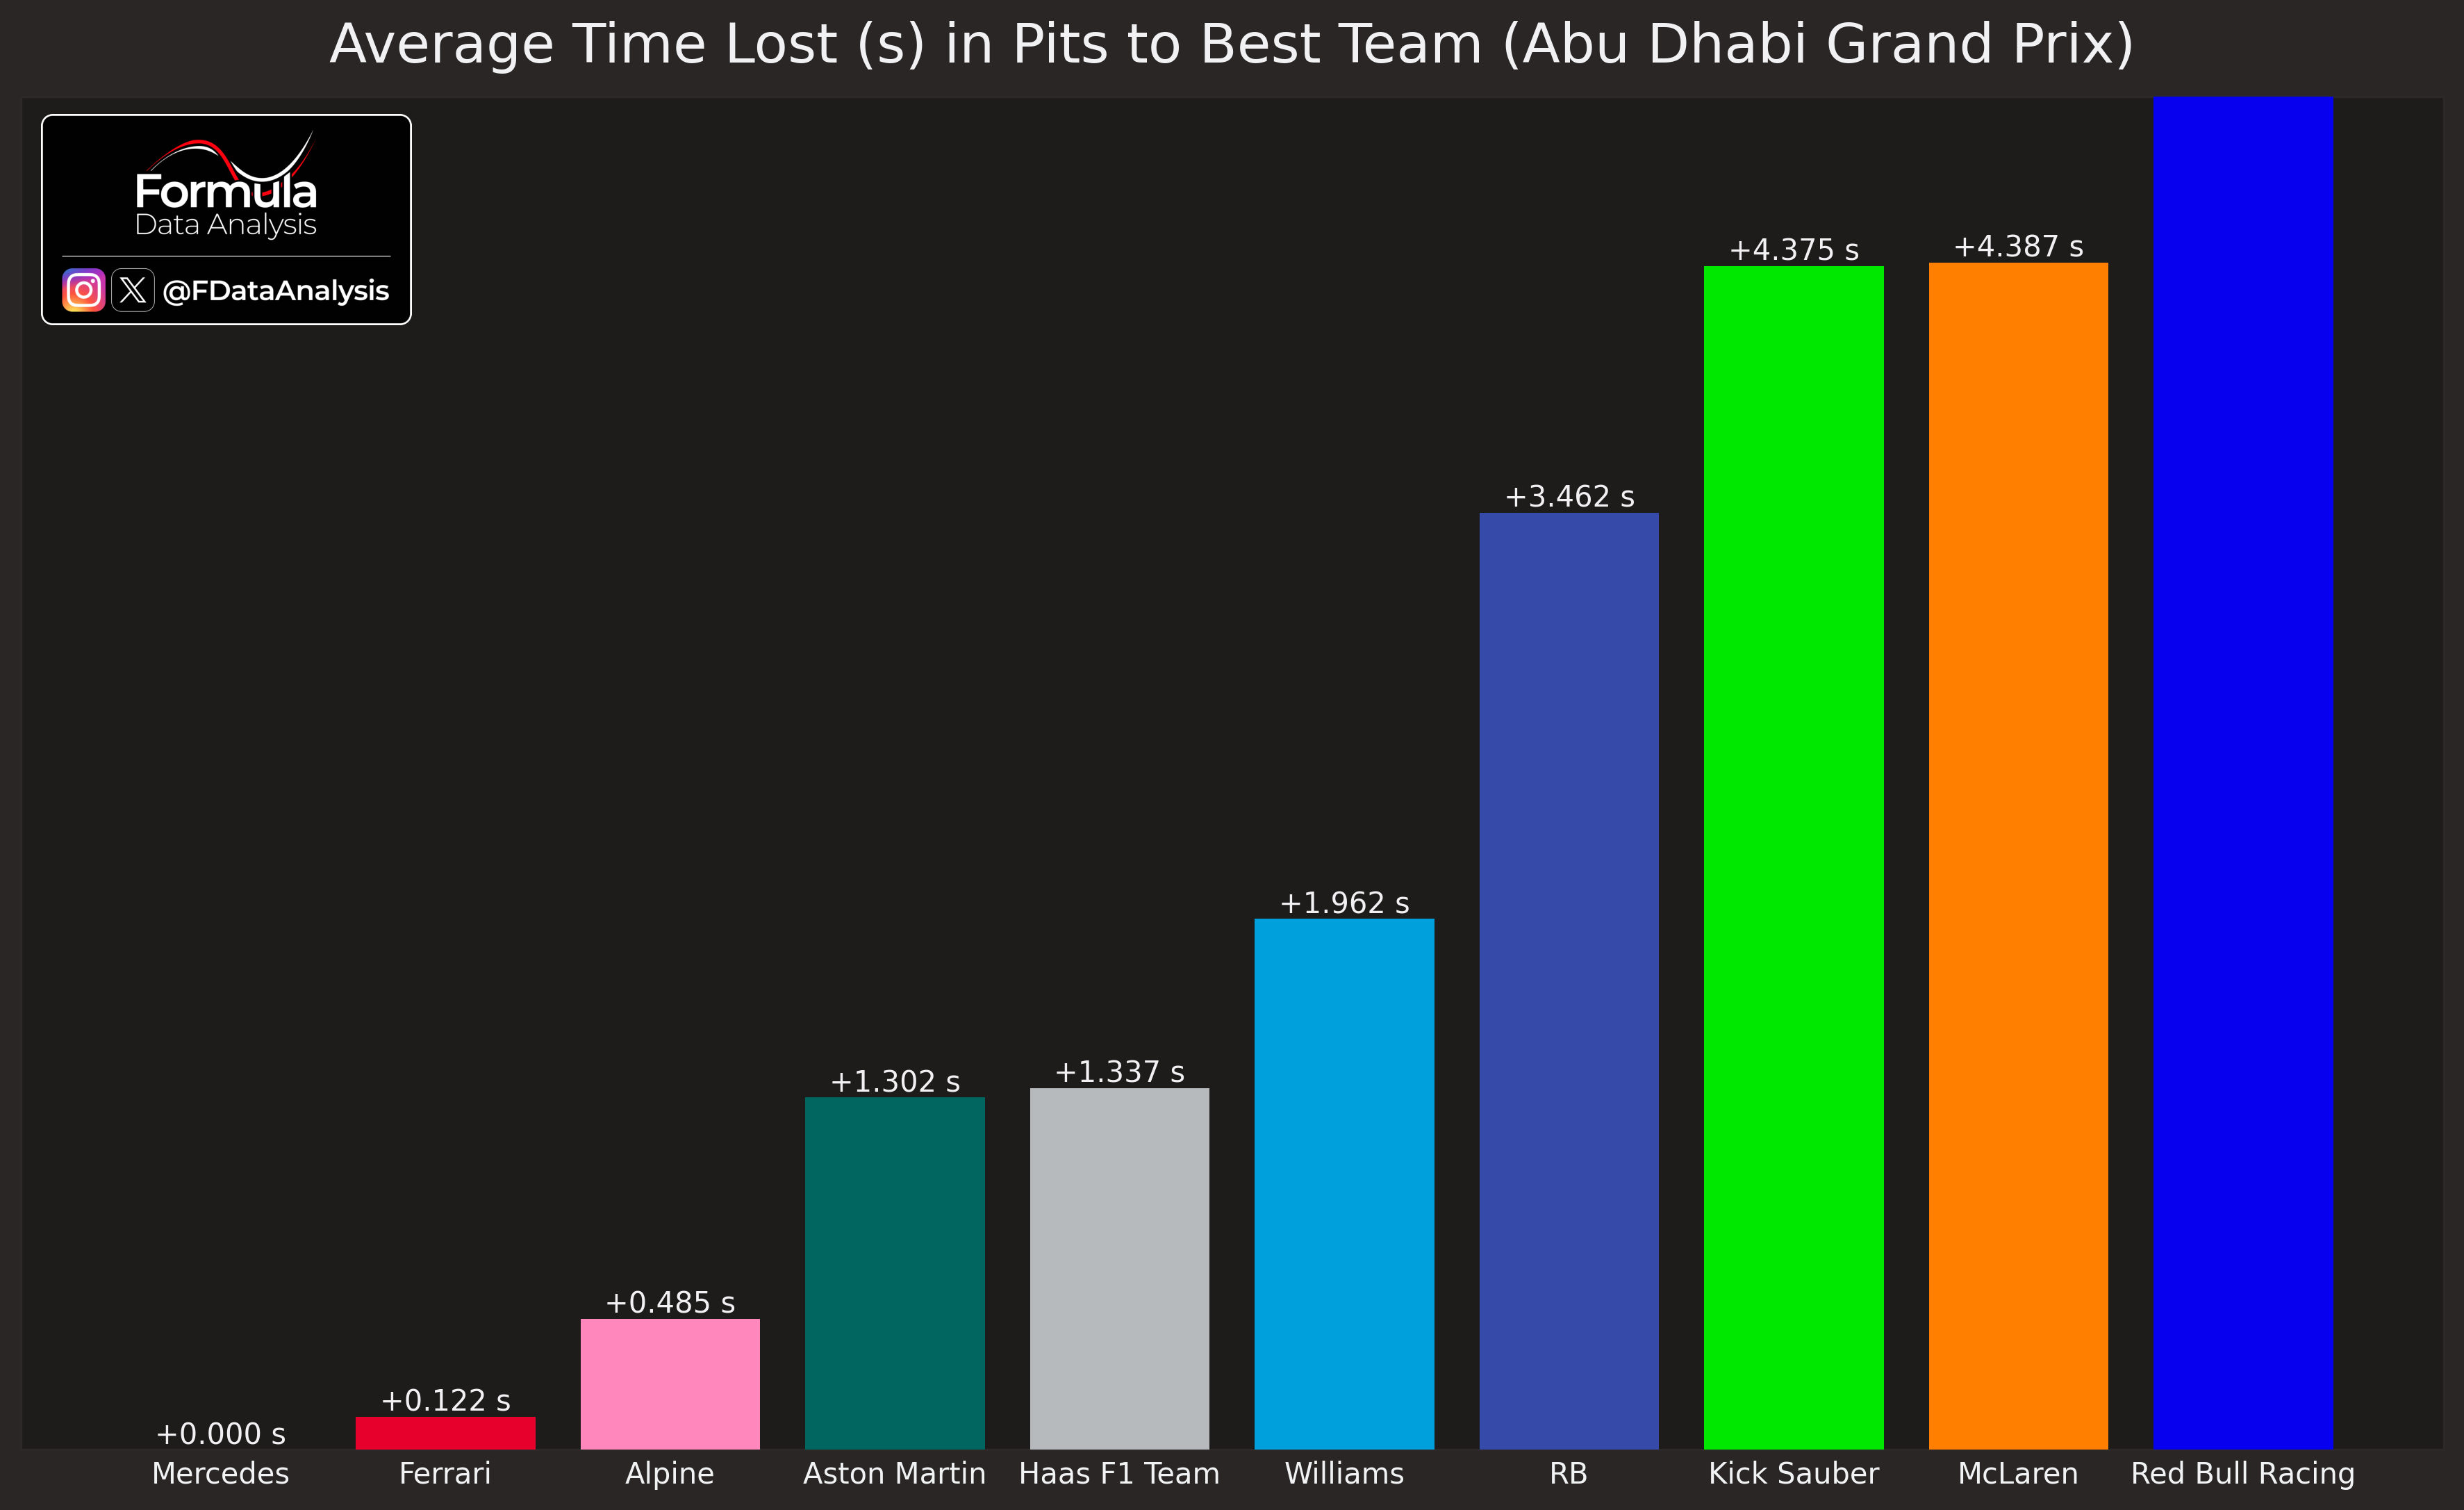
Mercedes and Ferrari were quickest in the pits: excellent performance! Williams, Racing Bulls, Sauber, McL, and RBR were either hit by damages or by penalties.
Stint Analysis
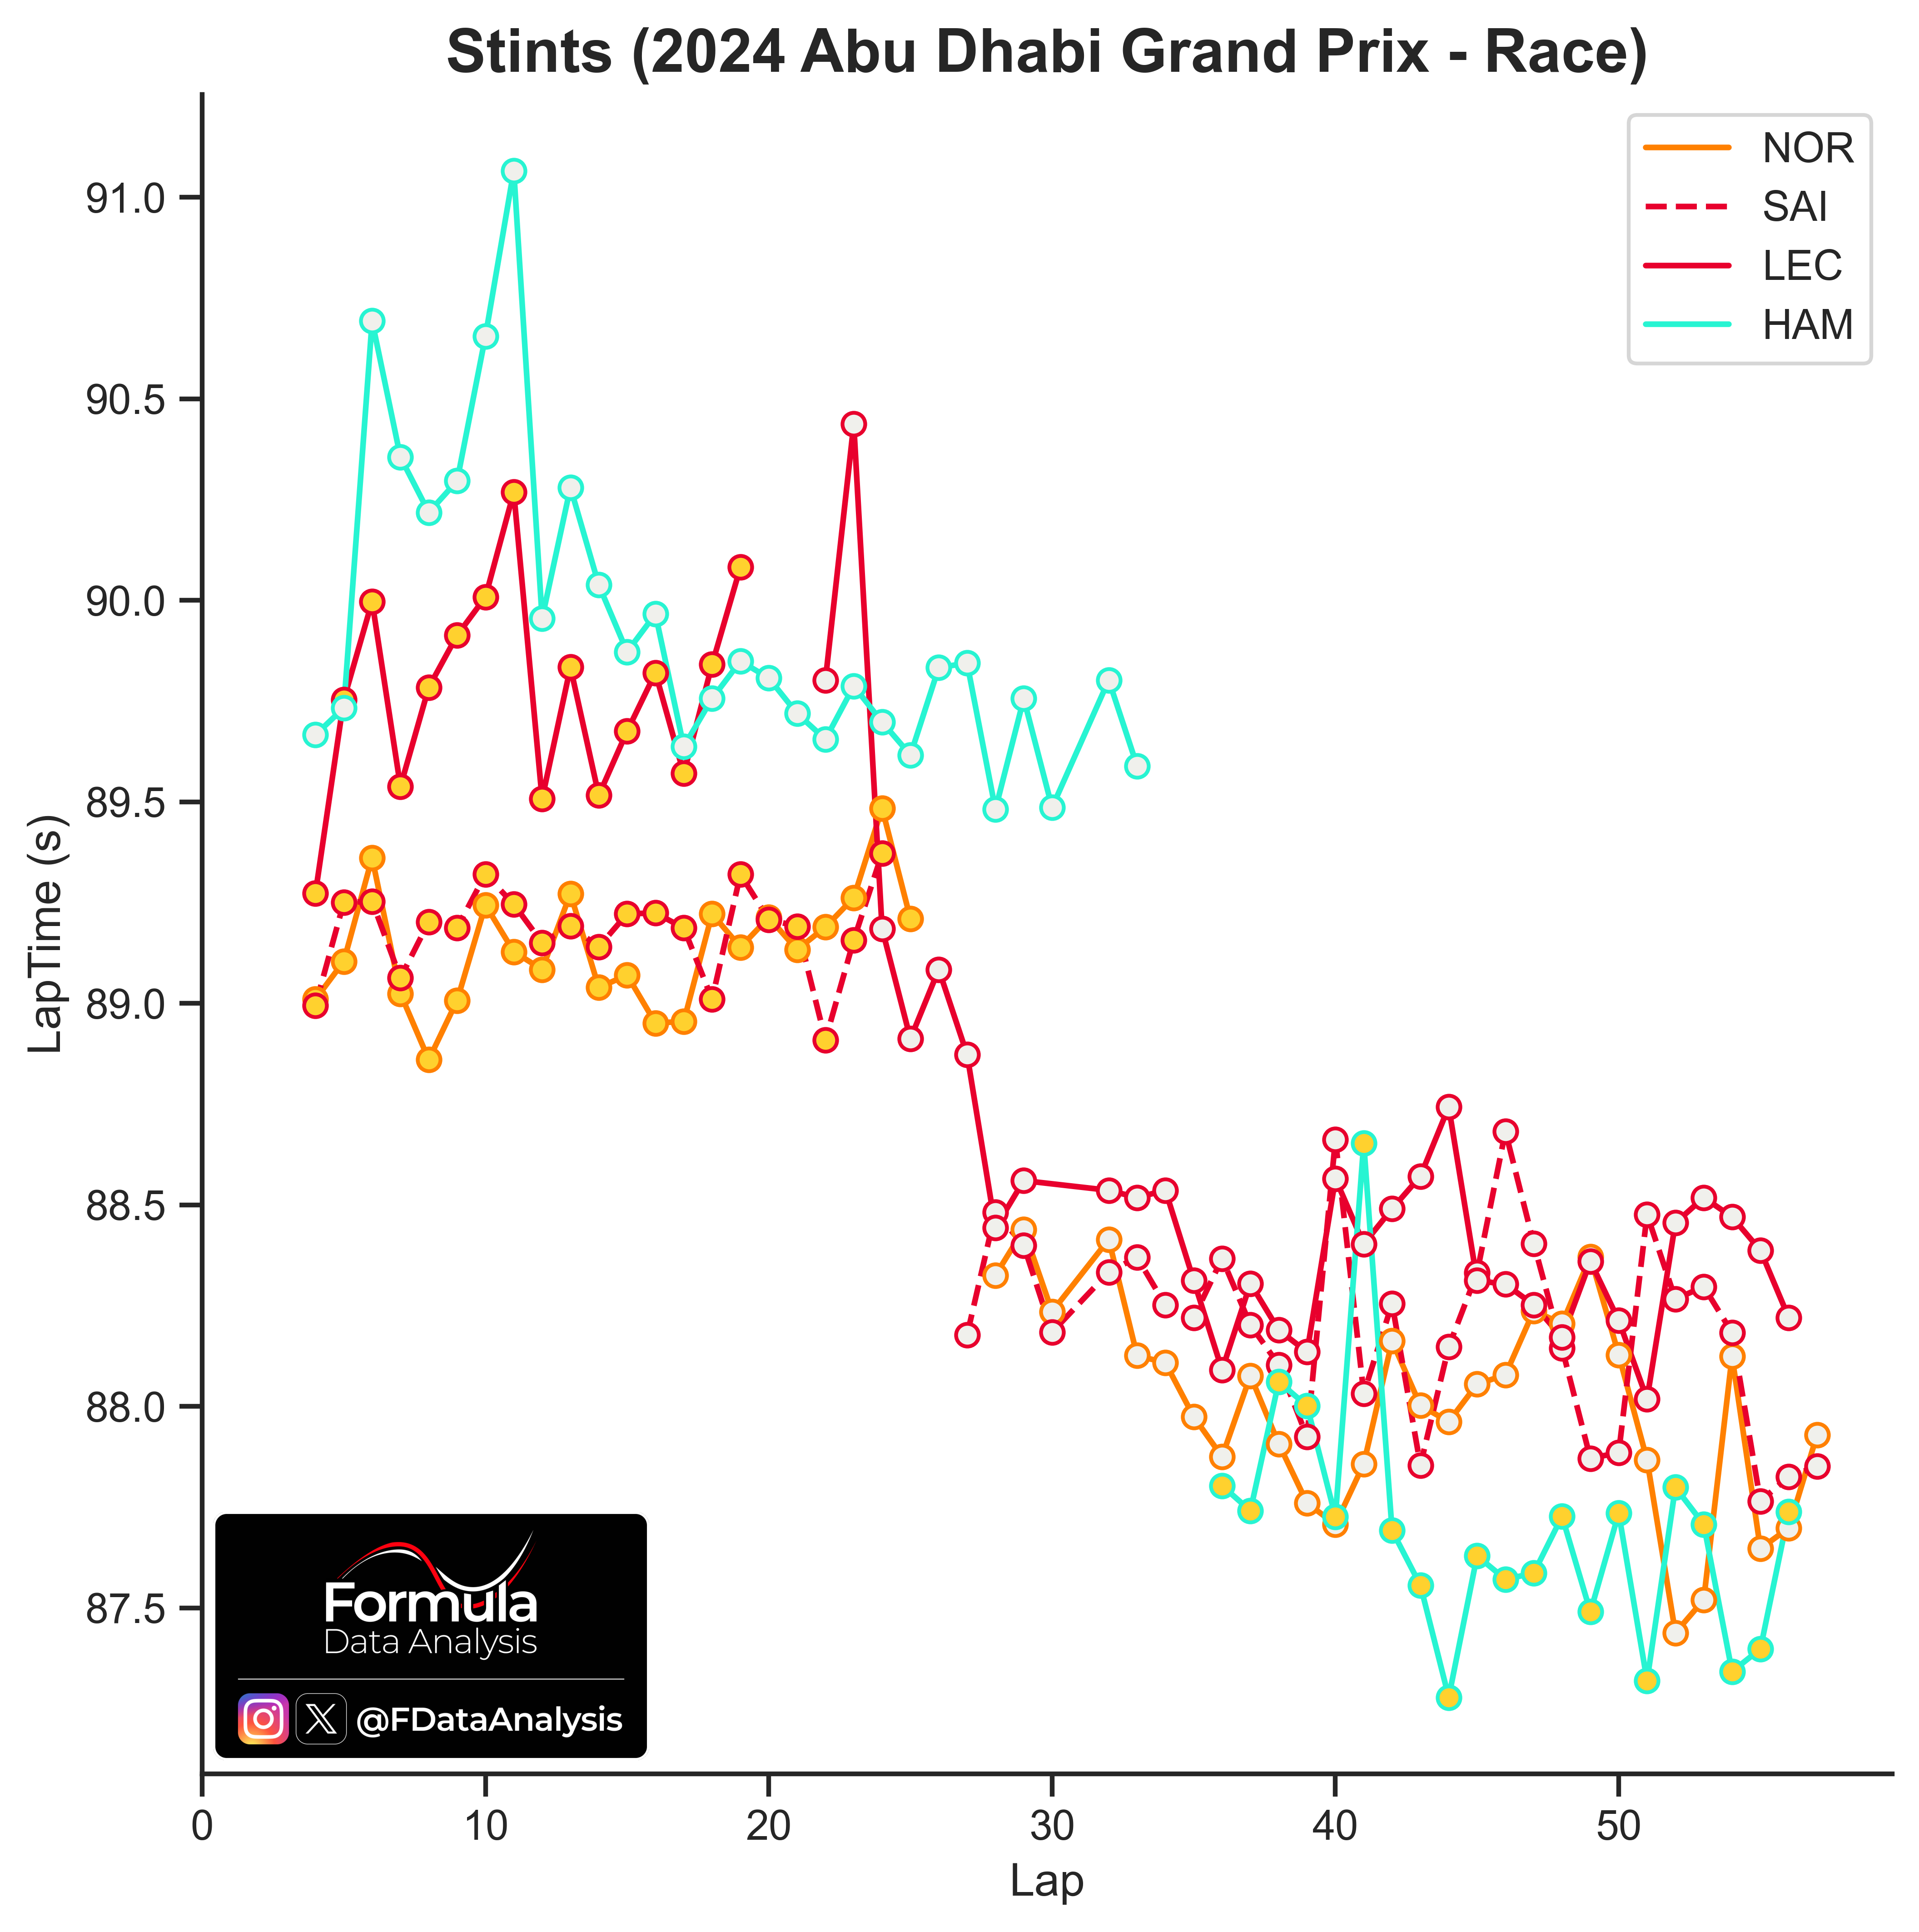
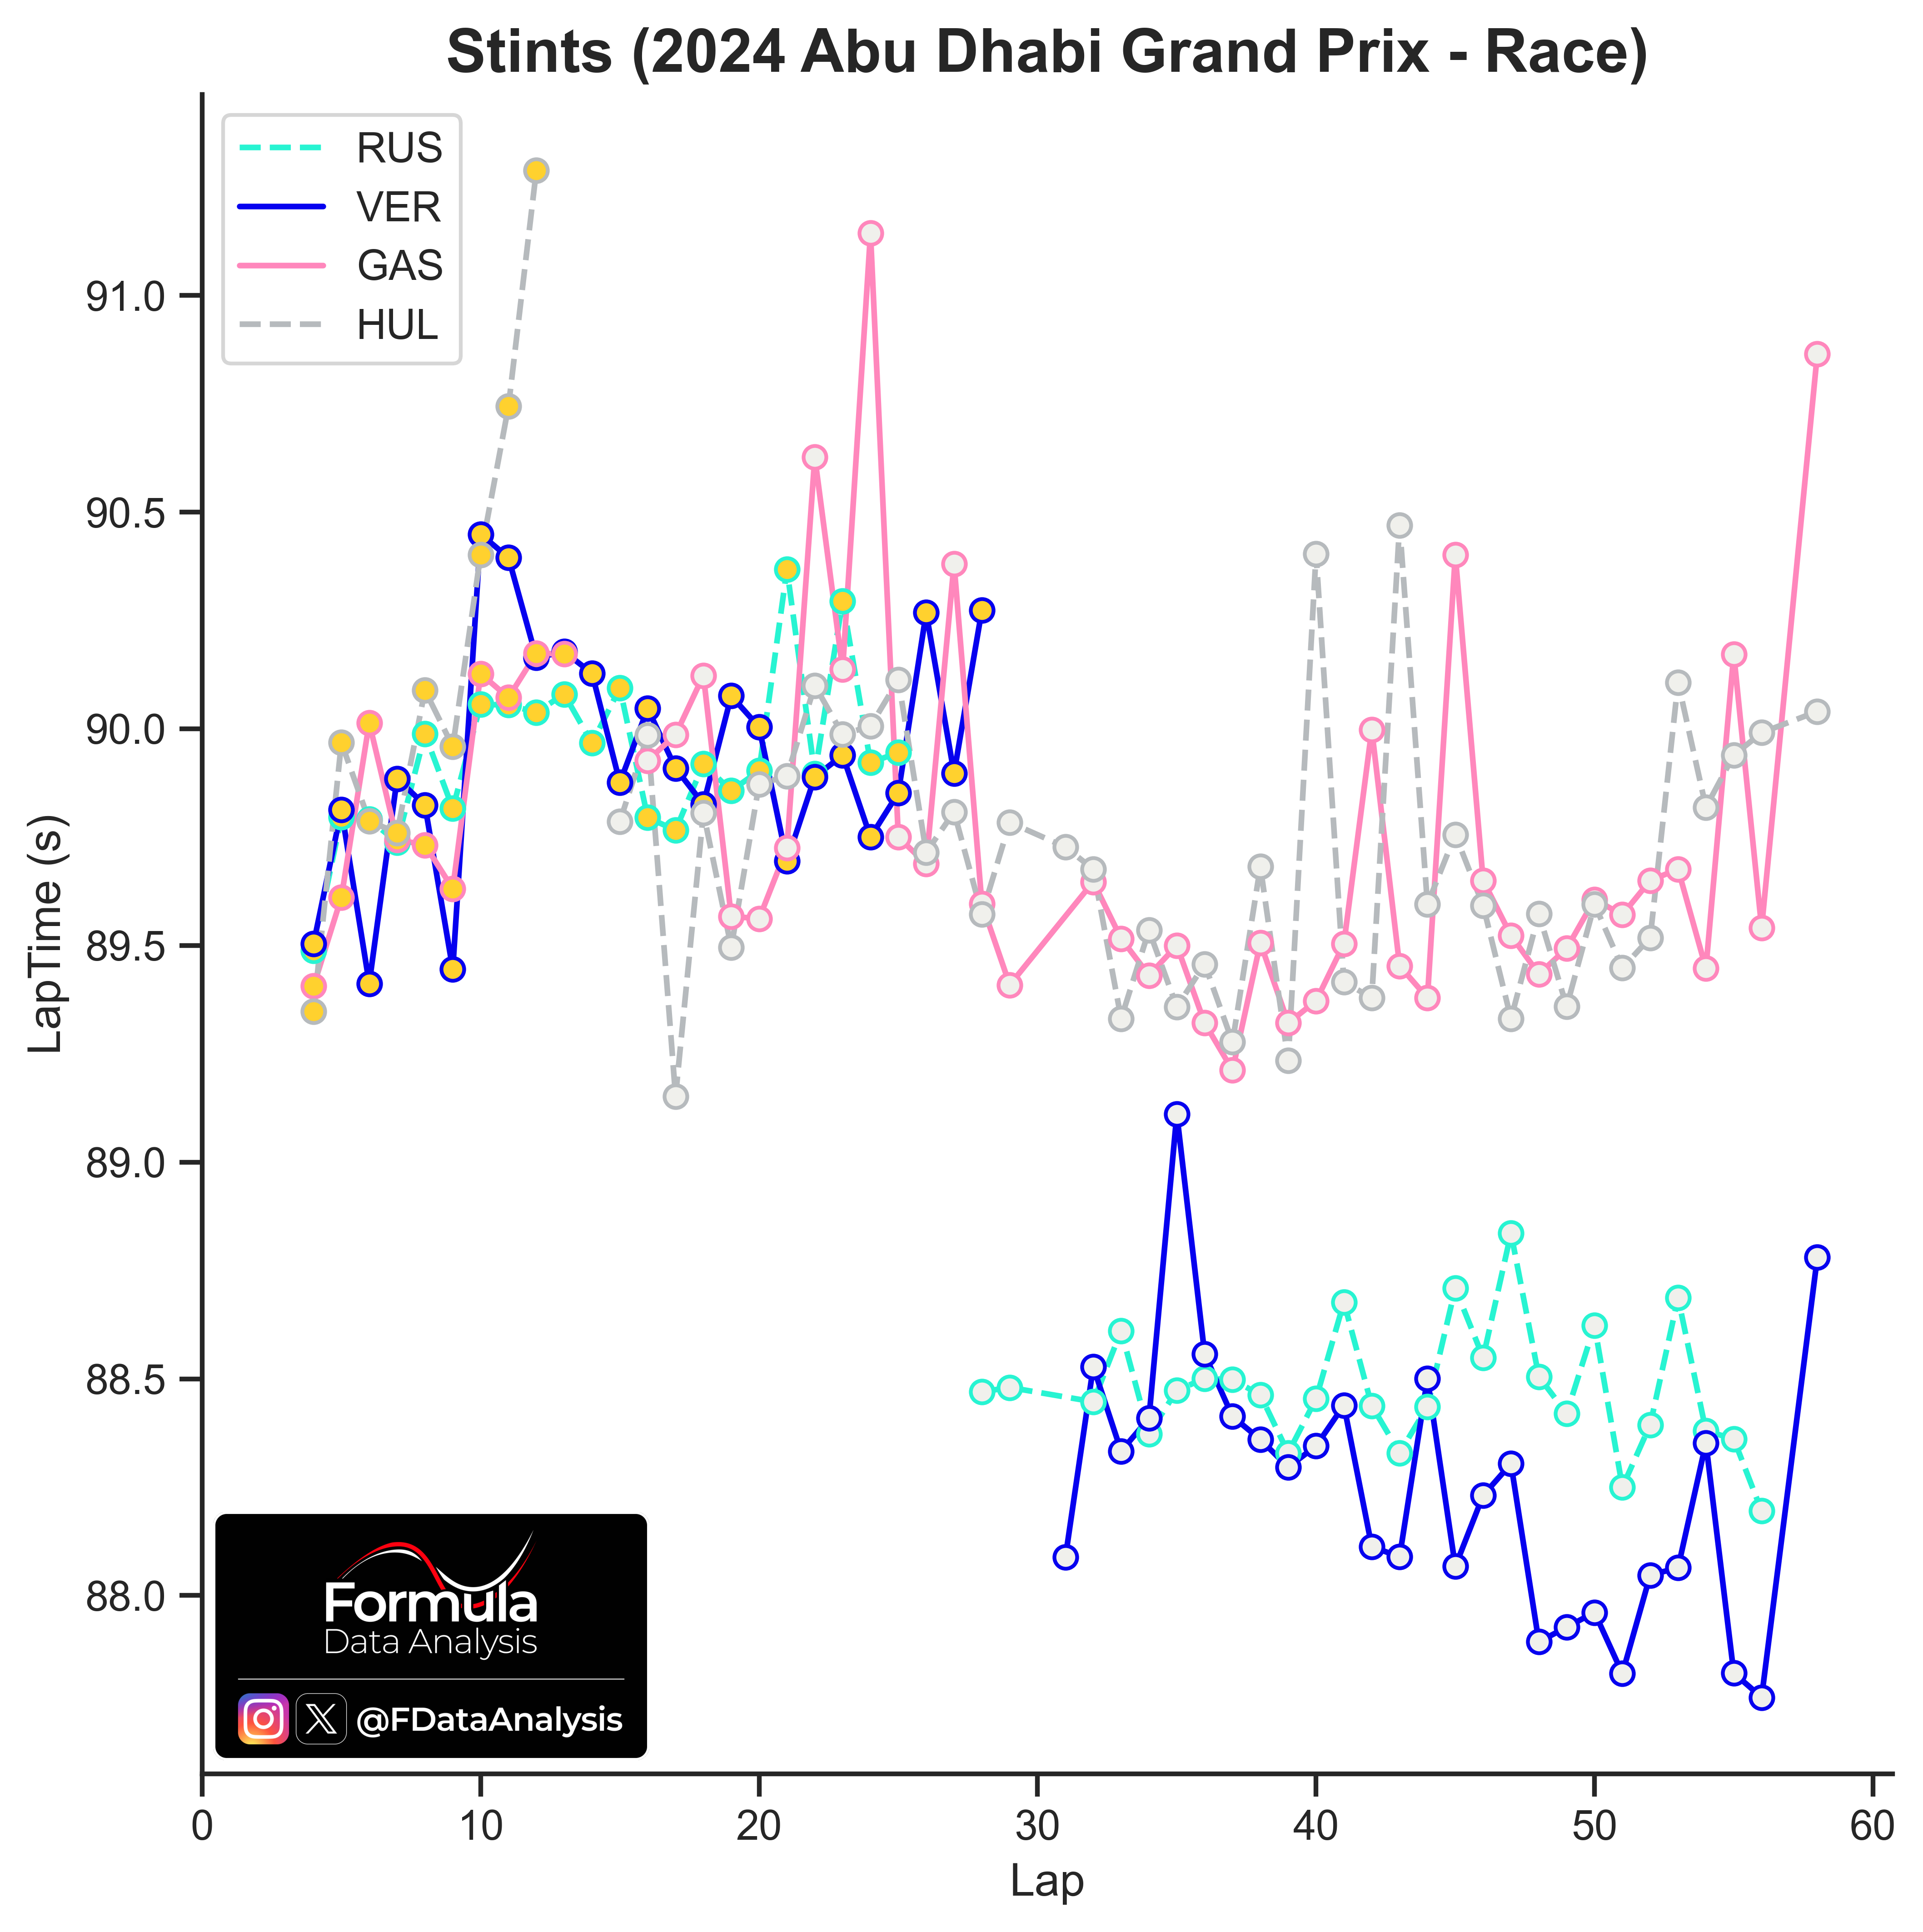
How to read: the graph shows the lap times progression for each driver, for each stint. The colour of the dots indicates the tyres used in that stint.
Finishing positions 1-4
SAI and NOR were almost matched in the first stint, but NOR was quicker in the second one. HAM's improvement once he put the Mediums on was phenomenal.
Finishing positions 5-8
GAS' pace was constant throughout the race: extremely competitive in the first part, but unimpressive in the second stint. VER and RUS had a significant jump in performance (especially the former) in the second stint.
Race start analysis
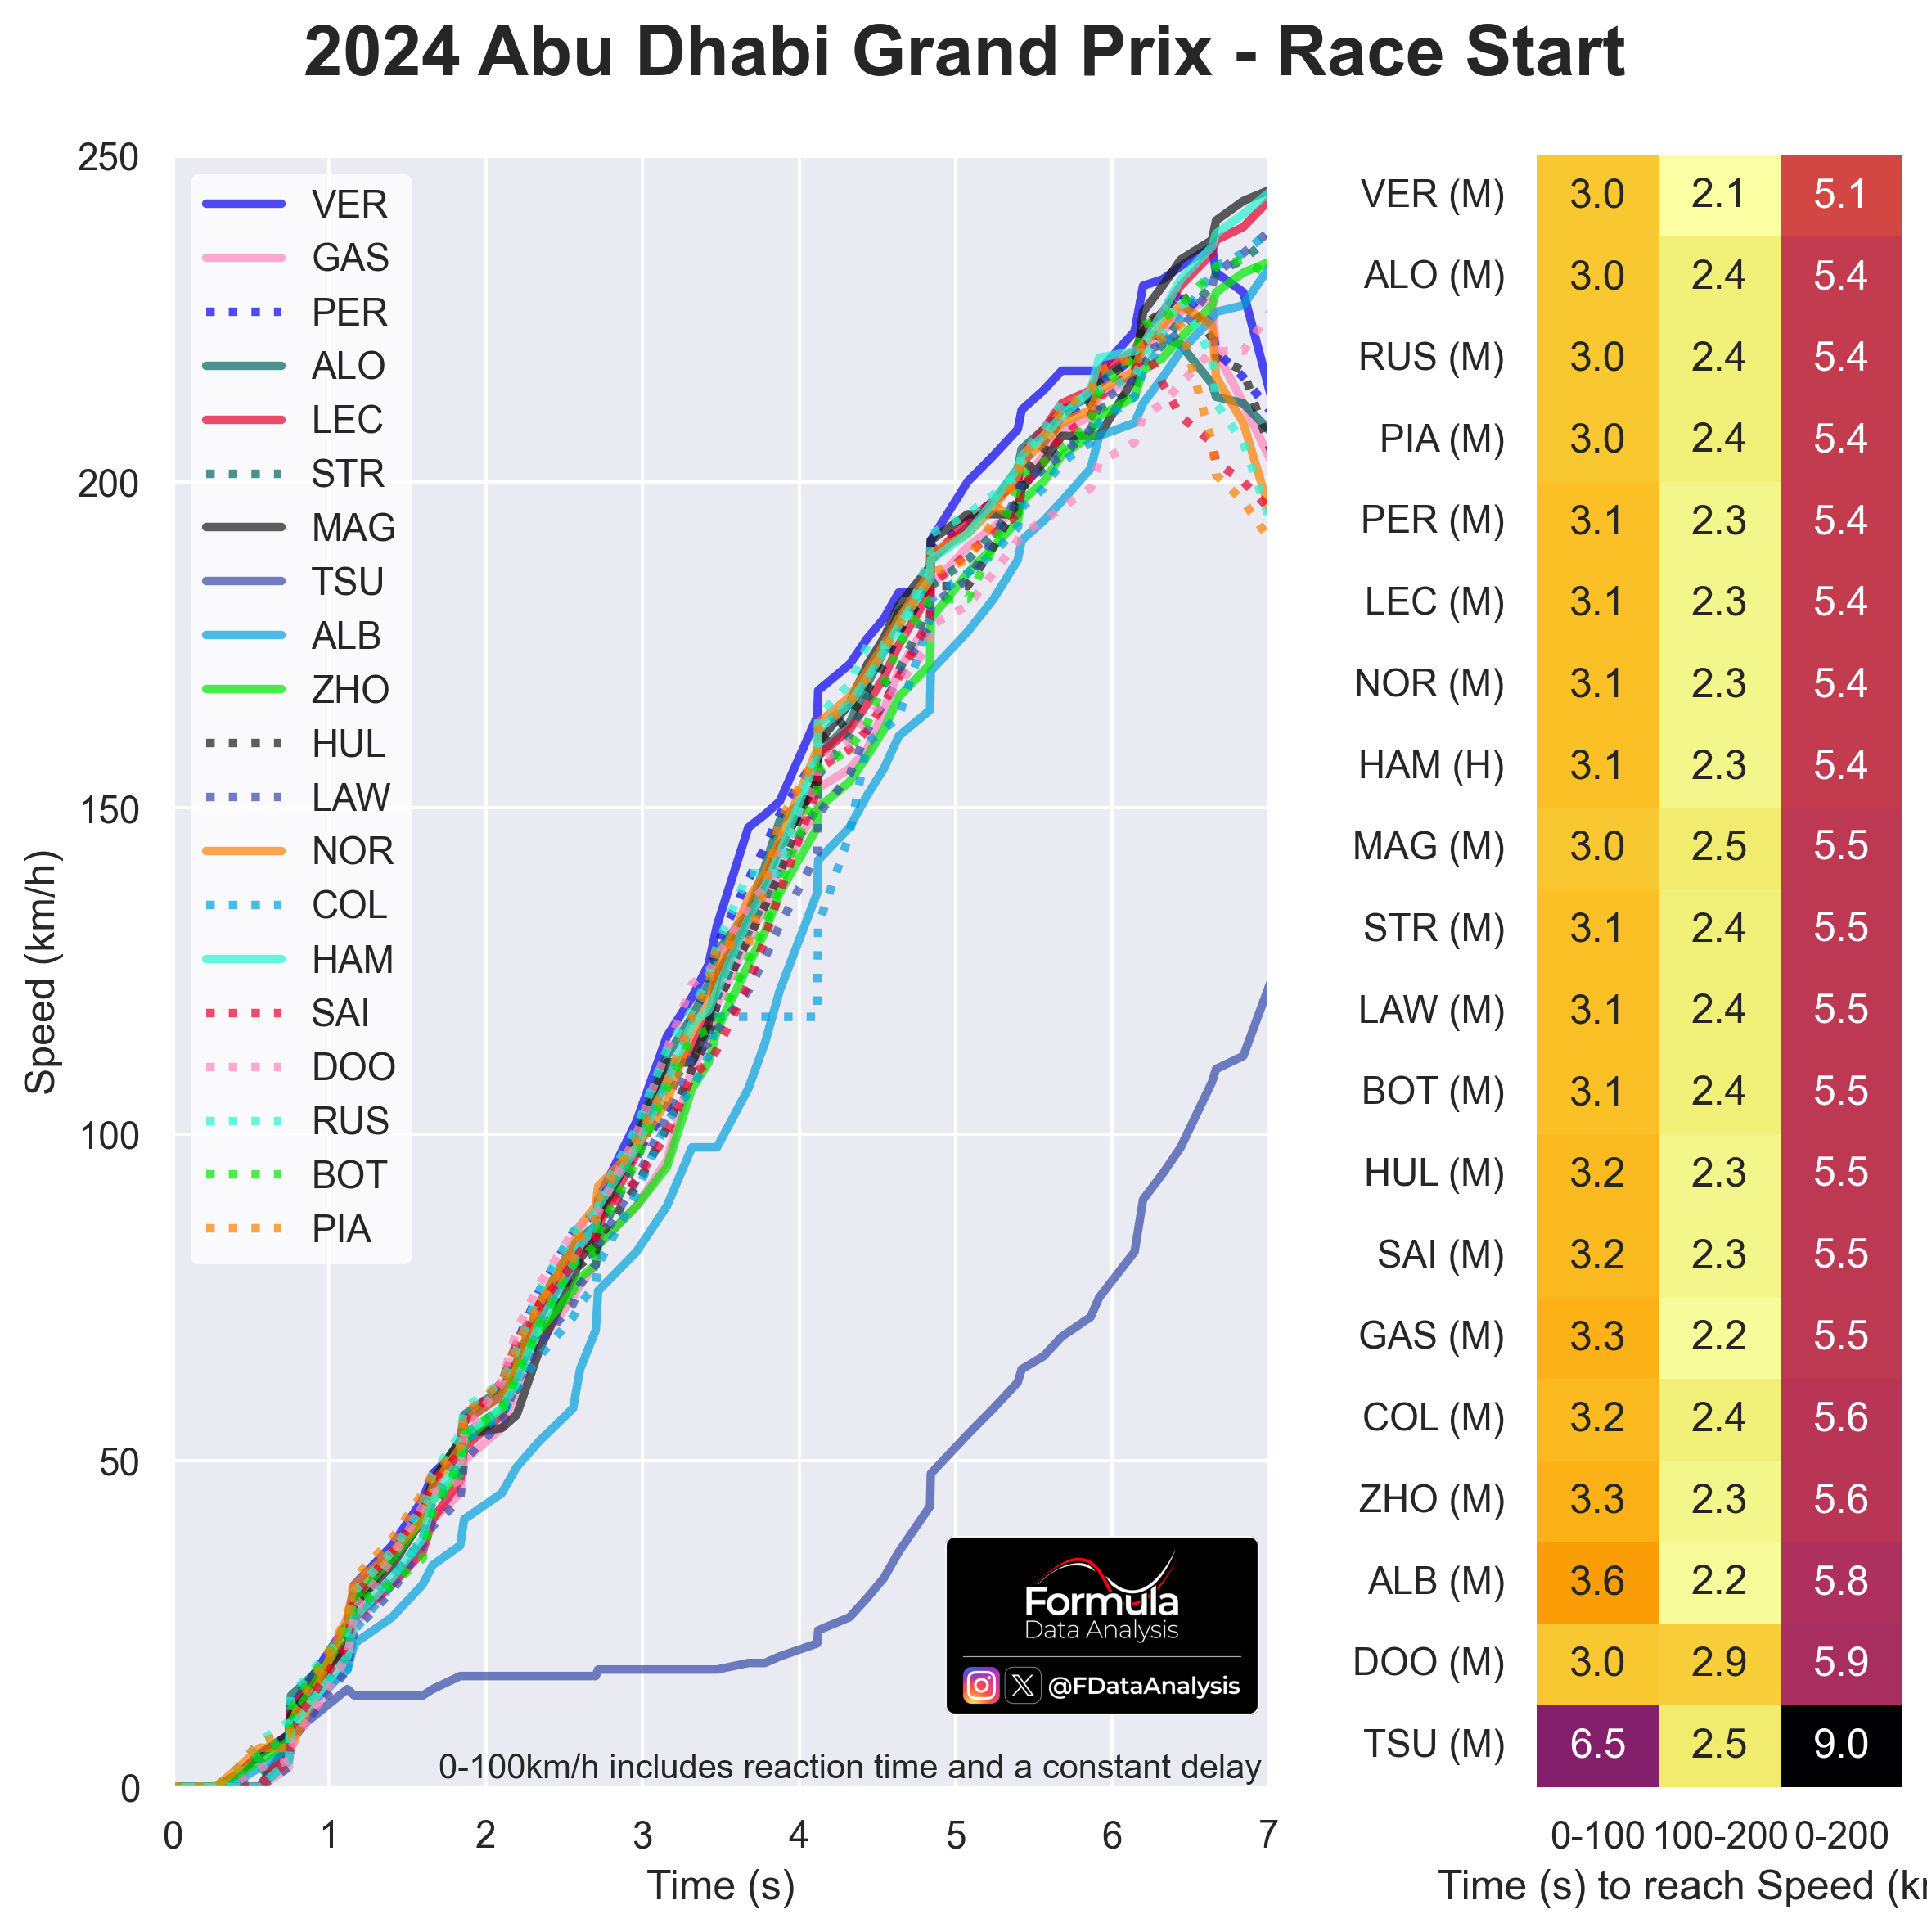
How to read: The table on the right shows the time needed to go from 0 to 100km/h (first column), to go from 100 to 200km/h (second column), and the total time to reach 200km/h (third column, sum of the previous 2). The 0-100km/h time included the reaction time but is higher than the value shown on TV as the lights go off slightly later than the start time considered. However, as this delay is the same for all drivers, it does not impact the comparison between drivers.
VER was quickest off the line, and by 0.3s! He quickly ruined his race afterwards, however. DOO's first F1 start wasn't bad, all things considered. TSU needed 6.5s to reach 100km/h! More than several cars that you see on the road every day :D
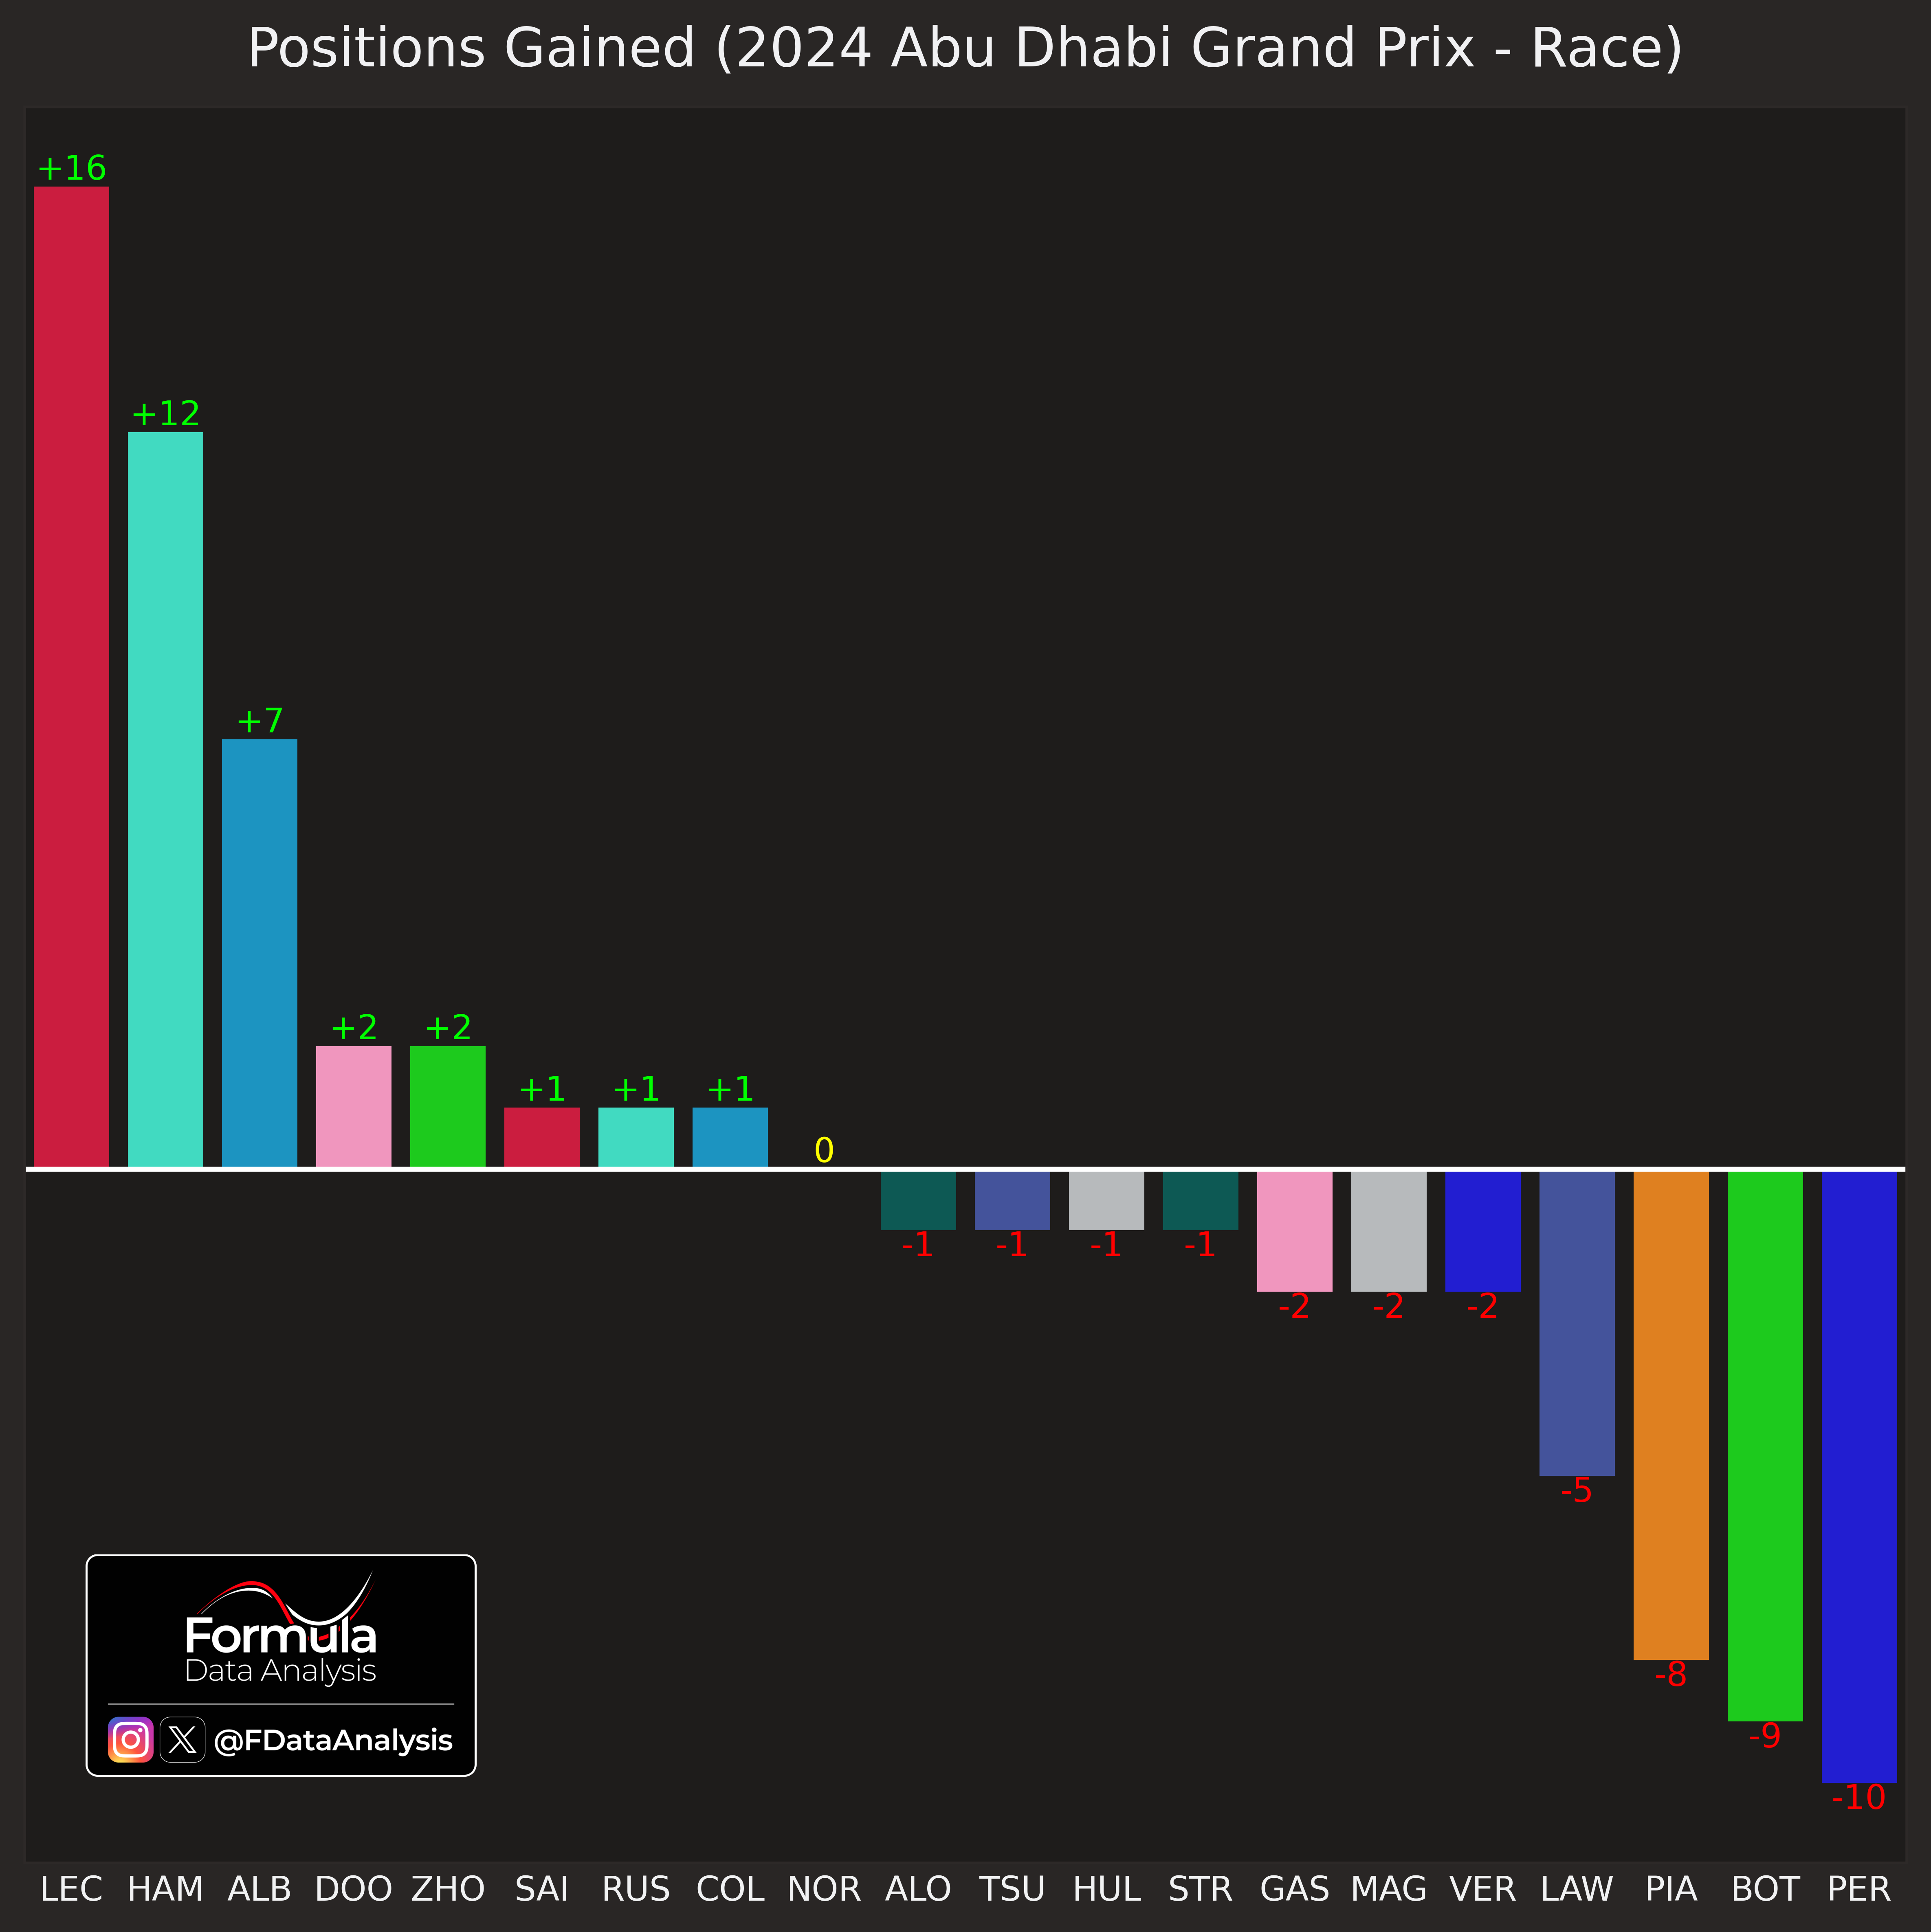
Positions change in the race.e
How to read: The graph shows how many positions each driver gained (+) or lost (-) at the chequered flag compared to their starting positions. Drivers are sorted left to right from those who gained the most places to those who lost the most.
The future Ferrari teammates gained the most places: 16 for LEC, and 12 for HAM. ALB, SAI's next teammate, gained 7. Disastrous race for LAW (-5), PIA (-8), BOT (-9), and PER (-10)
That’s a Wrap – but Many Other Cool Things Are Incoming!
This is the 3rd season that I analysed through my 'Formula Data Analysis' page: I've grown significantly throughout this period (I finished my PhD and started my dream job!) and the page has, too (I've been creating new types of analyses month after month, the follower base has steadily increased, and I now get a revenue from it which absolutely justifies the time I devote to it!).
This wouldn't have been possible without 3 elements: -My determination to keep pushing day after day, week after week even when I was extremely busy working abroad or on holiday -Your followers, who appreciated, shared, and gave constant feedback to my content allowing me to improve, -Those of you that decided to support my project, allowing me to devote more time to both the extra content and also that which is shared with everyone!
Thanks to all of you, and stay tuned for the off-season analyses!
See you soon :)
Mirco / Formula Data Analysis