

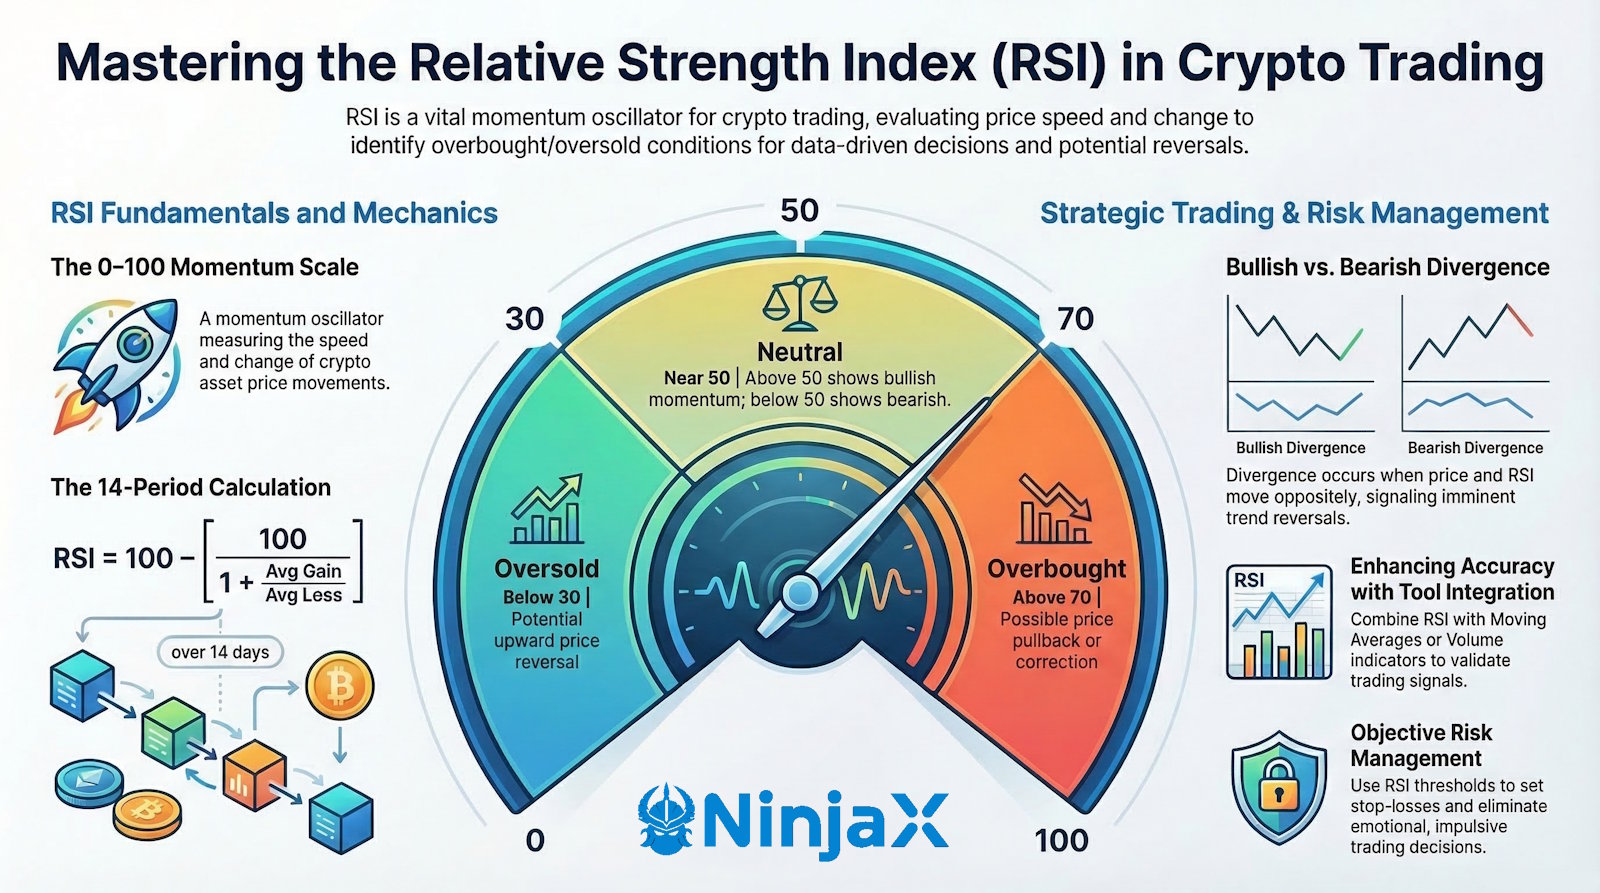
The trading experts at NinjaX highlight the Relative Strength Index as a premier tool for cryptocurrency traders. This powerful momentum oscillator measures the exact speed and magnitude of price changes across various digital assets. Traders use this zero-to-one-hundred scale to gauge prevailing market sentiment and pinpoint precise entry points.
When an asset experiences rapid price increases, the index climbs above the 70 mark, signaling an overbought condition. This specific reading alerts investors that a sudden price correction might occur very soon. Conversely, a plummeting price pushes the indicator below 30, indicating an oversold market and a potential buying opportunity.
By quantifying market momentum so clearly, the oscillator helps investors completely avoid emotional decision-making. Instead of relying on gut feelings during wild market swings, traders execute rational and data driven strategies. This objective approach protects investment capital from the chaotic impulses that normally ruin amateur portfolios.
Astute market analysts actively hunt for divergence patterns to predict massive trend reversals before they happen. A bullish divergence forms when a cryptocurrency hits a new price low while the momentum line simultaneously creates a higher low. This structural mismatch proves that the aggressive selling pressure is finally losing its strength.
On the flip side, traders watch carefully for bearish divergences to secure their profits. This pattern emerges when the asset reaches thrilling new price highs, but the index forms distinctly lower highs. Recognizing this hidden weakness empowers investors to exit their positions right before the market crashes.
Professional traders never rely on a single technical indicator to navigate complex cryptocurrency markets. They pair the index with tools such as the Moving Average Convergence/Divergence to assess bullish or bearish momentum. They also apply Bollinger Bands to analyze market volatility and strictly filter out deceptive false signals.
Successful trading requires strict localization of momentum parameters to match the unique volatility of specific digital coins. Because different digital assets behave differently, traders must customize their settings aggressively rather than relying on the standard 14-day calculation.
An investor analyzing a major asset like Bitcoin might apply a longer twenty-one-day timeframe to smooth out distracting daily noise. Meanwhile, a trader analyzing highly volatile alternative coins like Dogecoin or Shiba Inu will deploy a rapid seven-day setting. This precise localization guarantees that the indicator captures the exact heartbeat of each cryptocurrency.
Finally, investors integrate these precise momentum readings directly into their strict risk management protocols. They adjust their trade sizes and tighten their stop loss orders the moment the index flashes a warning signal. This comprehensive methodology protects their hard-earned profits and ensures long-term survival in the unpredictable crypto ecosystem.