

Many Python users love analyzing data with Pandas since it has simple syntax and is easy to learn. But for bigger data tables, it can be slow.
Polars, another library, is much faster and makes it easy to do stuff in parallel (at the same time). This quick guide aims to help people make the switch from Pandas, focusing on examples that you can tweak for your own use! If you like it, feel free to buy me a cup of coffee!
PS - shoutout to some amazing folks on Twitter that helped me learn this language! A special thanks to @xoreax_eaxeax, @FuzzyLogicBrock, @TapanHazarika13, and @yieldcurvepro
Part 0a - installing stuff we need
We'll be working in a Google Colab notebook, posted here. You can make a notebook for free if you have a google account. You'll want to make sure the notebook is a .ipynb file.
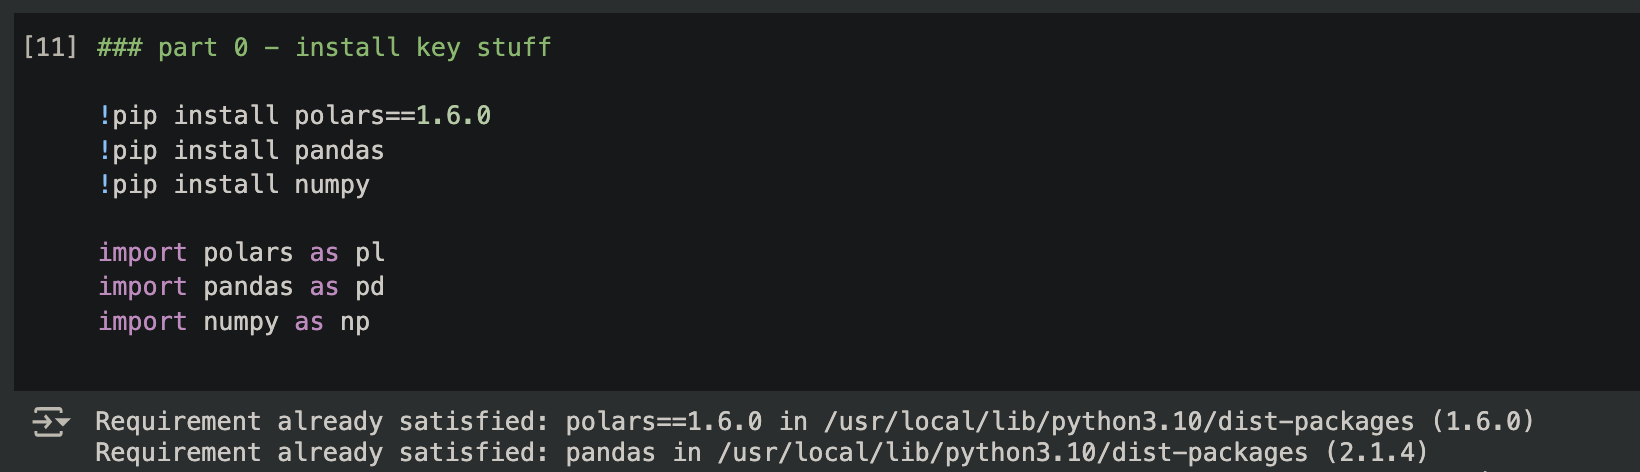
Here are the lines we can use to install and import stuff we need. We can work with Polars version 1.6.0.
Part 0b - set up a DataFrame of random numbers (prelim step)
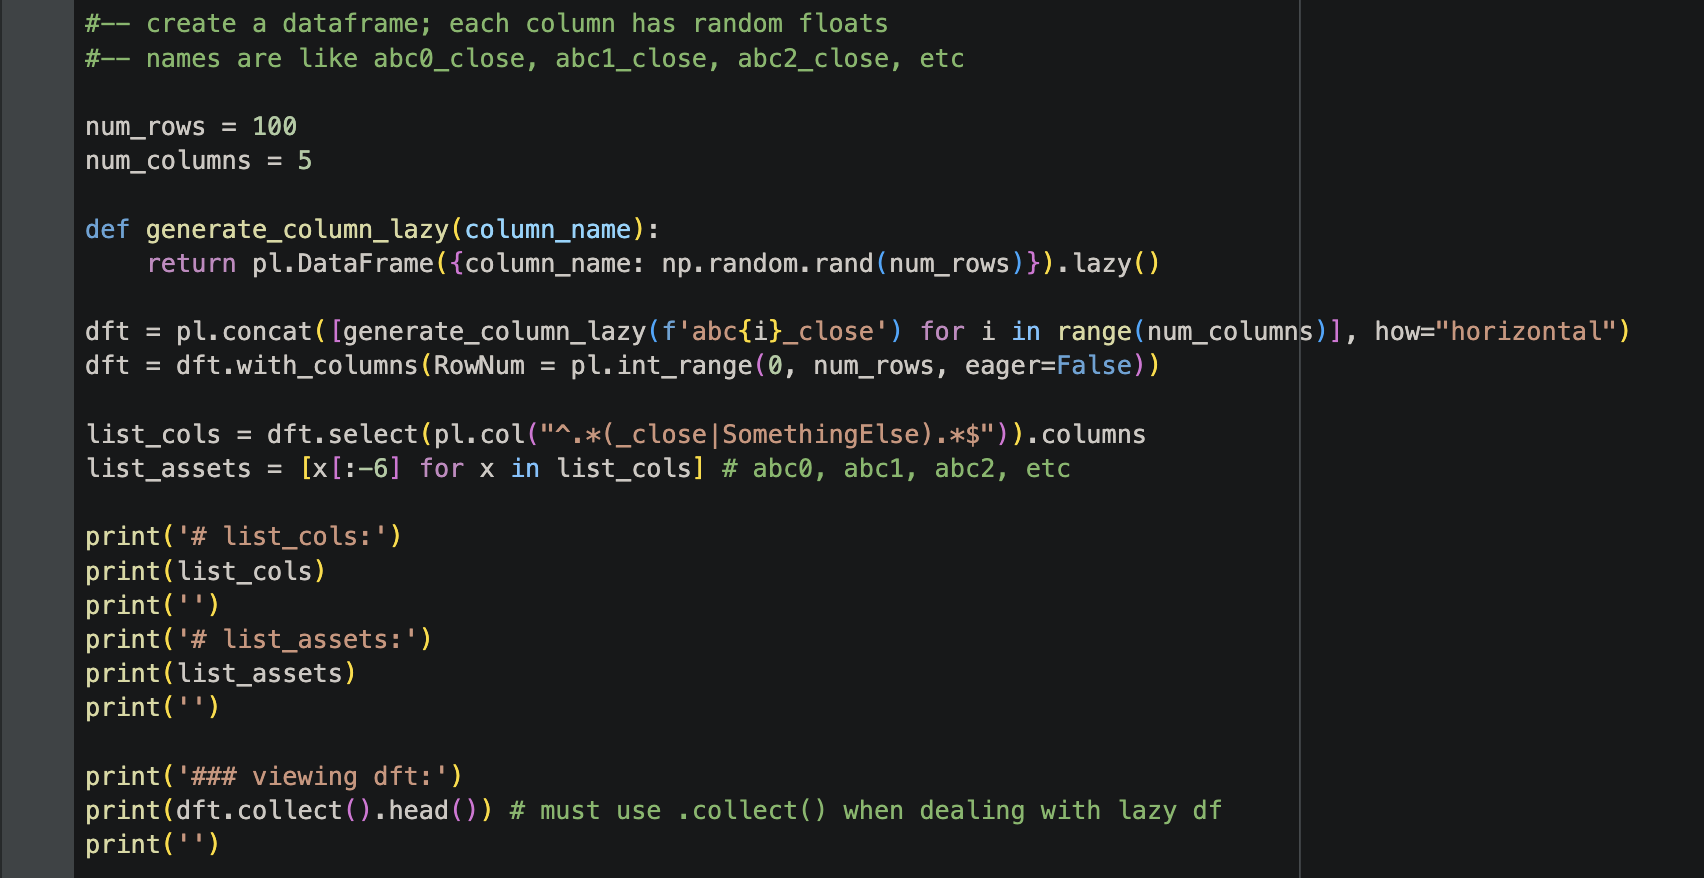
To get started, we will make a Polars DataFrame with some random numbers that we'll use for testing. It's called dft.
Don't worry about the code we use to make dft - it's just for setting us up.
We are creating a "lazy DataFrame"; the "lazy" version of a Polars DataFrame can be faster to work with than the non-lazy version, so we'll focus on lazy ones. Lazy DataFrames have a quirk; if you want to view one, you need to use " collect() ".
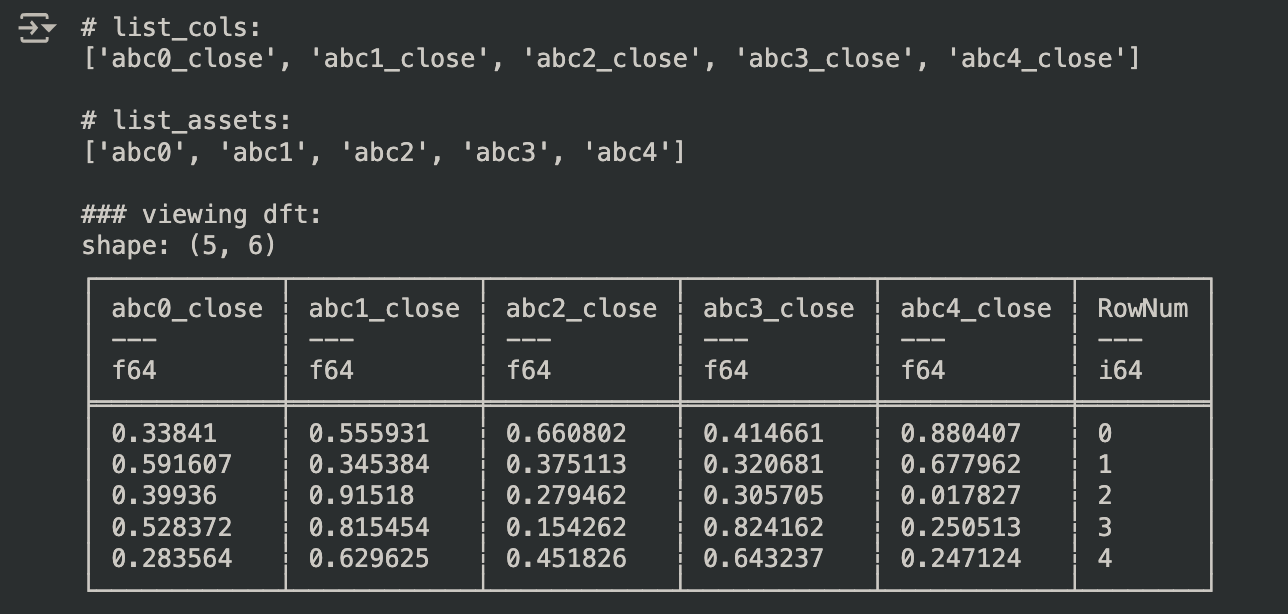
Our DataFrame has columns that are named "abc0_close", "abc1_close", etc. These columns could be something that changes over time, like a stock price. Here's the code to make it. It also has a column called RowNum, that keeps track of what row number we are on.
Let's look at dft.
Part 1 - make a function and apply it to many columns at once
Now, the learning begins. We'll look at simple examples to show you how to use Polars. If you want detailed discussion of how everything works, check out the official user guide or the docs.
Let's make a function that calculates the rolling average of a column like abc0_close.
We need to tell this function what DataFrame to consider, what asset to consider (abc0, abc1, etc), and what window of time to consider when looking back and calculating the average. Here's what it looks like.
We specify the name of the function using "alias". The names will look like abc0_SMA, etc.
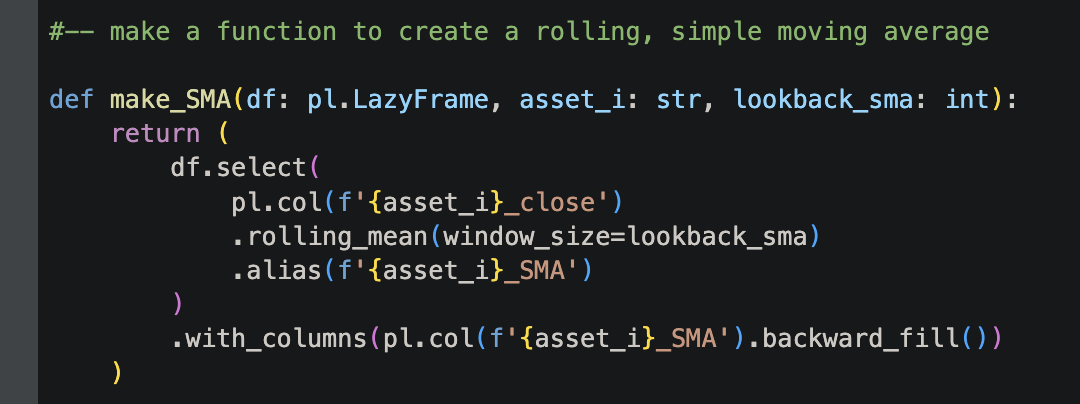
The parameter asset_i is the name of our fake stock. If we give the function the name abc0, it will consider the abc0_close column and find the rolling average.
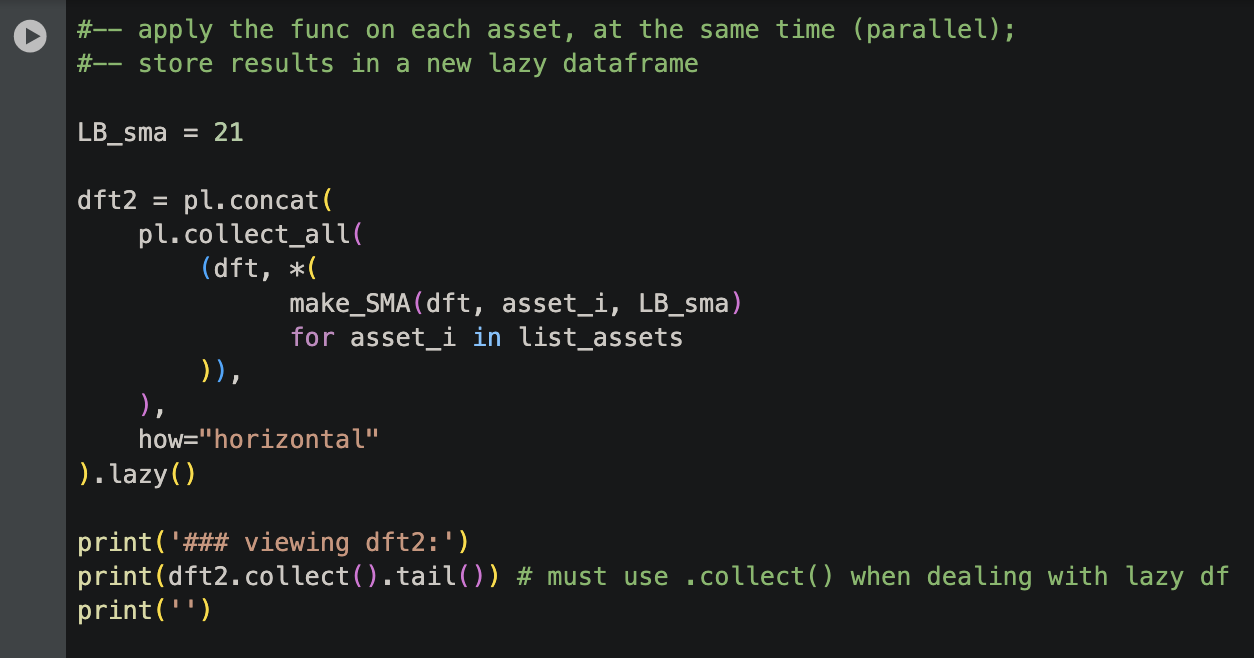
Now, let's supply the stock names as a list, and work on them in parallel. We'll use a lookback window of 21 rows to compute the rolling average.
Overall, this is how we do it. You can use this as a general approach for applying other functions you make in parallel.
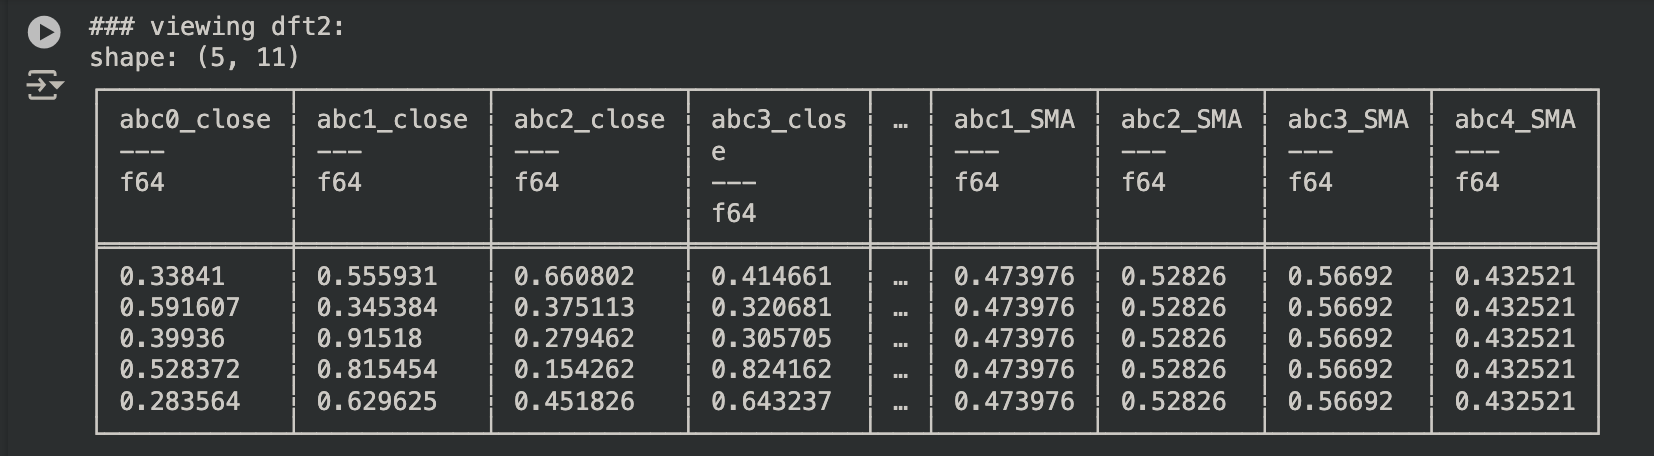
Let's see the results.
Part 2 - same as before, but with two functions
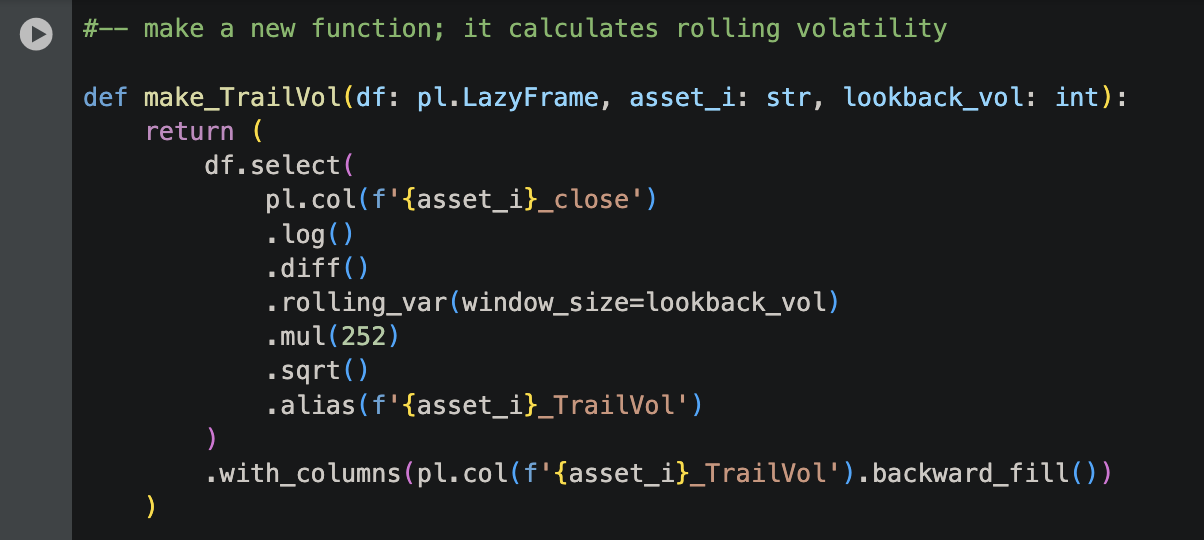
Next, we will make a new function, make_TrailVol.
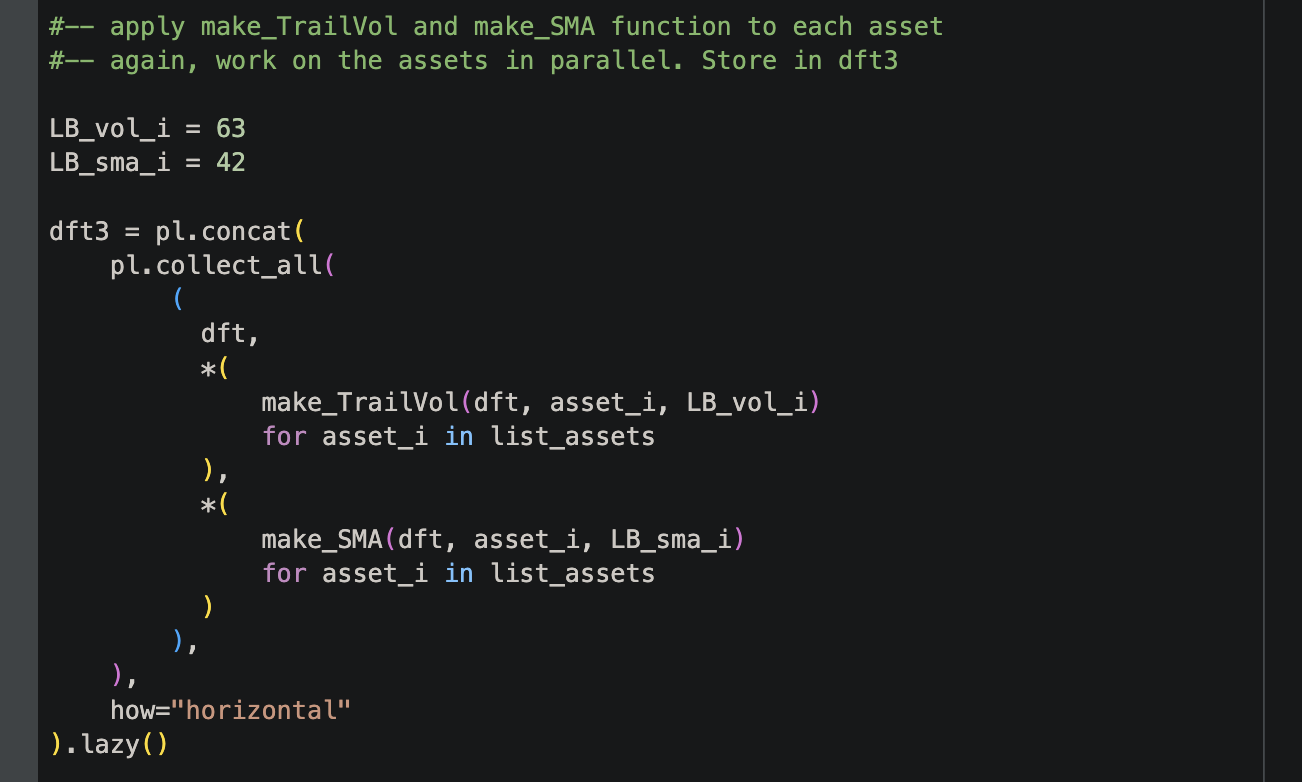
We will apply this function, as well as the one from before, on each asset, and we will work on all the assets at the same time (in parallel).
The code looks similar to what we did before, but notice that we mention our new function as well.
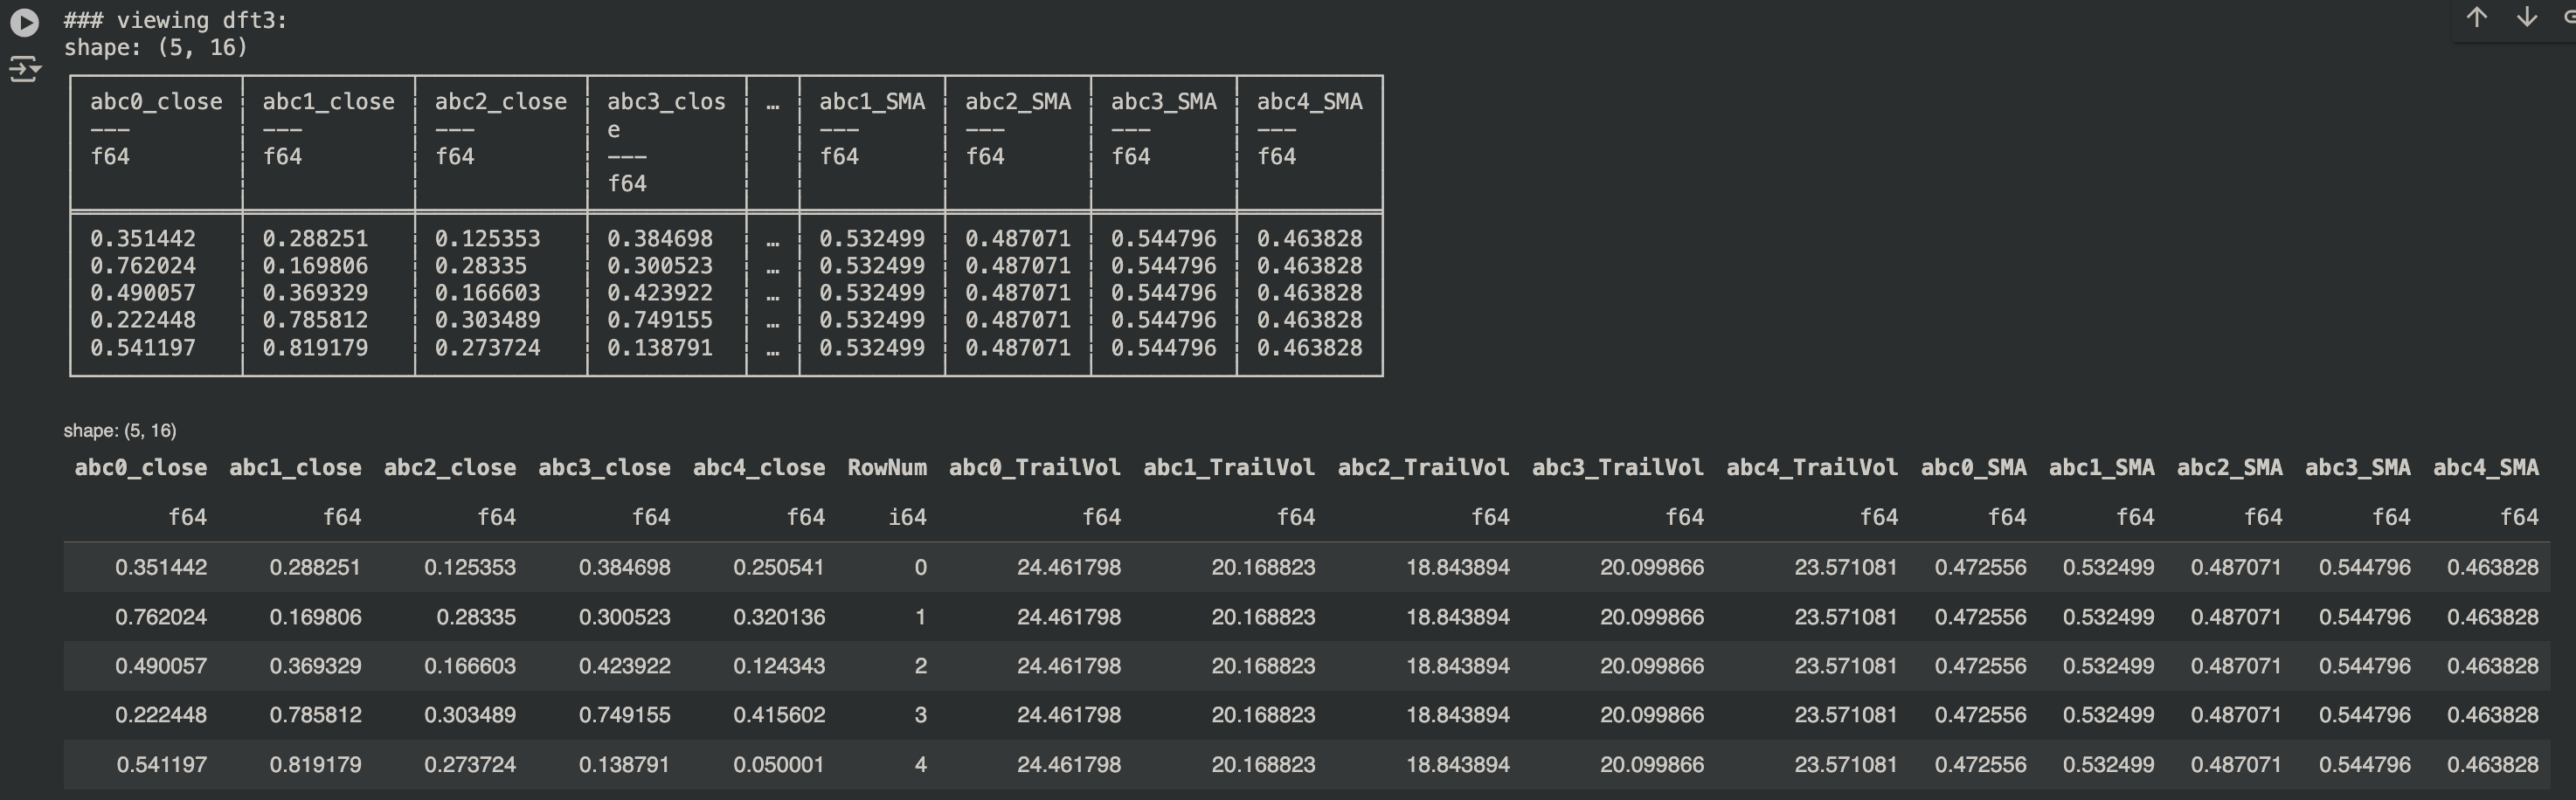
Let's view the results. It worked!
Part 3 - same as part 1, but use a function with an inner function
What if we want to apply a function, which uses another function, in parallel? We just modify the example from part 1.
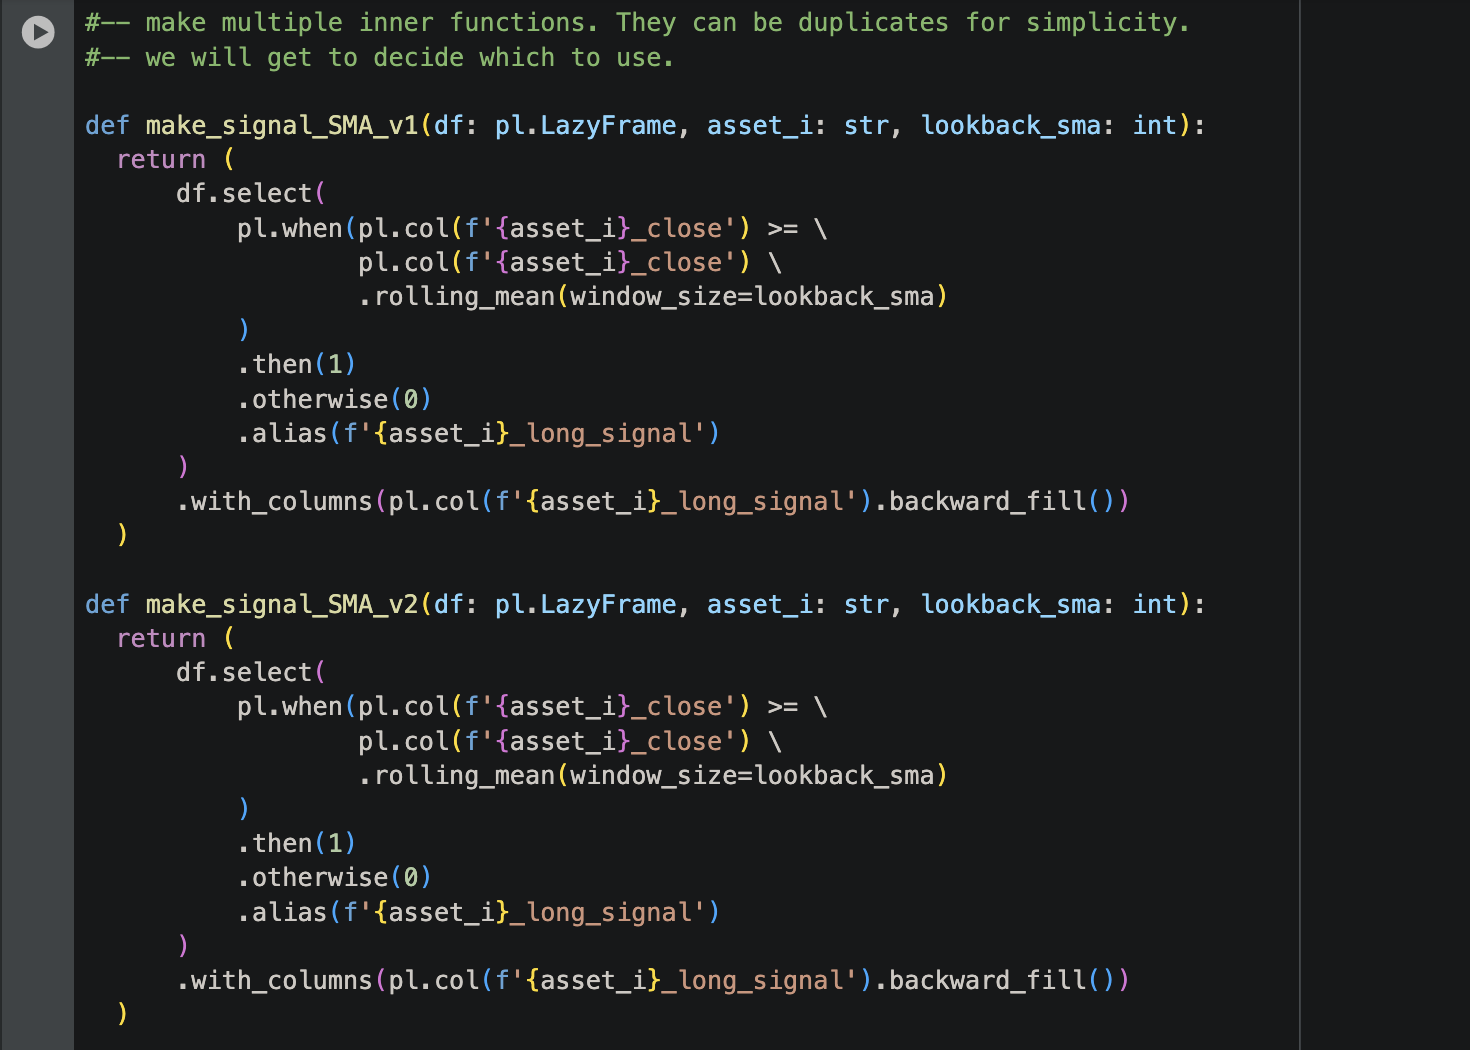
First, let us make the inner functions. These produce a column that is either equal to 1, or 0, based on a condition. The condition compares abc0_close to its rolling average (if we are working with abc0). We use pl.when().then().otherwise() to apply the if-then condition.
These functions are identical, just to keep things simple, but of course you can make the second one different. However, if you want them to be interchangeable, they should have similar input parameters, and the column that they make should have the same name (which we use "alias" to specify).
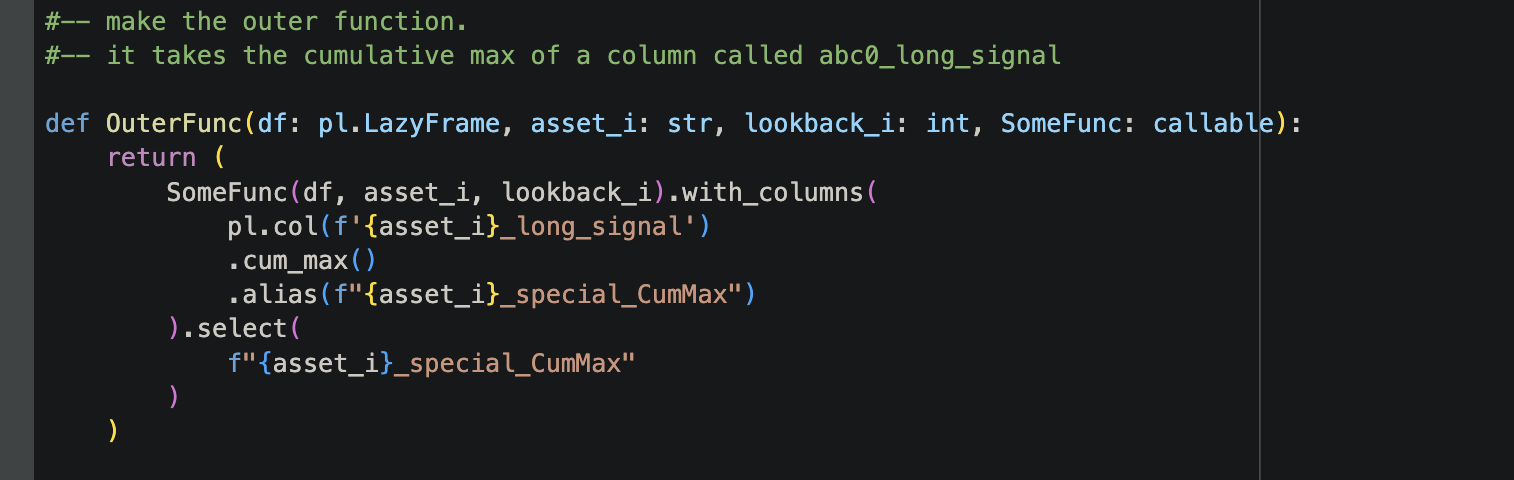
We also need to make the outer function that will use them in. This function finds the cumulative maximum value of the long signal column. Notice it has an input, SomeFunc, which is a callable. We use this parameter to specify the inner function.
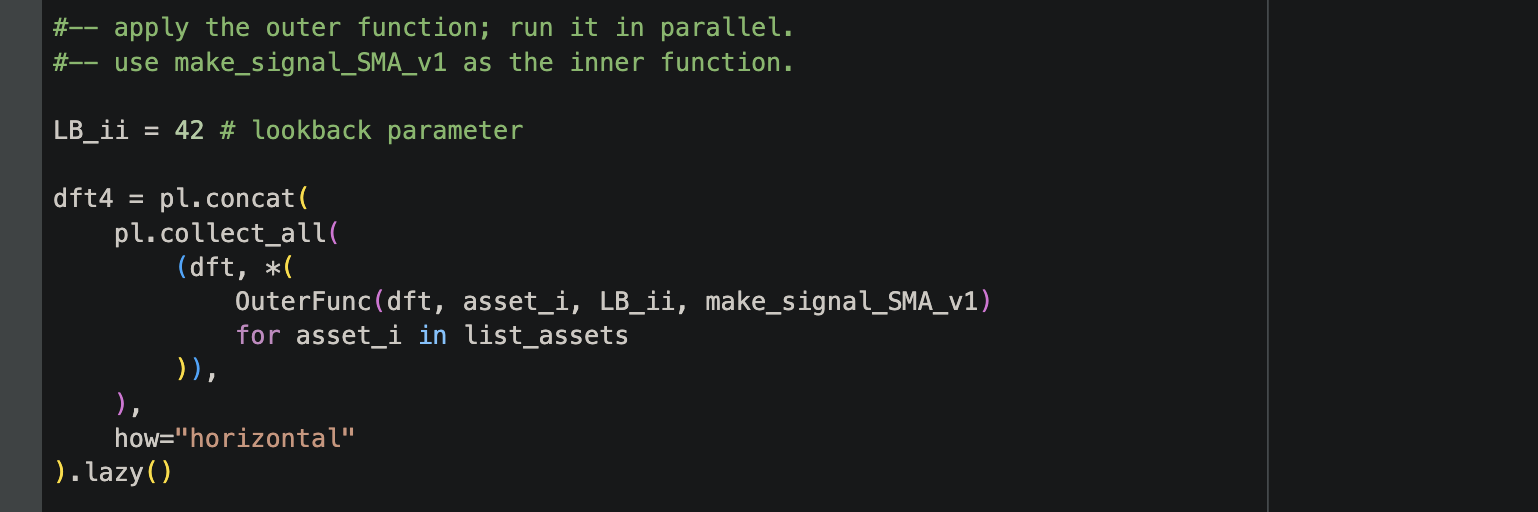
Ok, now let's apply this outer function to our assets, in parallel. We will specify that our inner function will be the first one we made (v1).
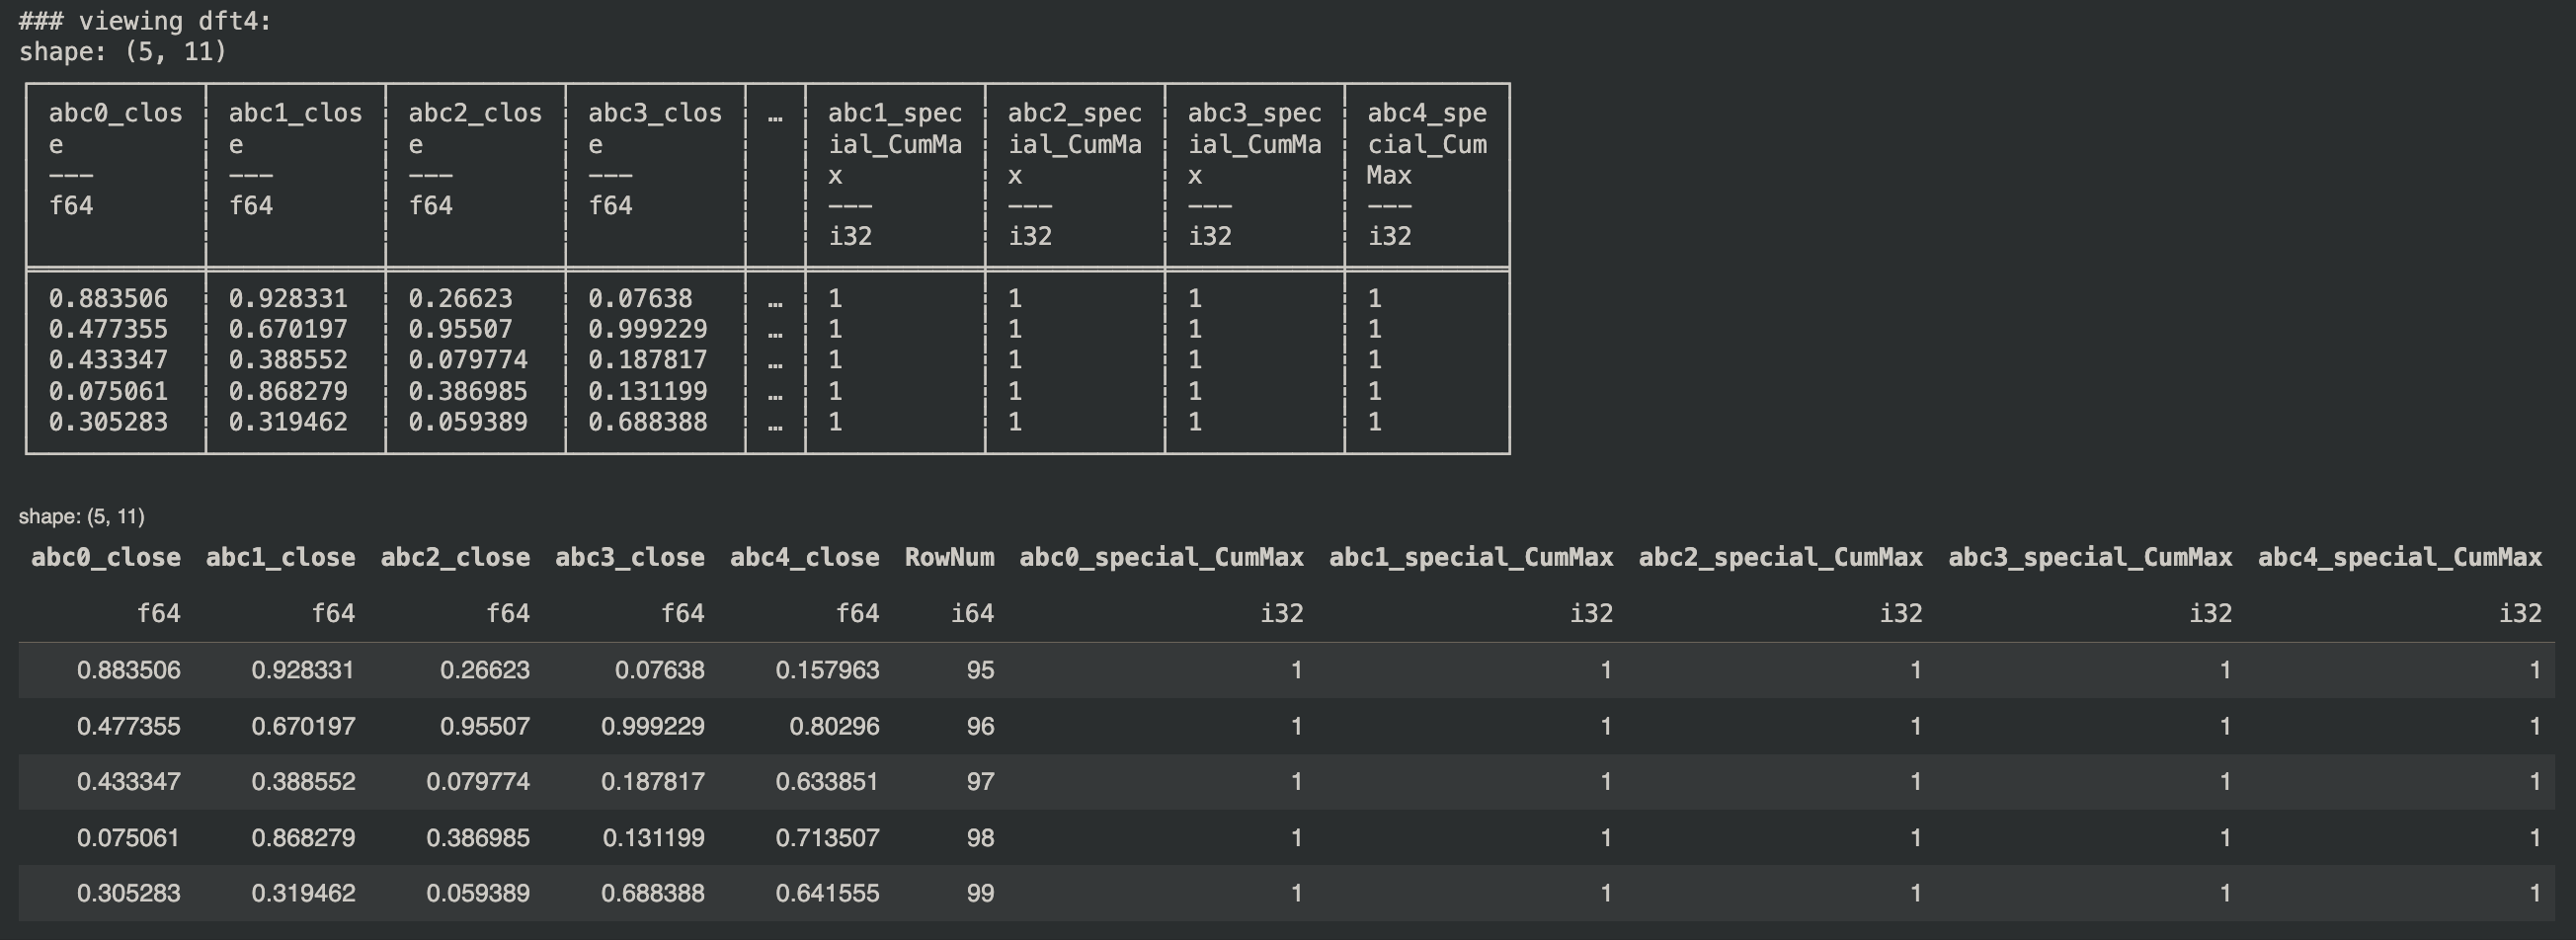
Let's see the results.
Part 4 - group by operations & datetime stuff
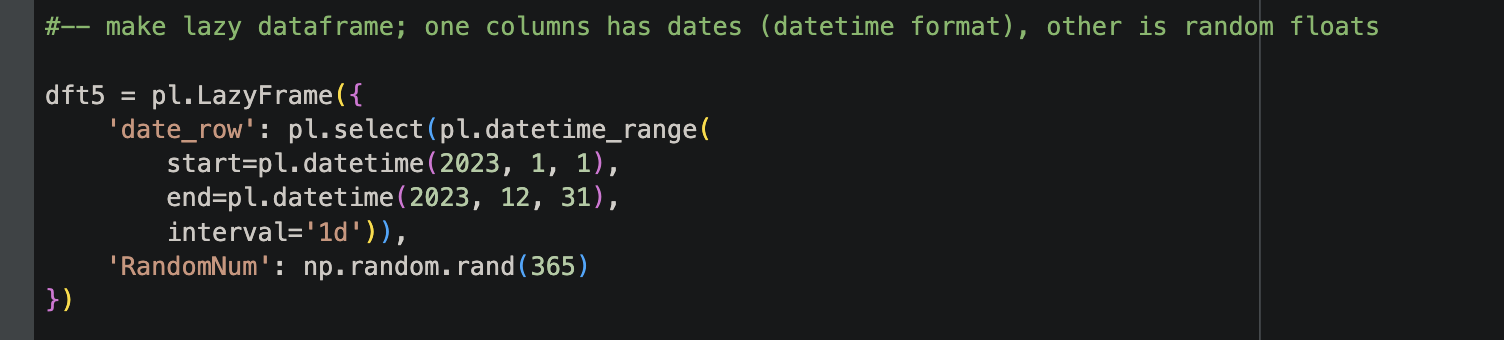
Let's start by making another DataFrame to work with. It will be "lazy" and have two columns. One column has a bunch of dates in the datetime format. Each one is 1 day apart. The other column has random numbers (random floats).
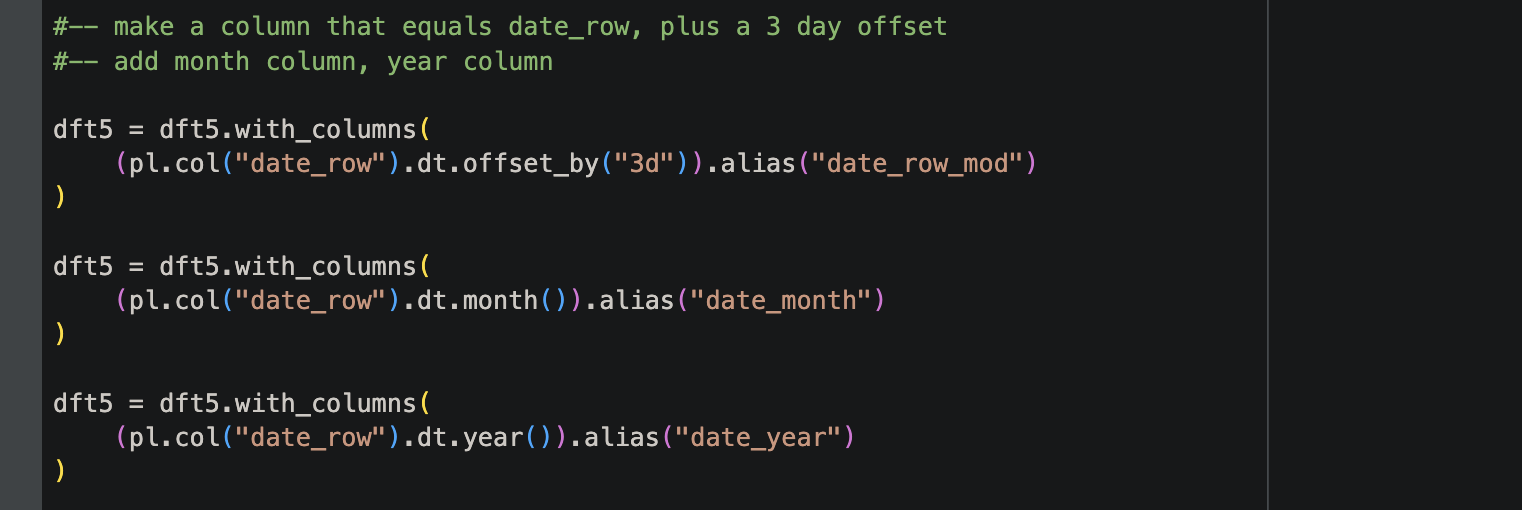
Now, let's add some new columns. The first one we make is a modified version of our column of dates. We add 3 days to each date. We also make a column that stores the month of the date, and one that stores the year of the date. The code looks like this.
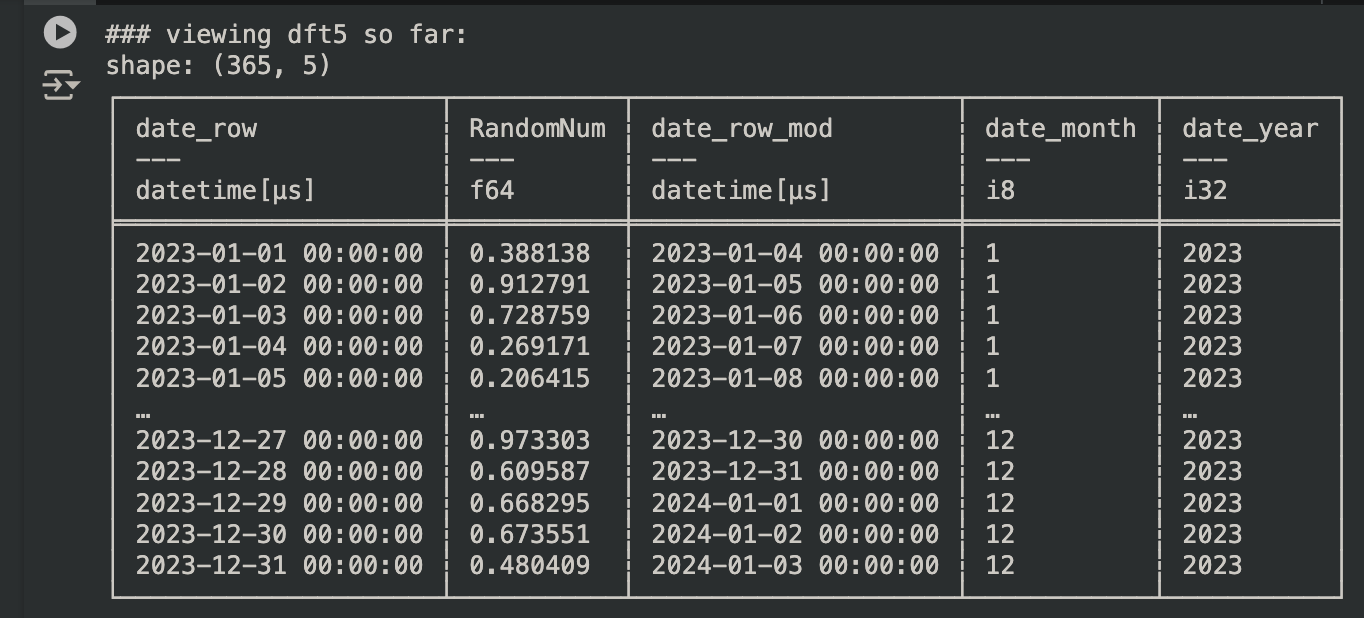
Let's look at our DataFrame so far.
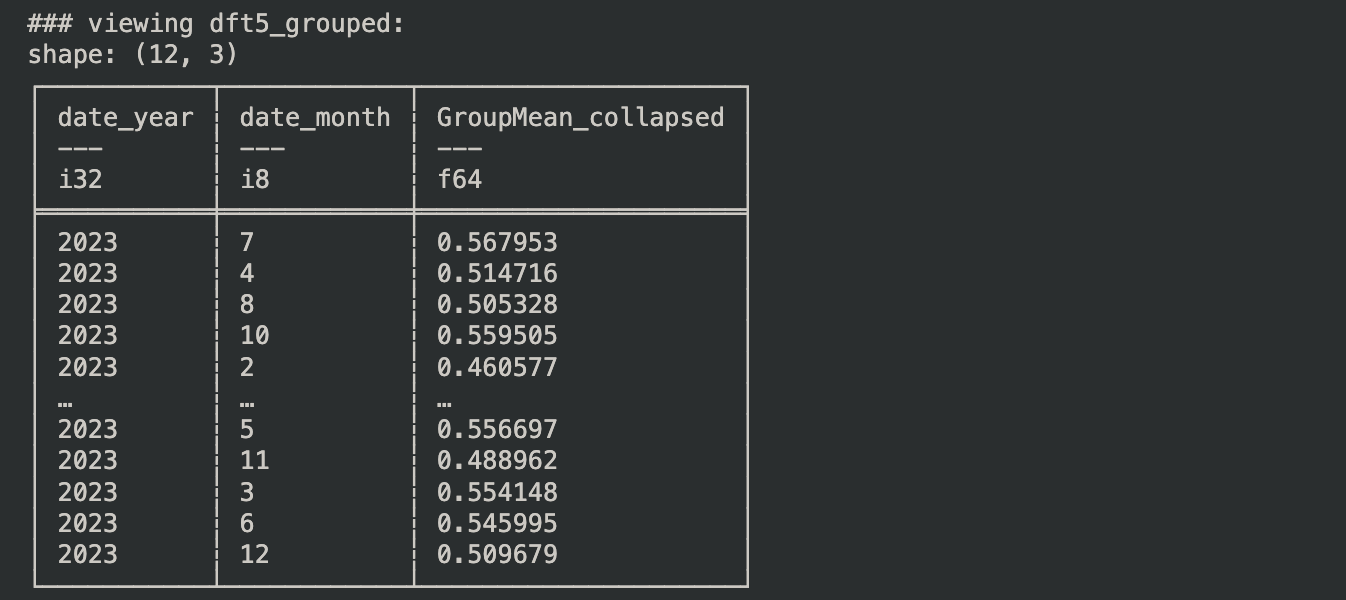
Now, let's find the mean value of the RandomNum column, for each group of rows with the same year and month. Here's how we do it.

The result looks like this. Notice it only has 12 rows, because there are only 12 unique groups (unique combinations of year and month) in our data.
We can also run a calculation on a group without collapsing our DataFrame. If the calculation is something like min, mean, or max, we will see a lot of repeating values (since each group has one max, min, and mean value). This is similar to using pd.groupby().transform() in pandas.
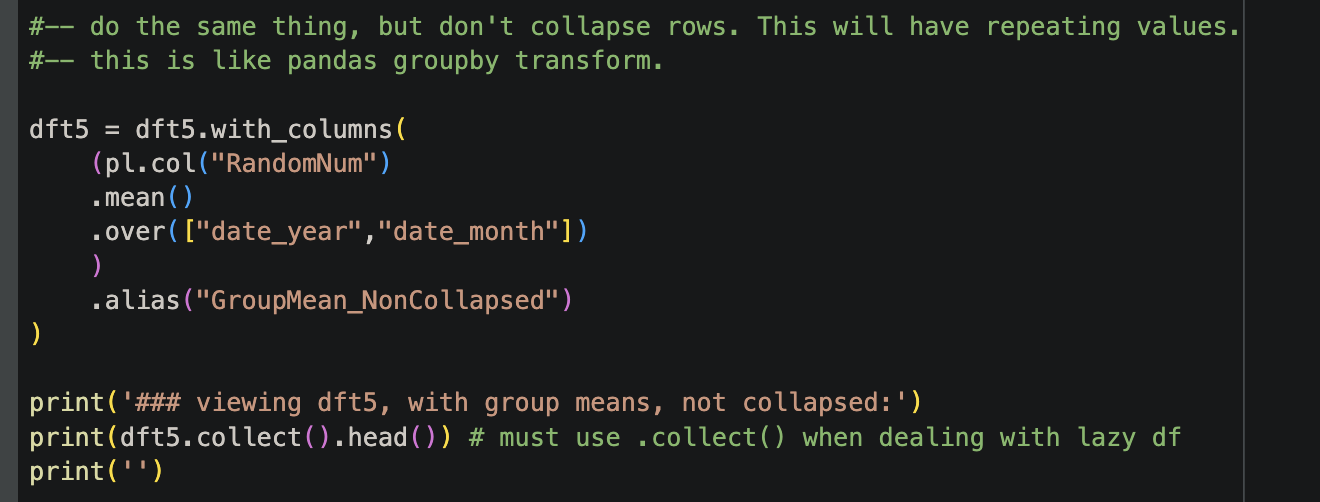
The result looks like this.
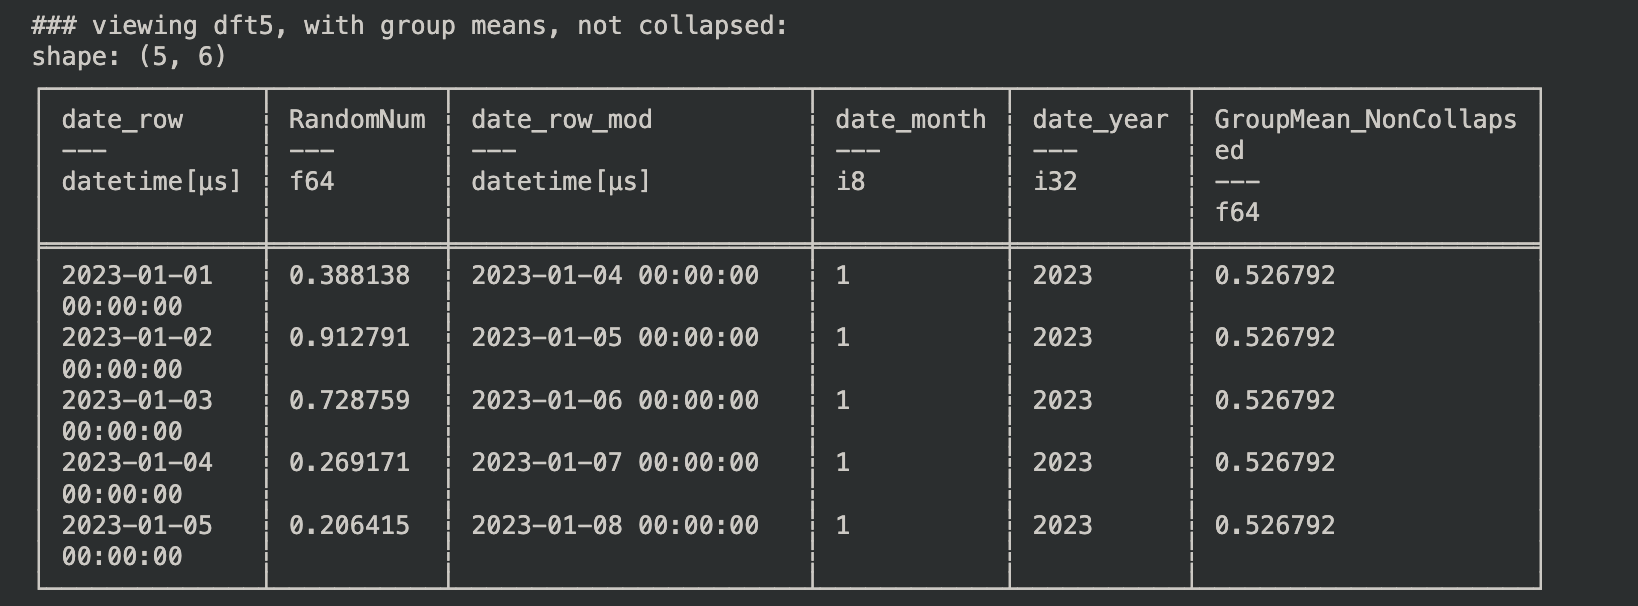
Notice the repeating values. However, if we replace mean() with something else, like rolling_mean(), the values will change over time. You can give it a try yourself. Make sure you view enough rows.
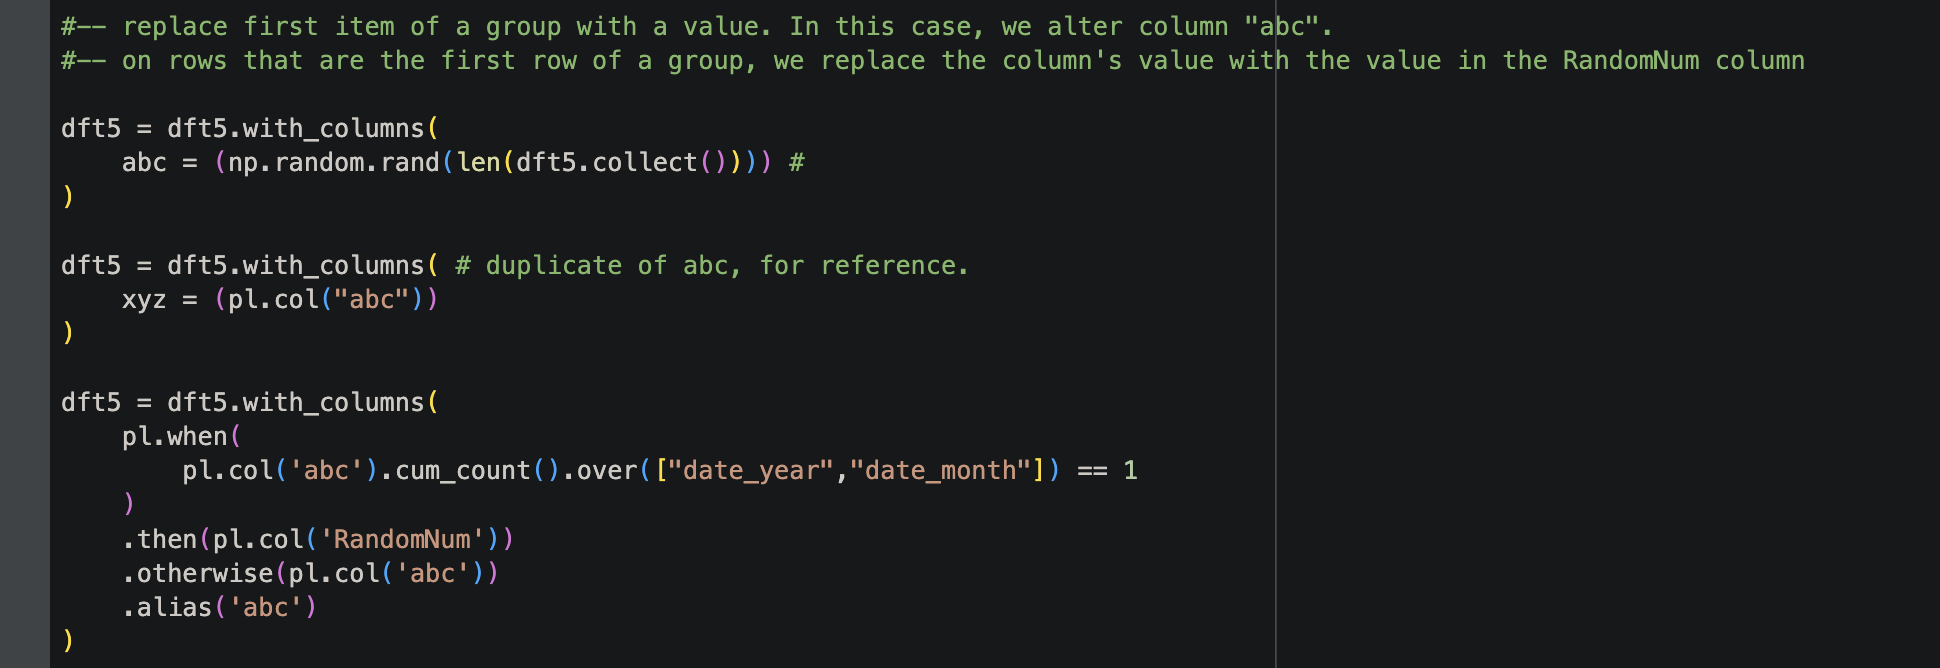
Ok, now we'll do something more advanced. We will replace the first item of a group with a value. In this case, we alter column "abc". On rows that are the first row of a group, we replace the "abc" column's value with the value in the "RandomNum" column.
Here is the code. As you can see, we first make new columns, "abc", and "xyz" (a duplicate of "abc", for reference). Then, we make the alteration.
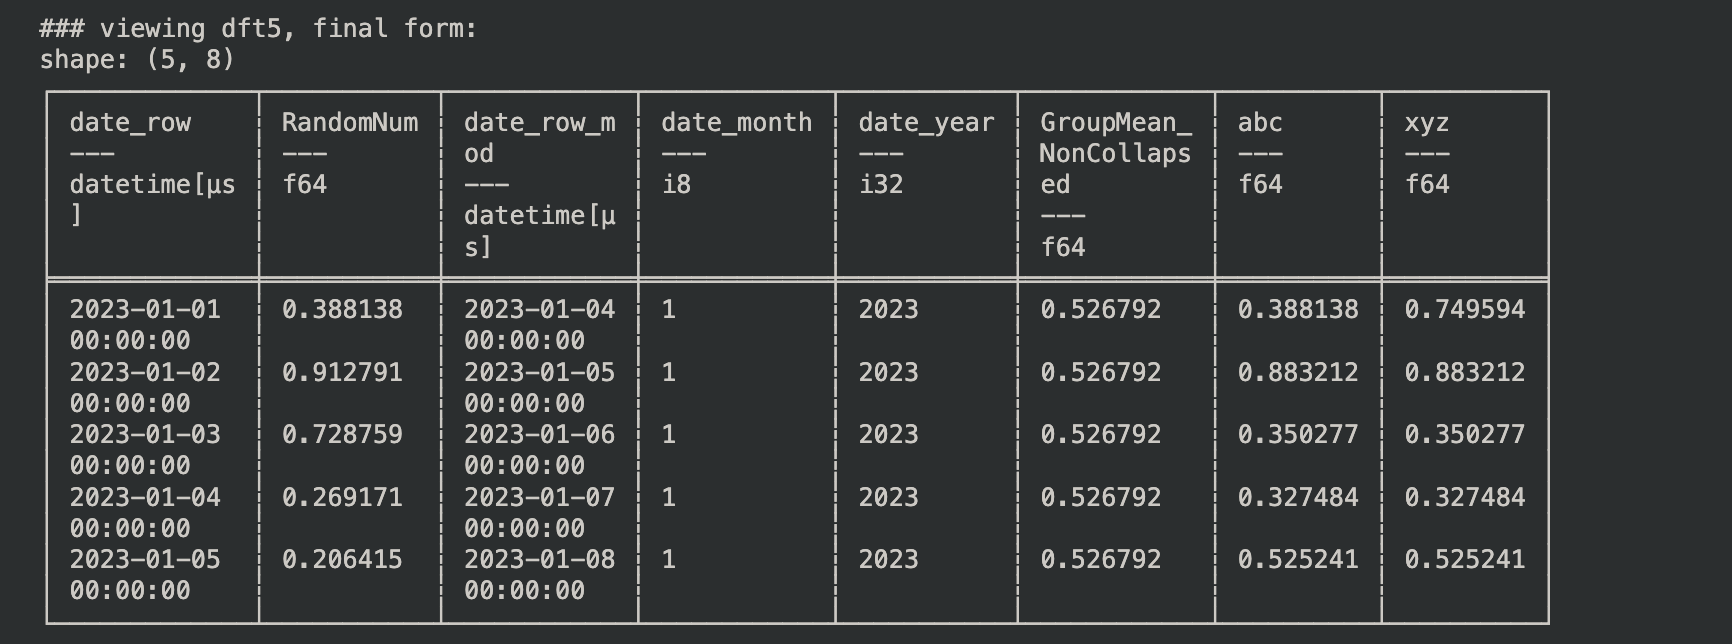
Let's look at the result. As you can see, "abc" looks just like "xyz", except in the first row. In that row, the "abc" column equals the value in column "RandomNum", since that row is the first row in our group (year 2023, month 1).
Part 5 - select columns if name contains string; row-wise count
Sometimes, we want to focus on columns whose names contain a string. We can do this using this excerpt:
pl.col("^.(abc|xyz).$")
This bit of code helps us select columns that contain either "abc" or "xyz" somewhere in their names.
In the code below, we first apply that selection criteria, and then, we count the number of non-NaN values that are in each row.

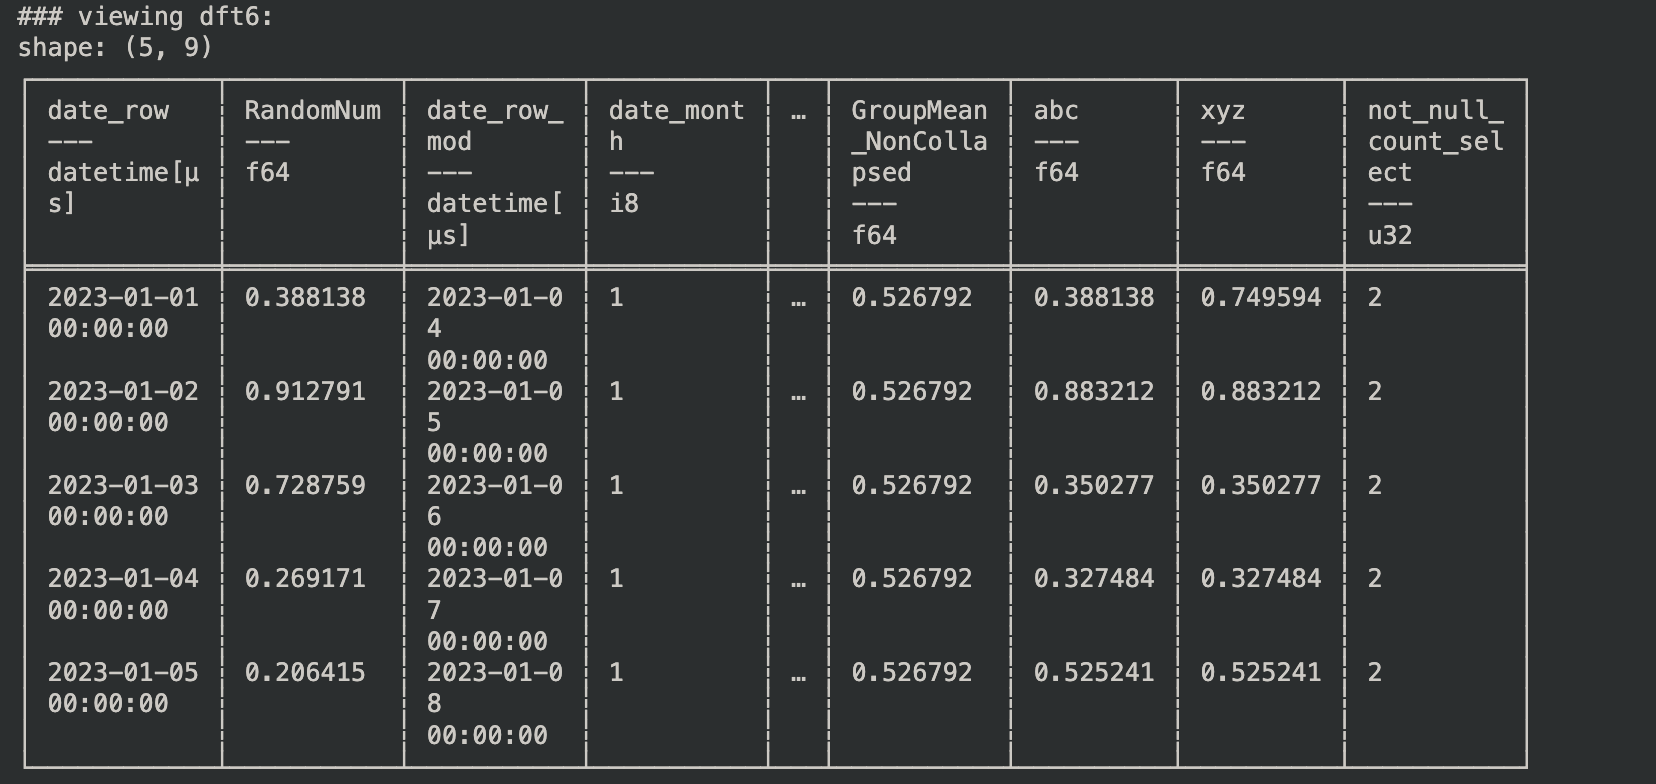
Let's look at the result. Since we are only looking at 2 columns, and they never have np.NaN values, we should always see a count of 2 non-NaN values.
Wrapping Up
If you made it through this, congratulations! You already know a lot about using Polars to analyze data more efficiently, and can do some advanced stuff including parallelization!
I focused on examples so you can tweak them for your own purposes and immediately use them in your code. When I was learning Polars, I wished there were more clear examples, so I decided to make some to help others learn!
Thanks again for reading! And if you got value from this, feel free to buy me a cup of coffee!