

This article shares some ways we can use the Pandas library more efficiently. We'll be looking at examples that involve time series data. These examples are from a Colab notebook I made, located here.
If you find it useful it, feel free to buy me a cup of coffee!
Part 0: Making Fake Data
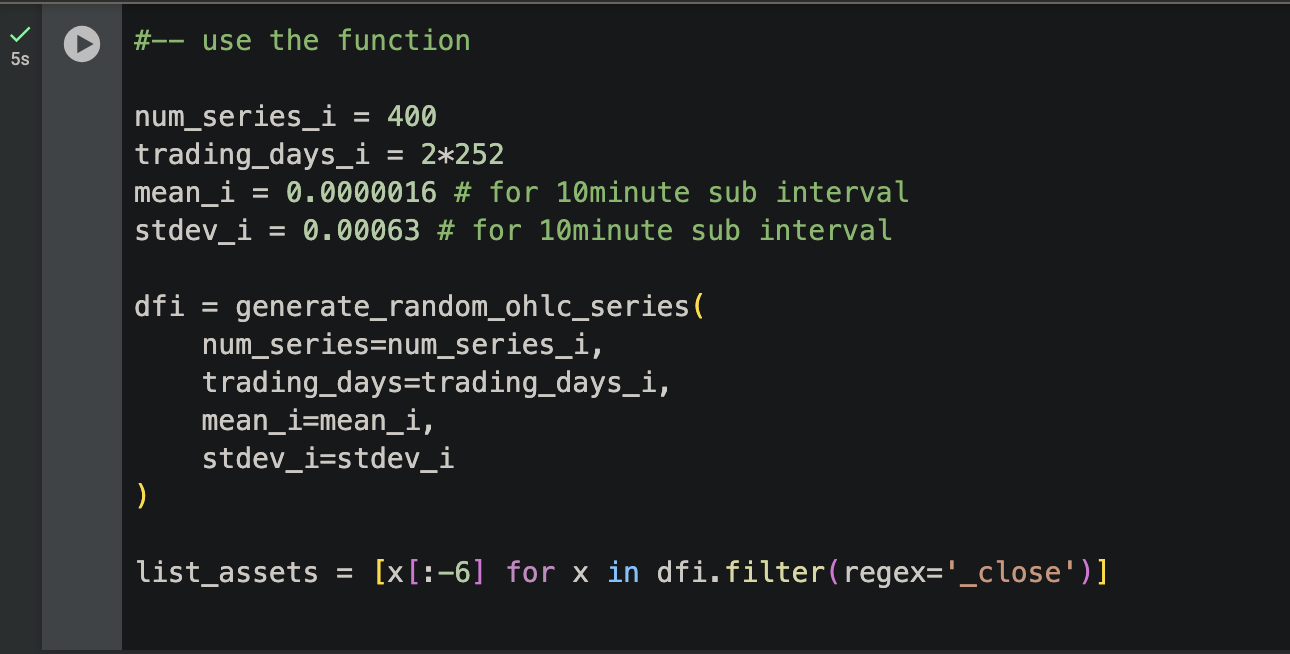
First we will make some fake price data using a function we have defined. We'll create data related to 400 different stocks, and each one will have around 2 years worth of daily data.
We will also get a list of the names of our fake stocks; to do that, we select the columns that contain "_close" in the name, and we remove the last 6 characters ("_close") from their names. That is how we make "list_assets". Our list will include ABC1, ABC2, etc.
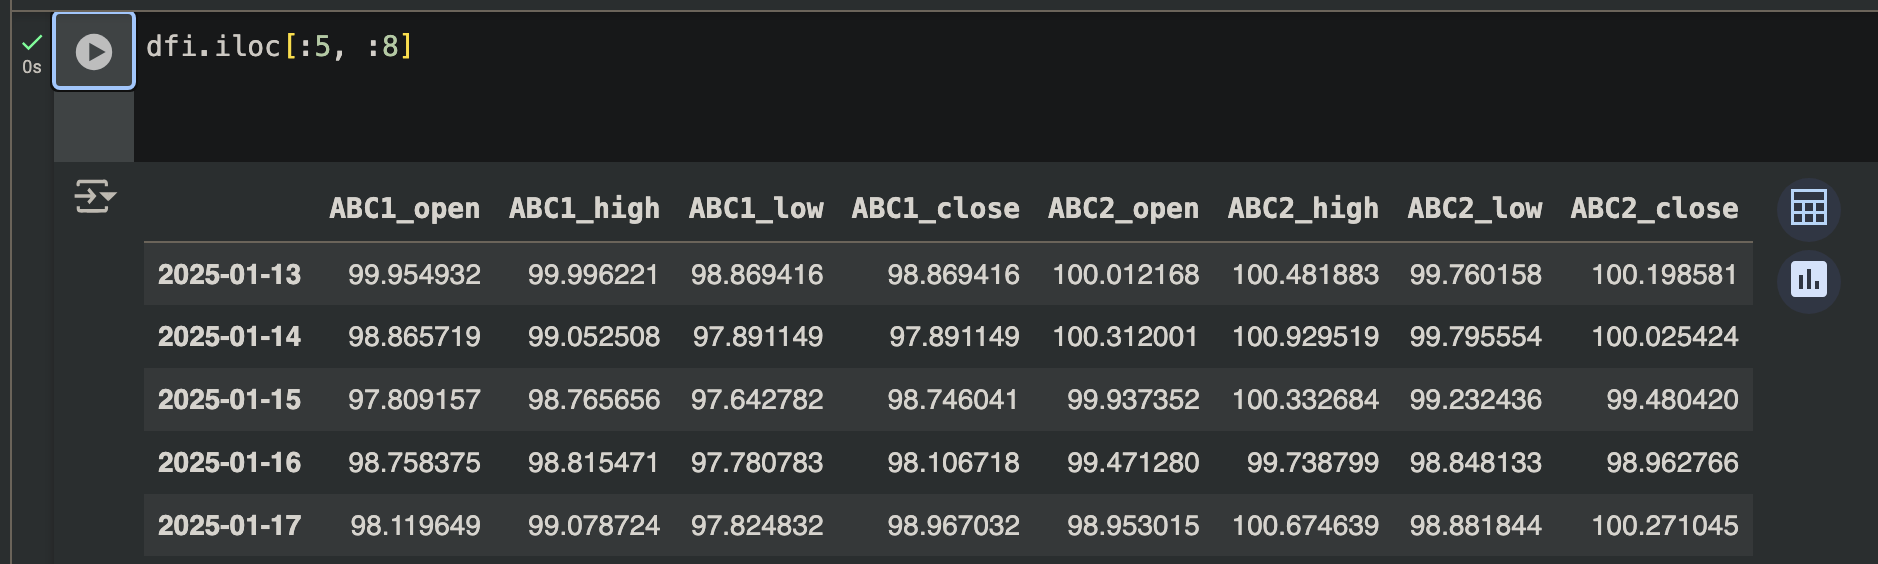
Our fake data will look like this.
Part 1A: Slow Way to Find Distance from Rolling Mean, Max, and Min
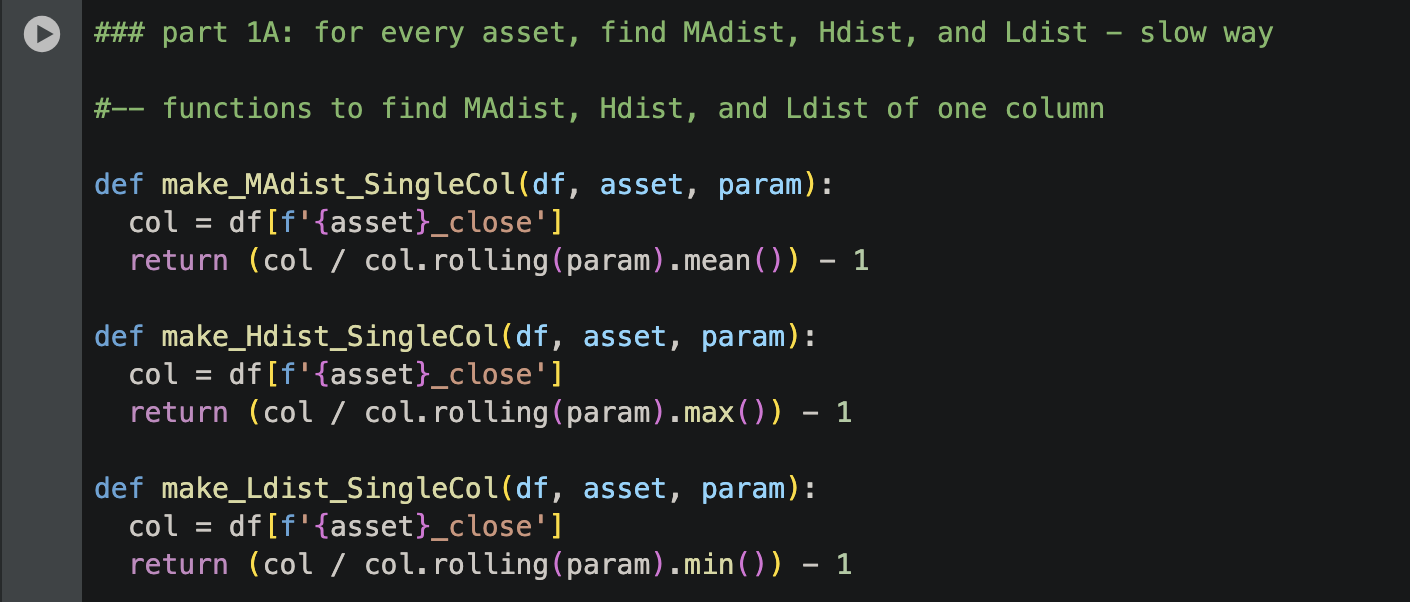
Imagine that for each stock, we want to find the percentage distance from the stock's current close to the stock's moving average (the rolling average of its close values). We also want to find percentage distances to the stock's rolling max (aka high) and rolling min (aka low).
When I first started working with pandas, I would use a function that returns a column of results for a particular stock. Functions like this:
I would iterate over each stock in my list and use the function on each one separately, like this:
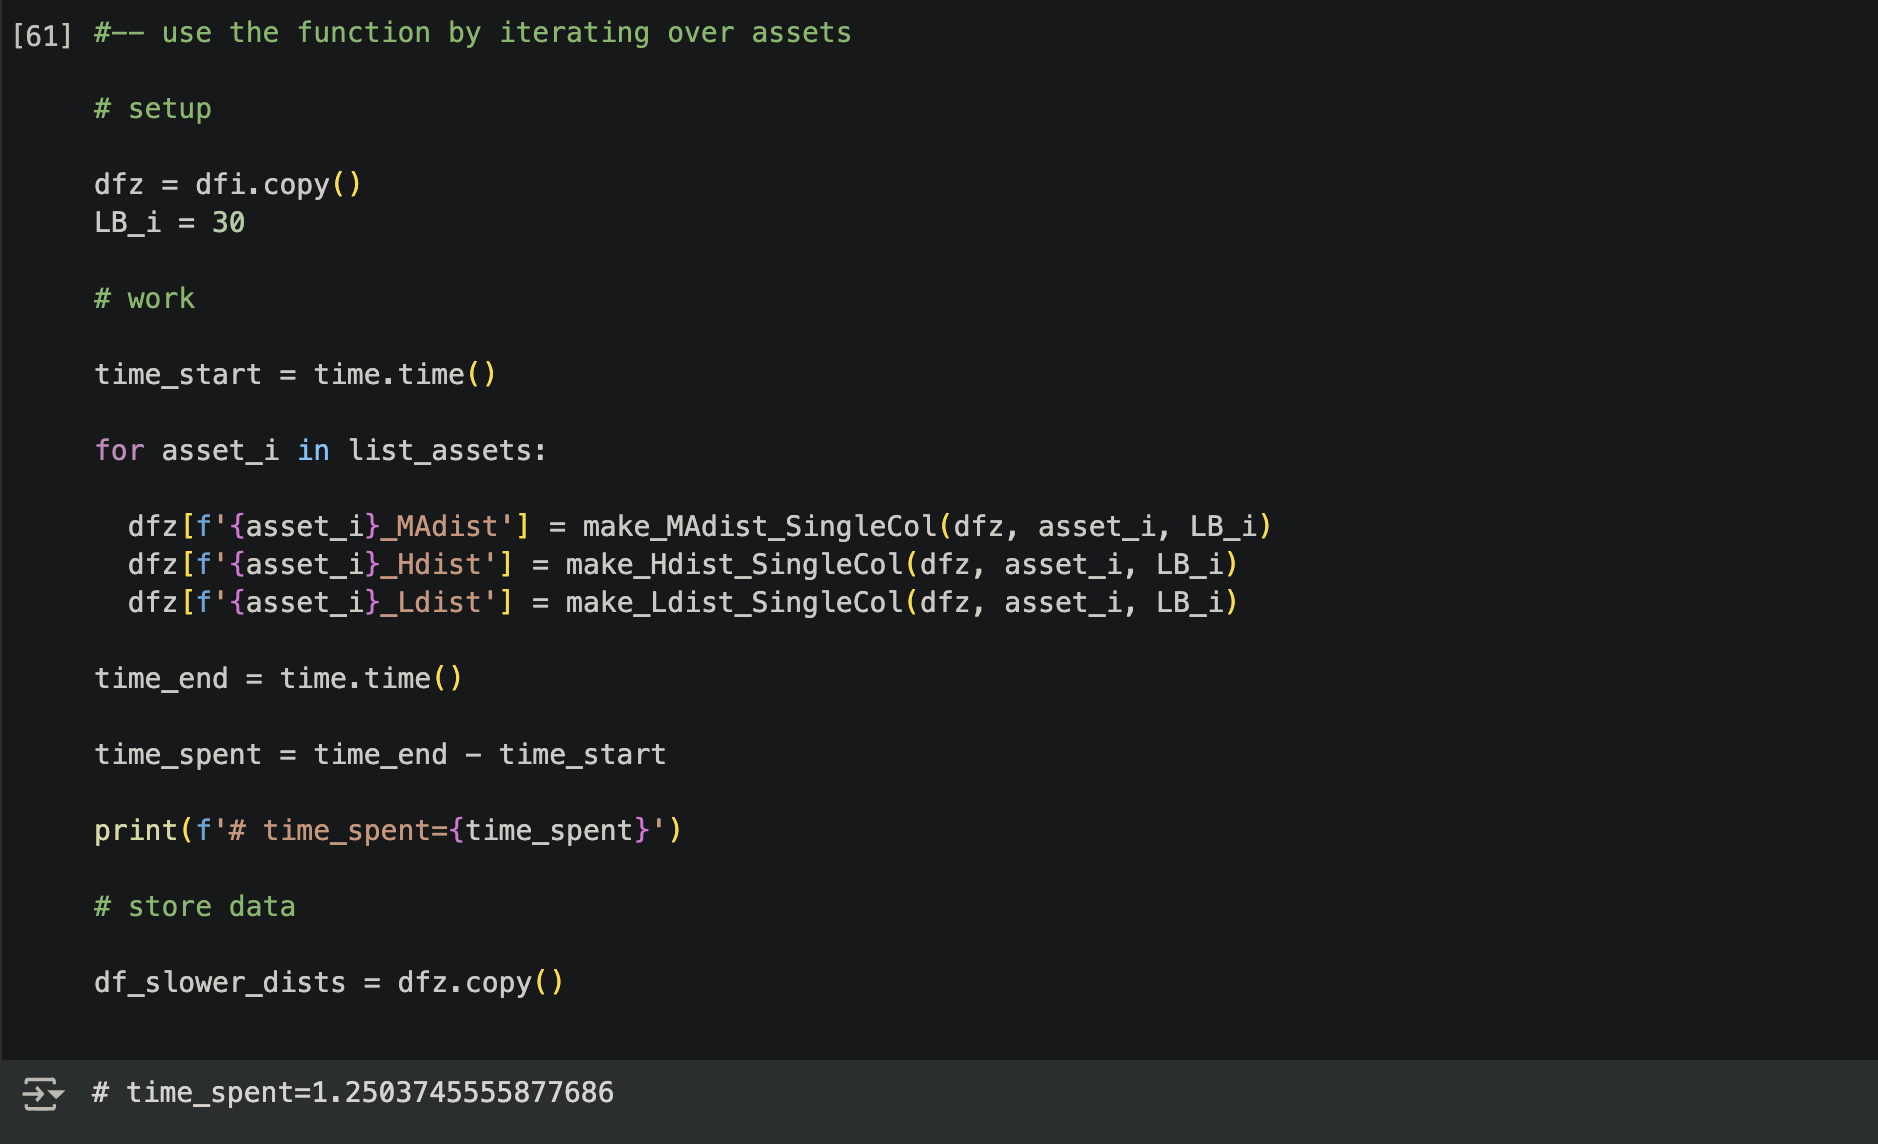
This takes about 1.25 seconds when I perform this calculation on 400 stocks that each have ~ 300 rows of data.
Part 1B: Faster Way to Find Distance from Rolling Mean, Max, and Min
It's much faster to handle all stocks at once, instead of iterating over them one at a time. To do this, our functions should return a dataframe of results, instead of a column of results. Our functions should be acting on input data that is a dataframe, not a single column (not a series).
These functions should be updated to look like this:
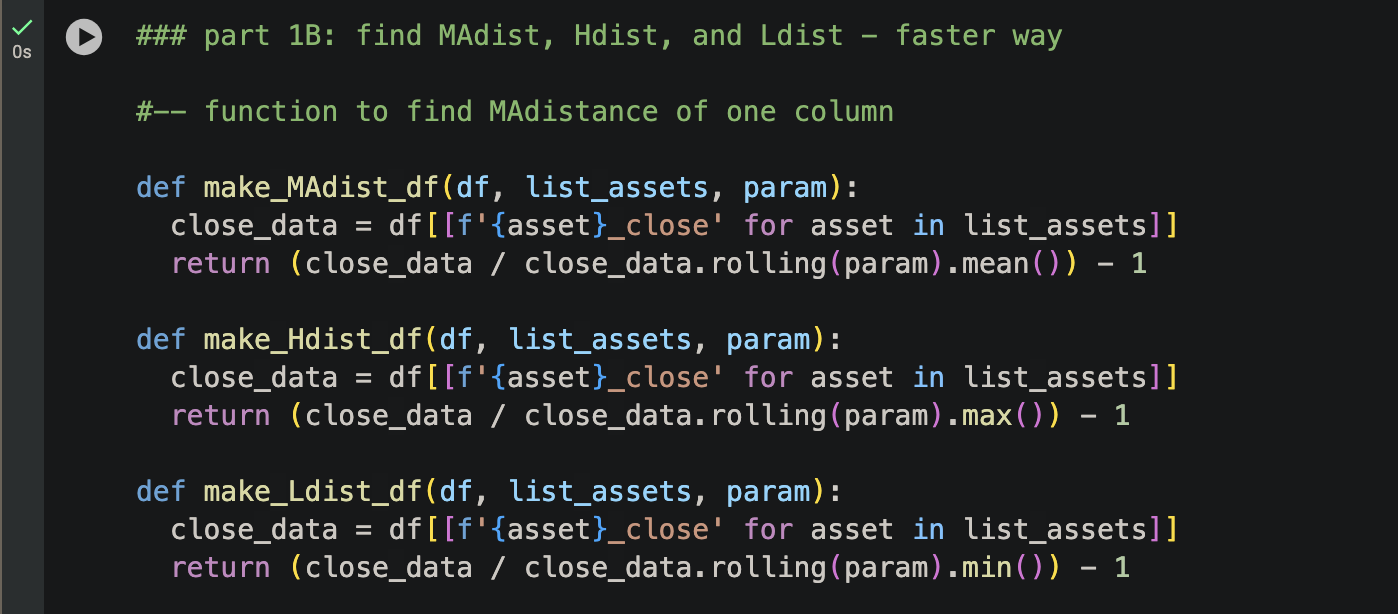
This will return a dataframe of results. We will need to combine these result dataframes to our original dataframe, using pd.concat. Before doing that, we will need to name the columns of our result data. Here's what that looks like.
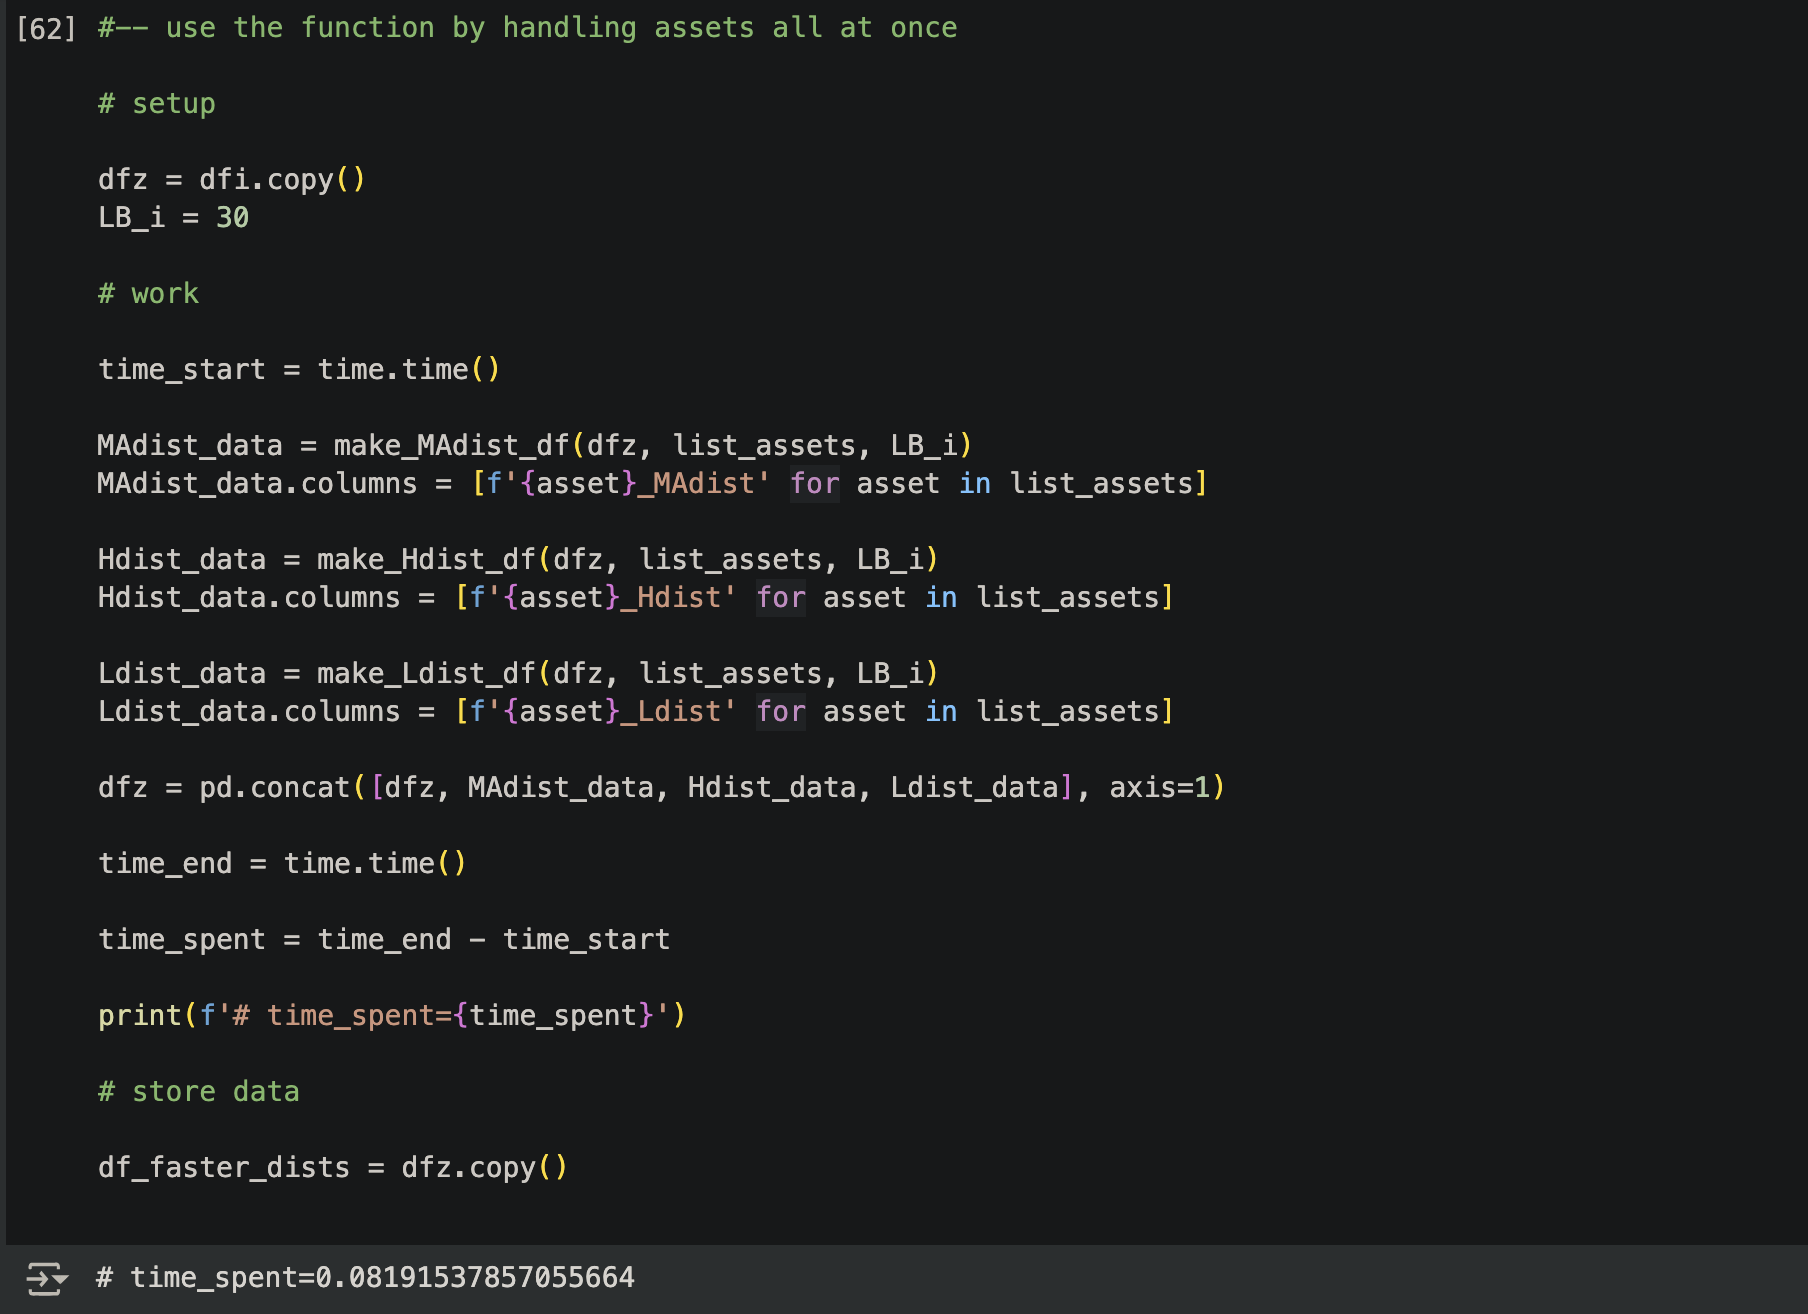
As you can see, this is much faster. It takes 0.08 seconds, compared to 1.25 seconds when we use the previous method.
Now let's compare our output data to make sure the results are identical. We will use the .equals method that pandas offers. Using it often looks like this: "bool_result = df1.equals(df2)". We are using filter() to focus on columns that have something in it, like MAdist or Hdist.
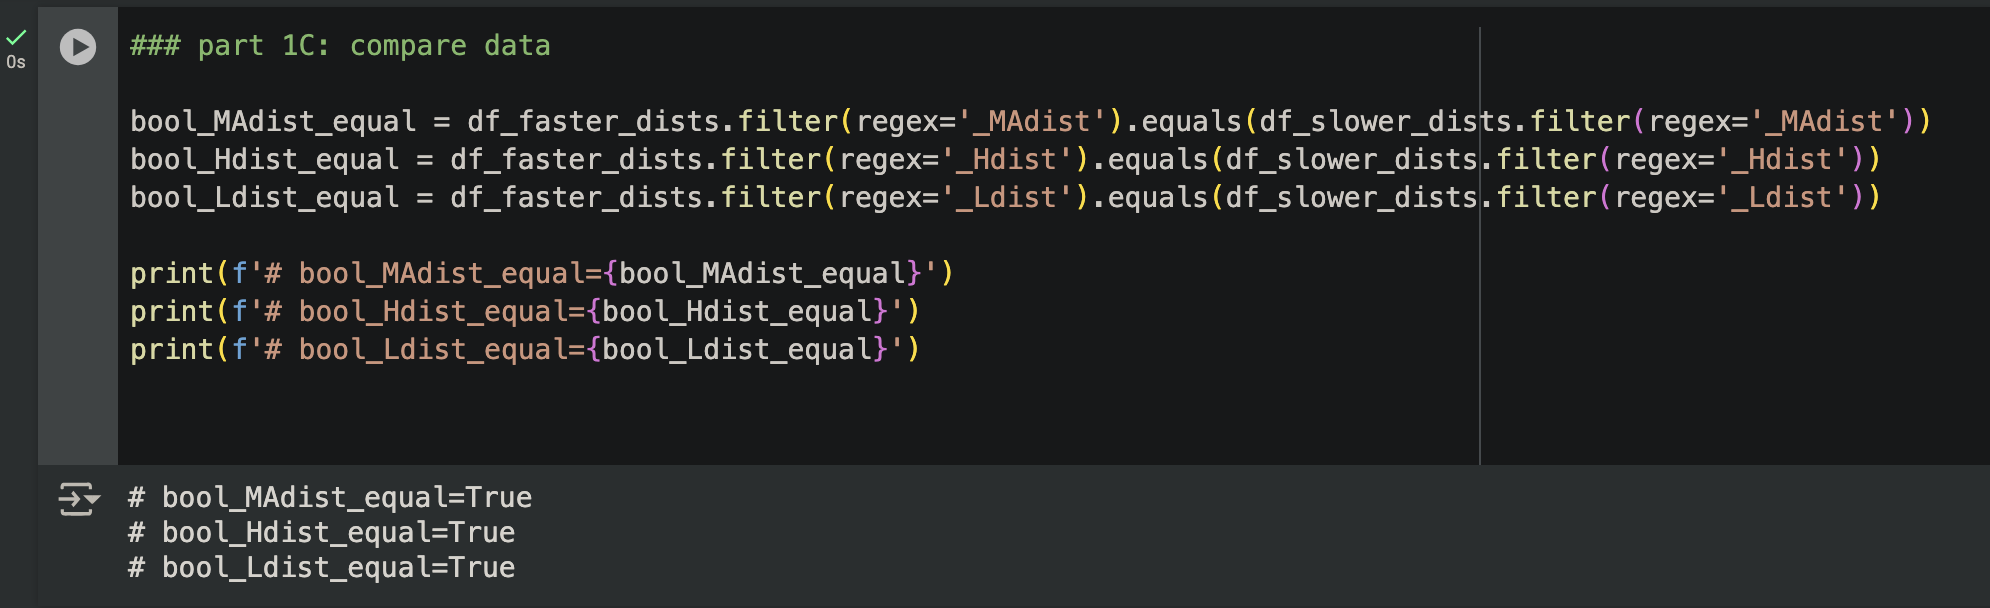
Looking good!
Part 2A: Slower Way to Make a Filtered Column Based on Two Other Columns
Suppose that for each stock, we want to make another column. When two conditions are true, this column displays data that is in our "MAdist" column. Otherwise, its values are np.nan.
Previously, I would iterate over each stock and use .loc to apply these conditions, like so:
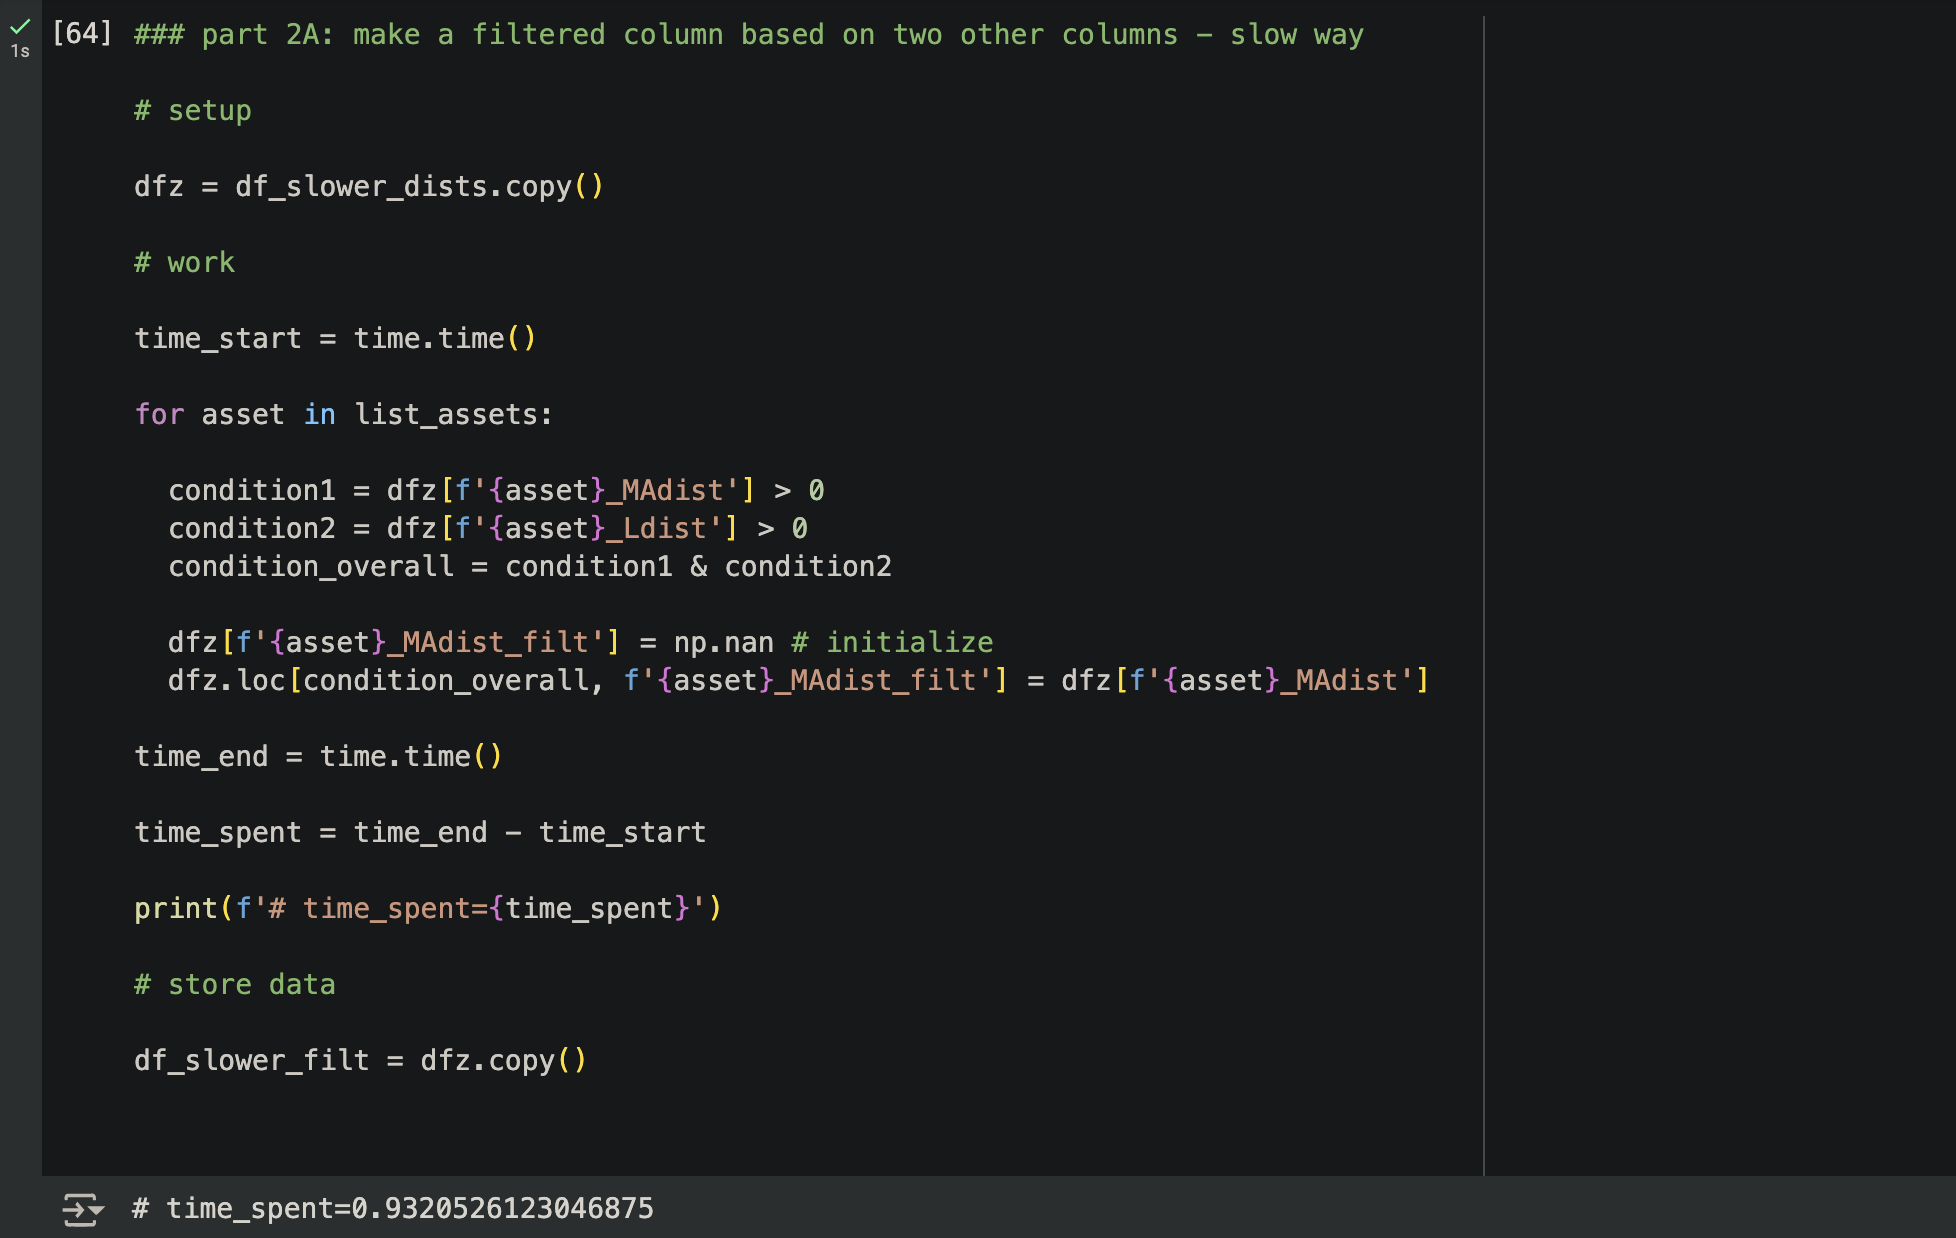
This takes about 0.93 seconds.
Part 2B: Faster Way to Make a Filtered Column Based on Two Other Columns
Again, we will save time by handling all assets at once. Instead of using .loc to handle logic, we will use np.where. We will consider our logic by creating numpy arrays (mask1, mask2, etc) that hold boolean values. Here's what that looks like.
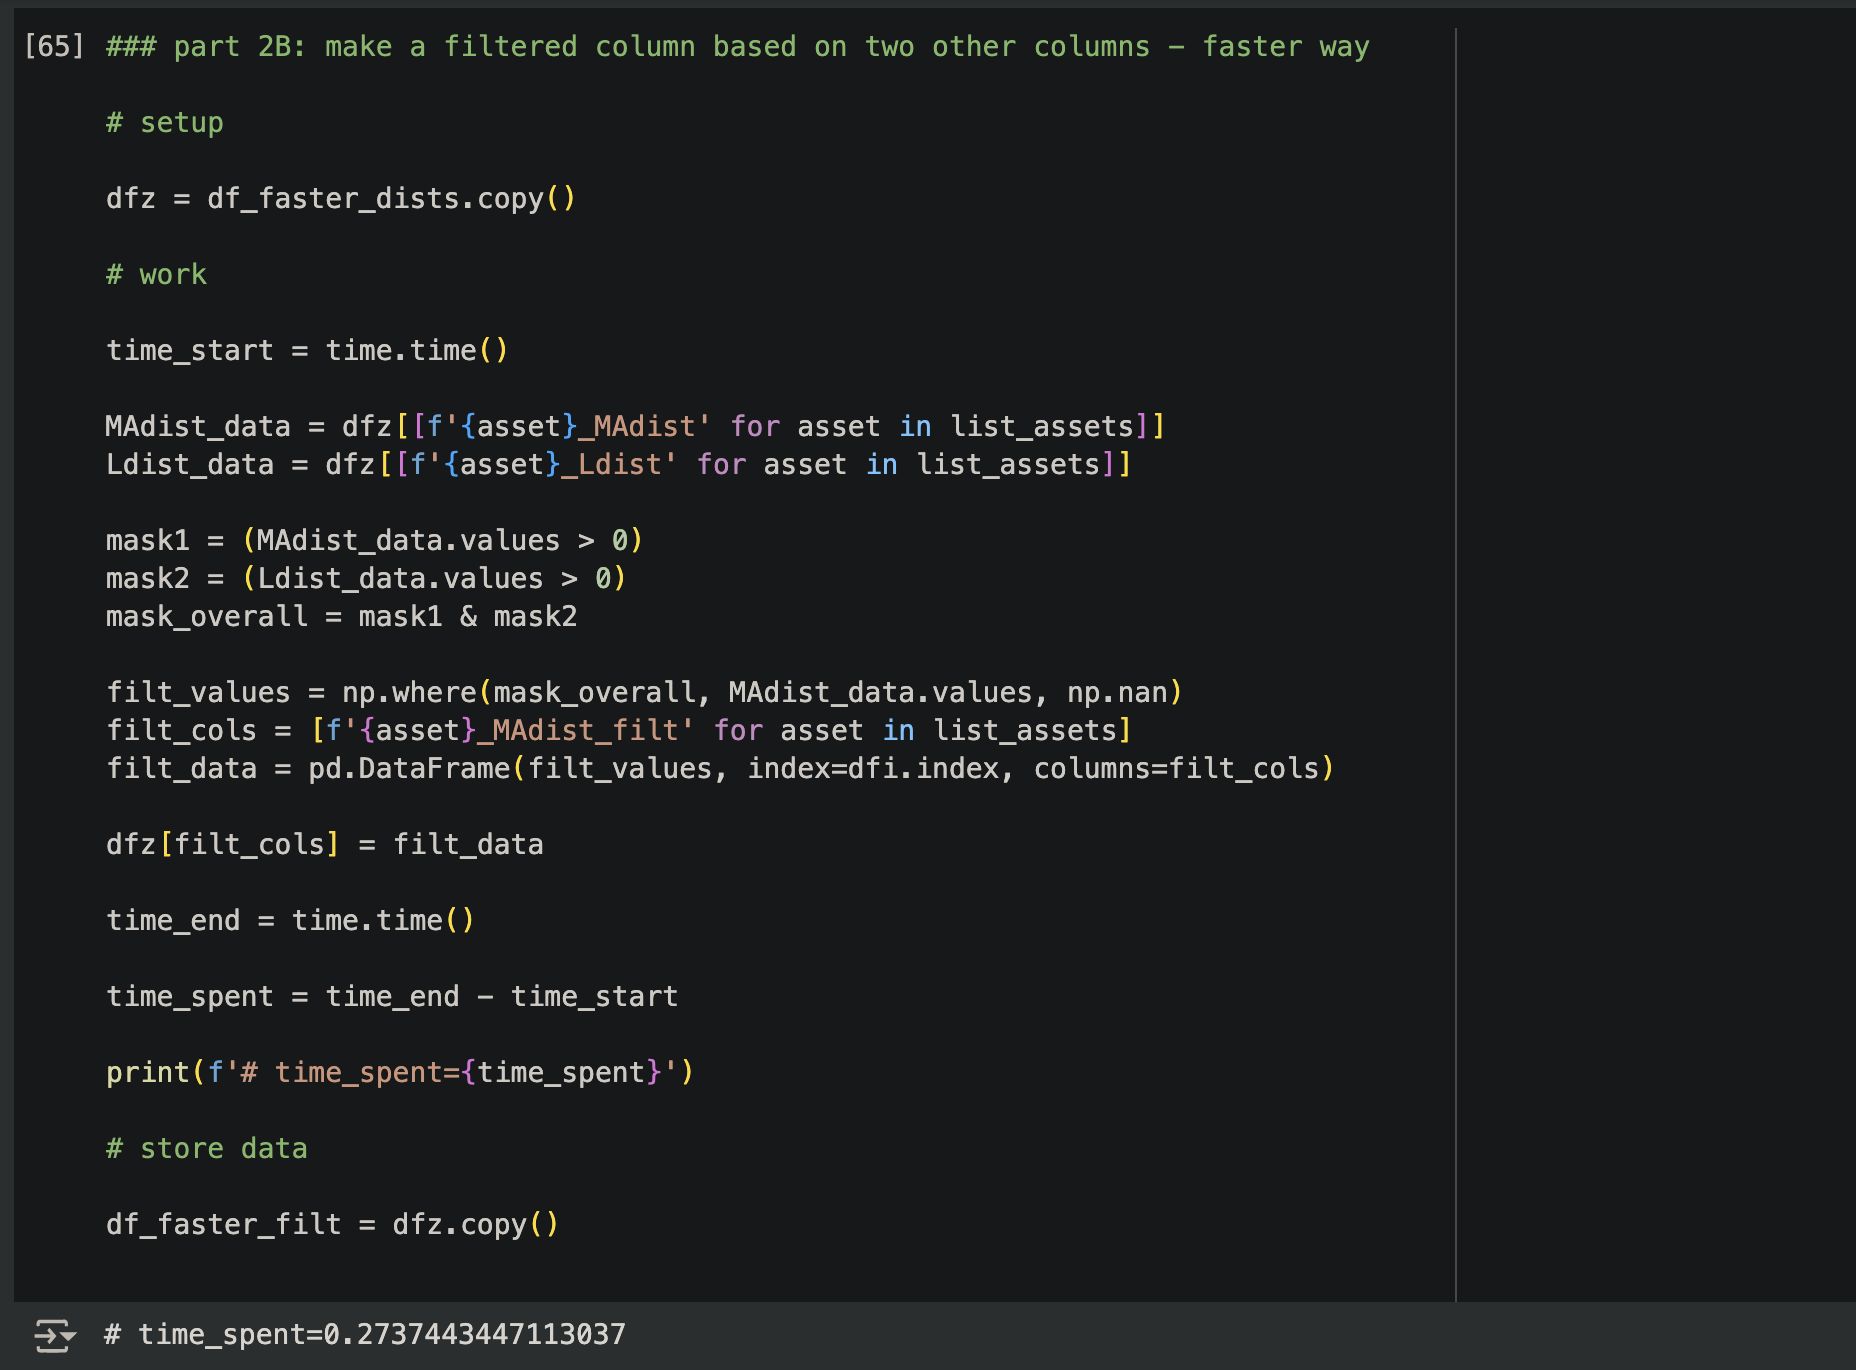
We make MAdist_data, a dataframe that has the "MAdist" columns for all of our assets. Similarly, we make Ldist_data. These dataframes have the same dimensions.
We make "mask1", a table of boolean values. Whenever our MAdist condition is met, this table holds a 1, otherwise it holds a 0. This table is stored as a numpy array. Similarly, we make "mask2" to handle our condition related to Ldist columns. After that, we make "mask_overall", which is a numpy array that considers both boolean masks, and has boolean values inside.
The filtered data is created by taking our mask_overall and using np.where. This results in a numpy array. When our mask is True, we display the numerical values in MAdist_data, otherwise we display a np.nan value.
Finally, we convert that numpy array to a dataframe, using pd.DataFrame, and we add that data to our existing dataframe, dfz.
Overall, this takes 0.27 seconds, significantly faster than the previous method.
When we compare the results of the slow and faster methods, we see they match up.

Part 3 Intro: Portfolio Rebalancing
Suppose we want to simulate the investing results of holding a group of stocks. We start off with $100 and divide that equally into each stock. Over time, some stocks may rise a bunch while others fall. This means the fraction of money (aka "weight") we have in some stocks will rise a bunch, others will fall, and we will no longer have an equal amount of money in each stock.
Our actual weights will deviate from what we desired and have an error. When that error exceeds a certain amount, we want to do a rebalance - we look at how much money we have now, and we divide it equally into each stock. (note: in this example, I am reinvesting profits. That may not always be ideal).
Doing this will require row by row iteration. The code I will show you is one way to do this, but there may be better ways.
Part 3A: Slower Approach to Row by Row Portfolio Rebalancing
Let's look at how to do this by iterating over a pandas dataframe.
First, we get our data and define our parameters, like our error threshold (0.6%). Our rebalance cost is 7bps, so if we have $100 in a stock, a rebalance will lead to a loss of 7 cents.
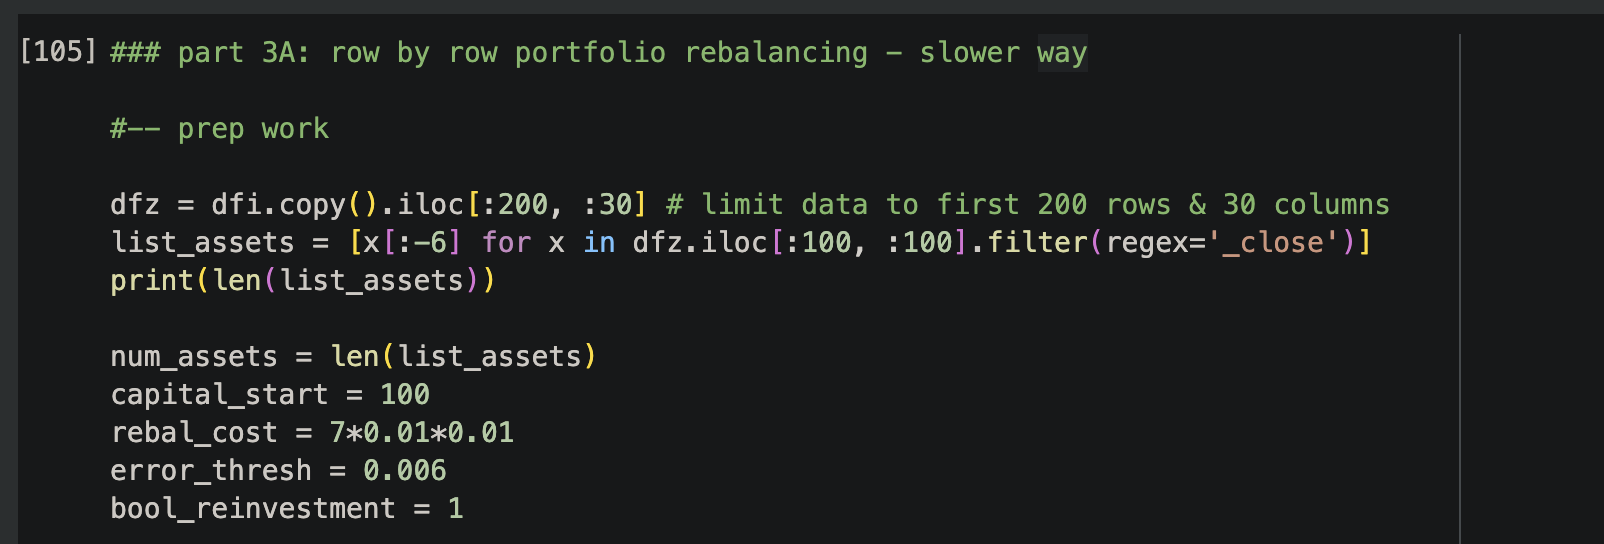
Next, we initialize some columns. At the end of each day, we want to know how much profit we've gained (or lost) from our stock holdings, how much our stock holdings are worth, how much cash we have amassed, and our total amount of capital. We need columns to track these things.
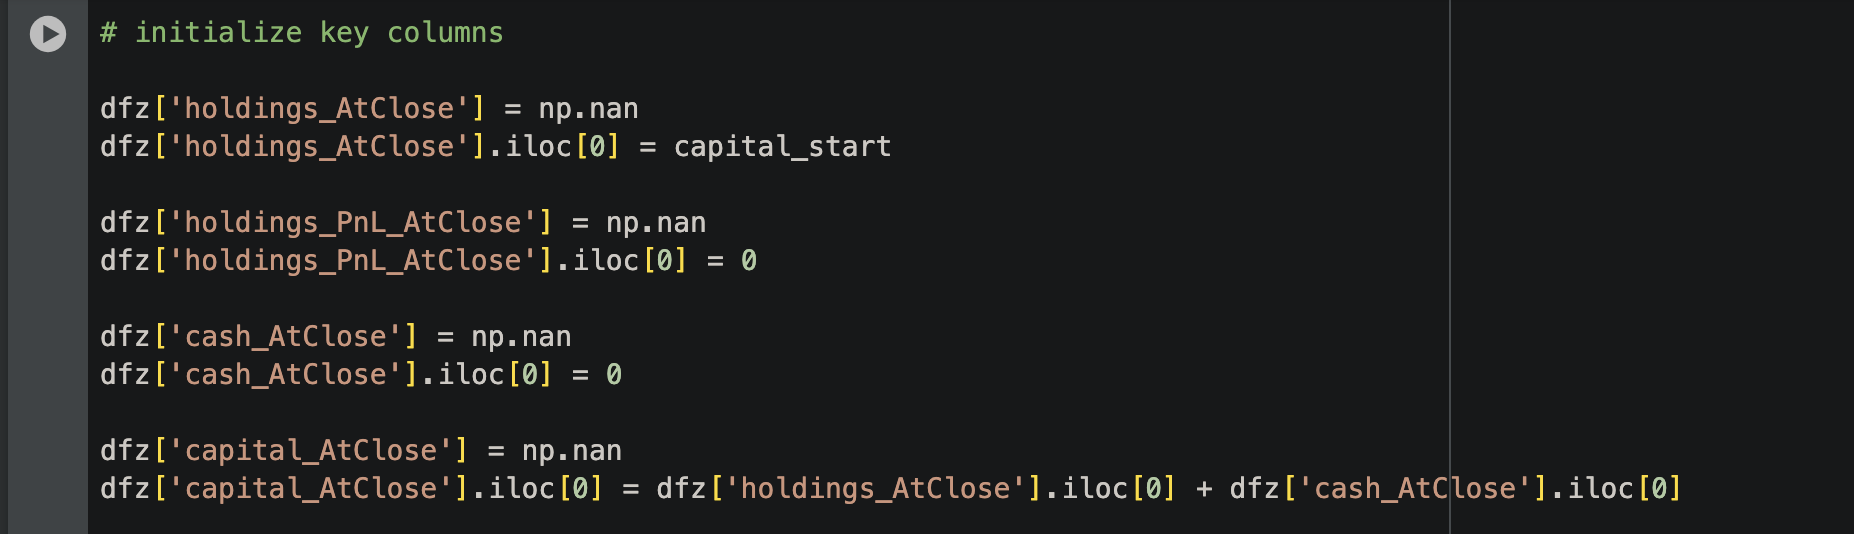
As we amass profits, we build up cash over time. Then, when a rebalance event occurs, we take the all of our money, which consists of our stock holdings and our cash, and divide it evenly into each stock. These columns will help us achieve this.
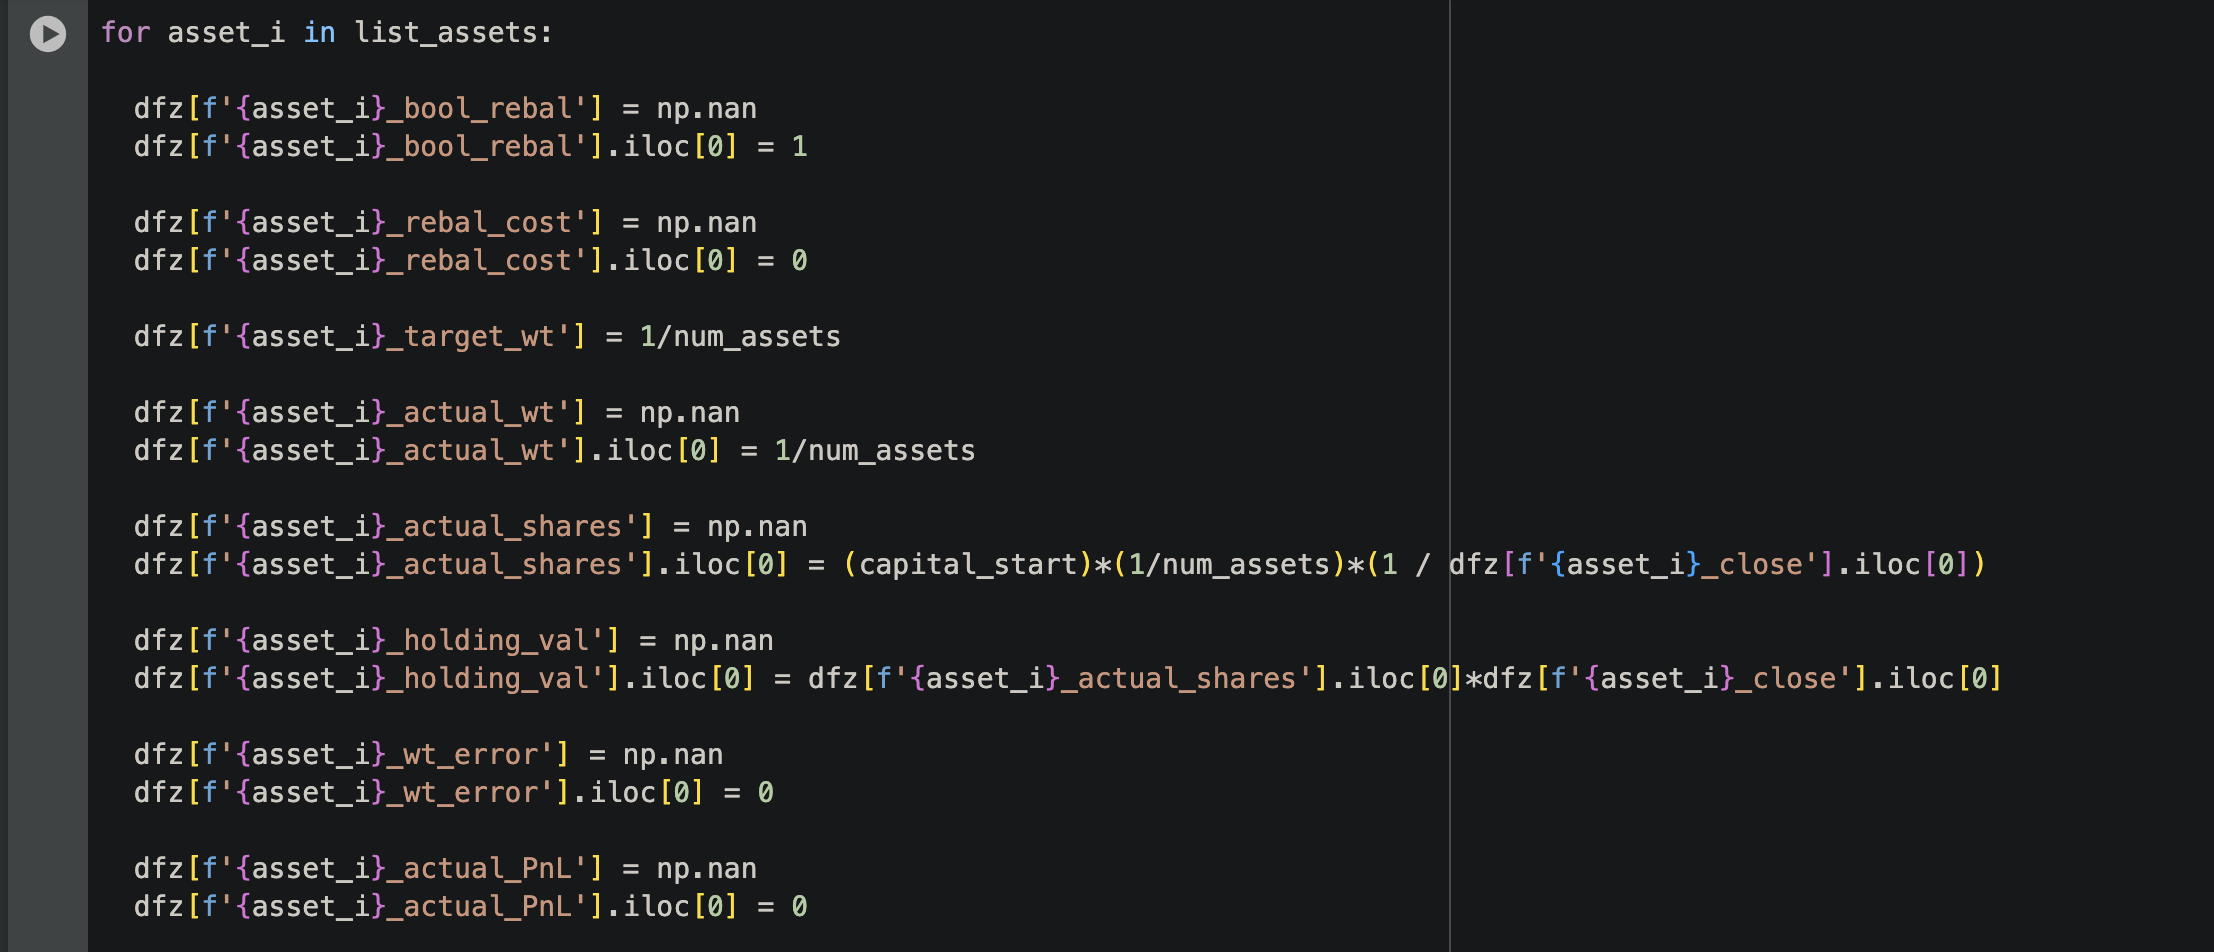
We also need to initialize some columns that relate to each stock that we own. We want to keep track of whether we need to do a rebalance, what our rebalance cost might be, and what our target weight is. We also want to track our actual weight in that stock, our actual number of shares that we own, the value of our shares, the weight error (actual minus desired), and our profit or loss that this stock has delivered for a given day.
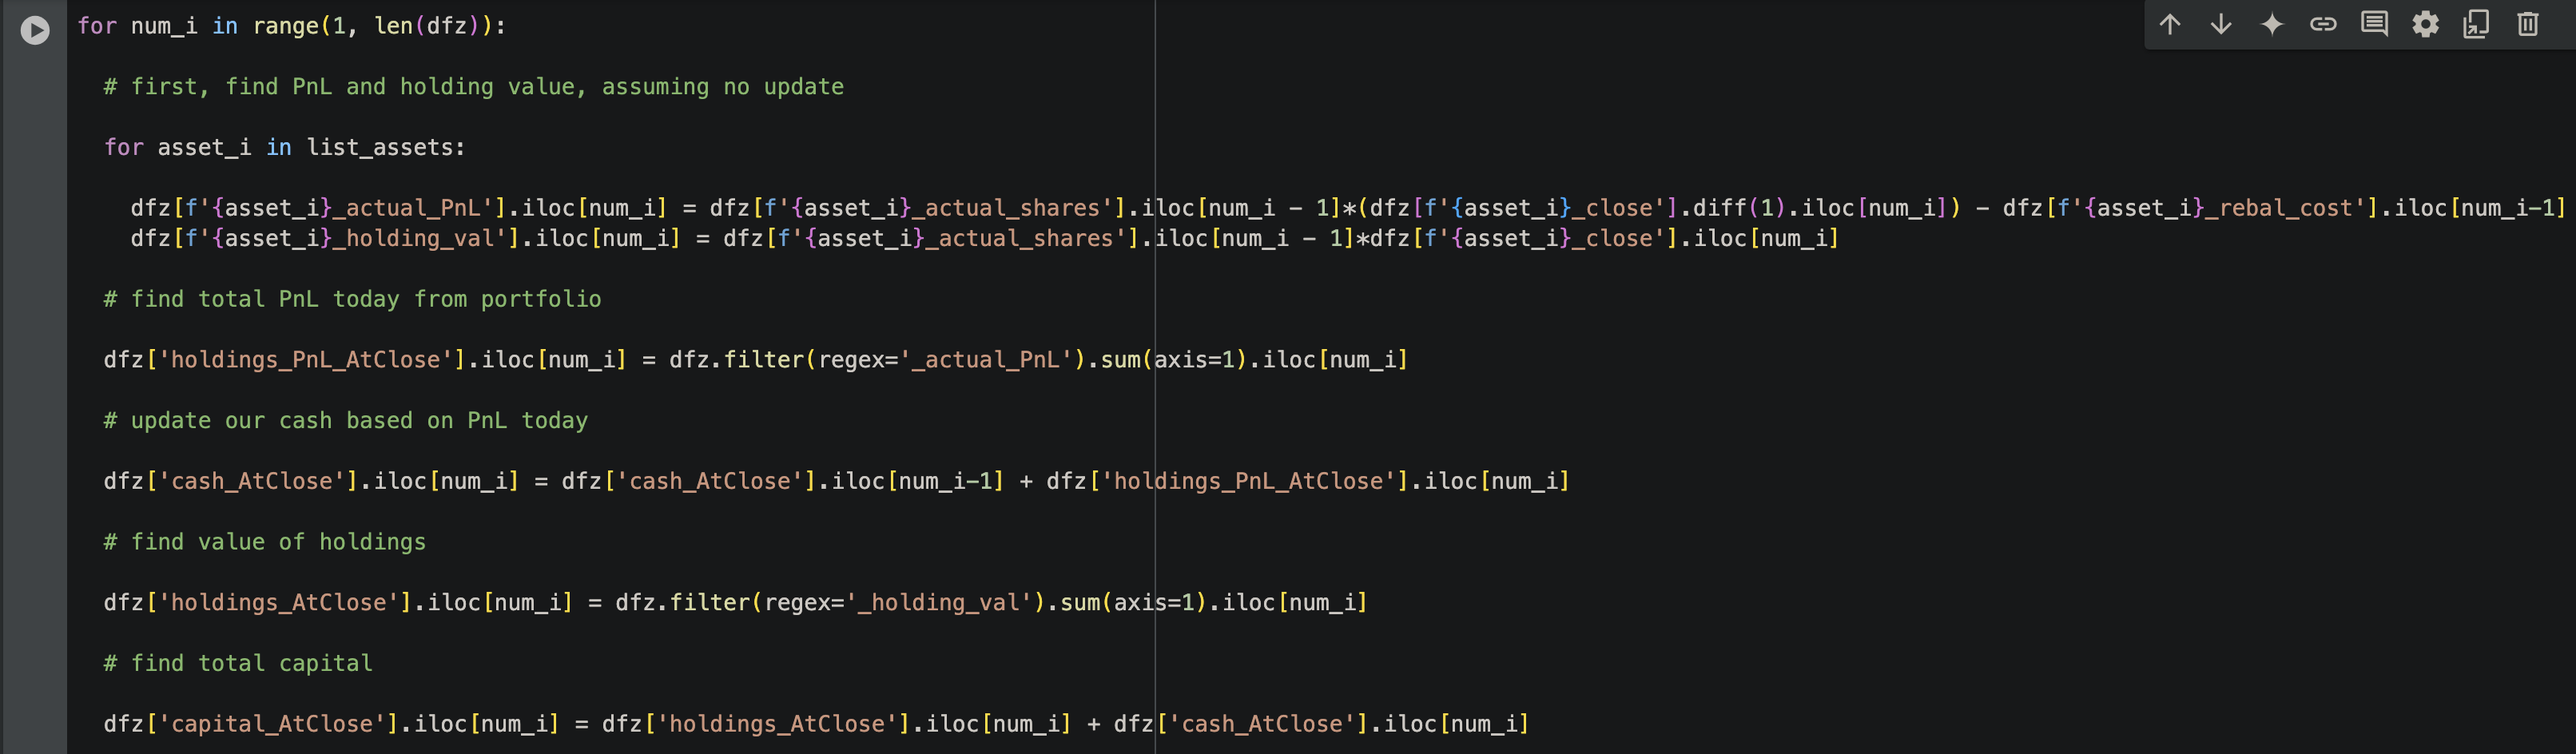
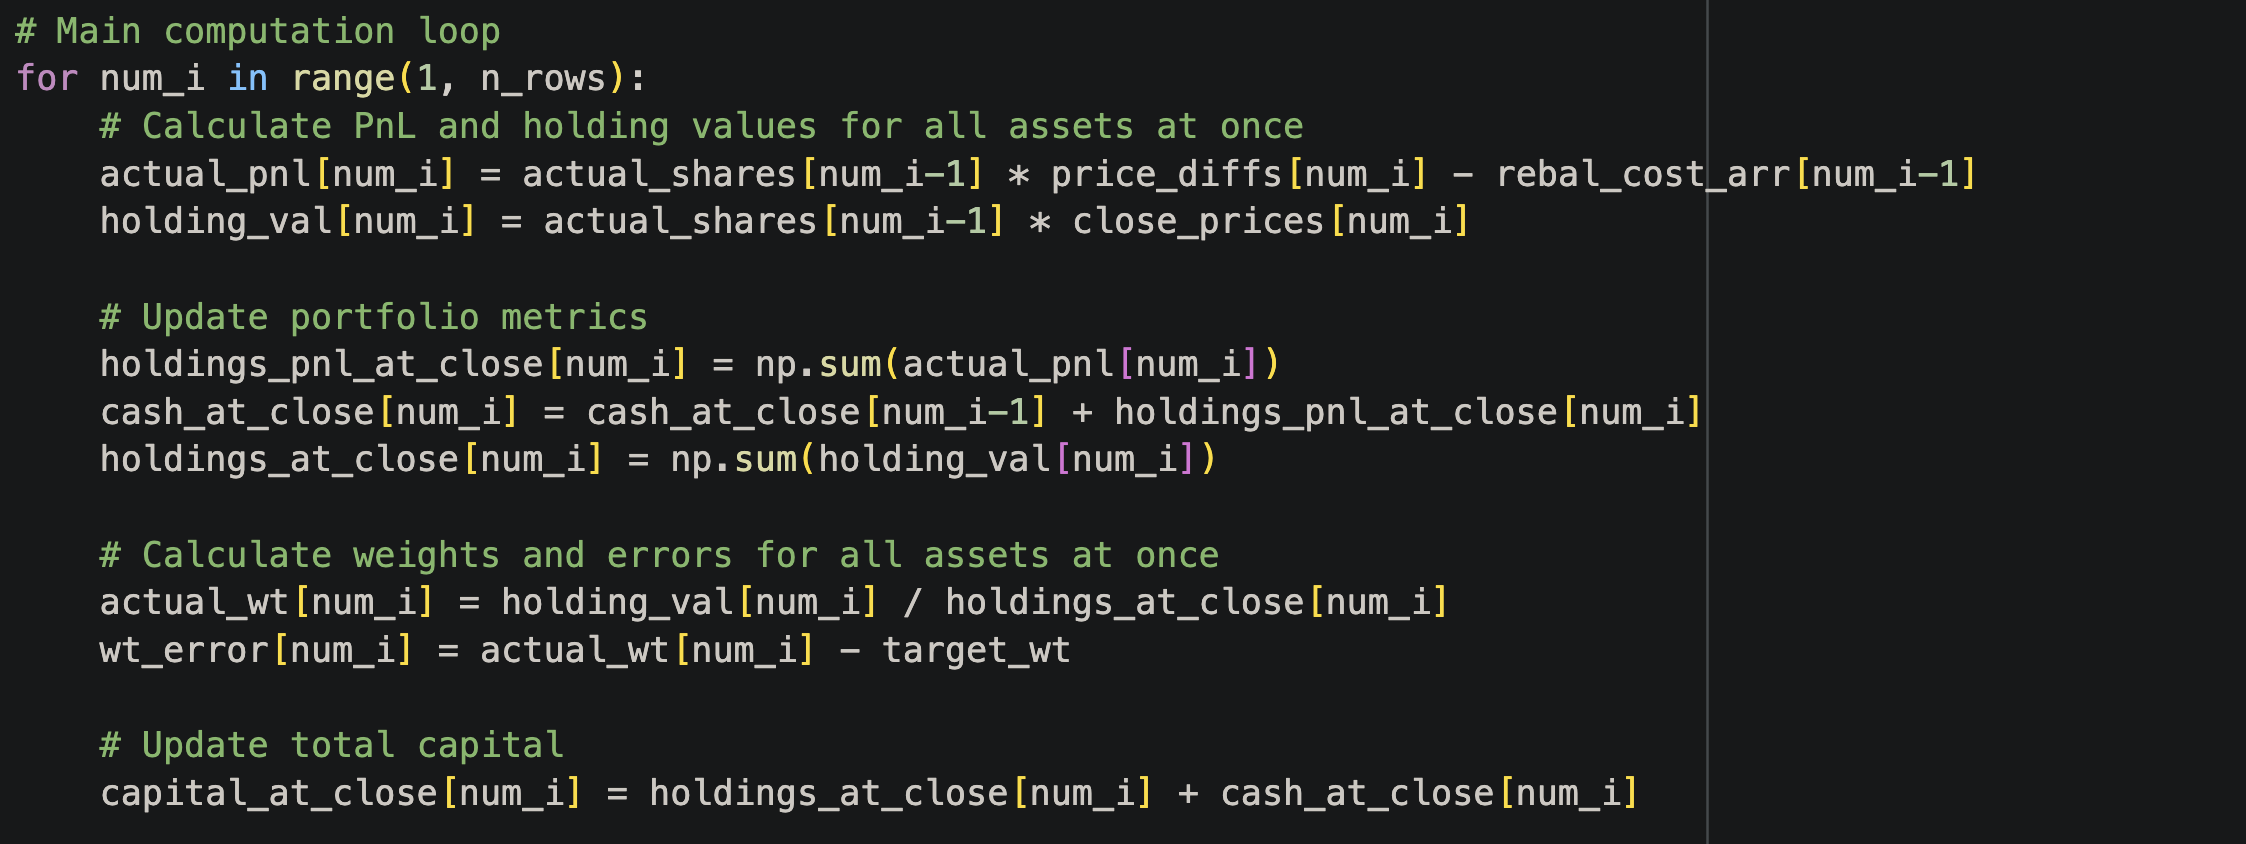
Now we start our row by row iteration. We start by finding the profits/losses delivered by each of our holdings, and the value of each of our holdings. We find the sum of all of those profits to figure out our net profit for the day. We use that to update our cash balance. That profit depends on whether there was a rebalance yesterday. If there was, we have a non-zero rebalance cost that reduces our profit.
We also find the sum of all of our holdings, so we can later figure out the weight of each of our holdings. Since we know how much cash we have and how much our holdings are worth, we can calculate the value of all of our capital as well.
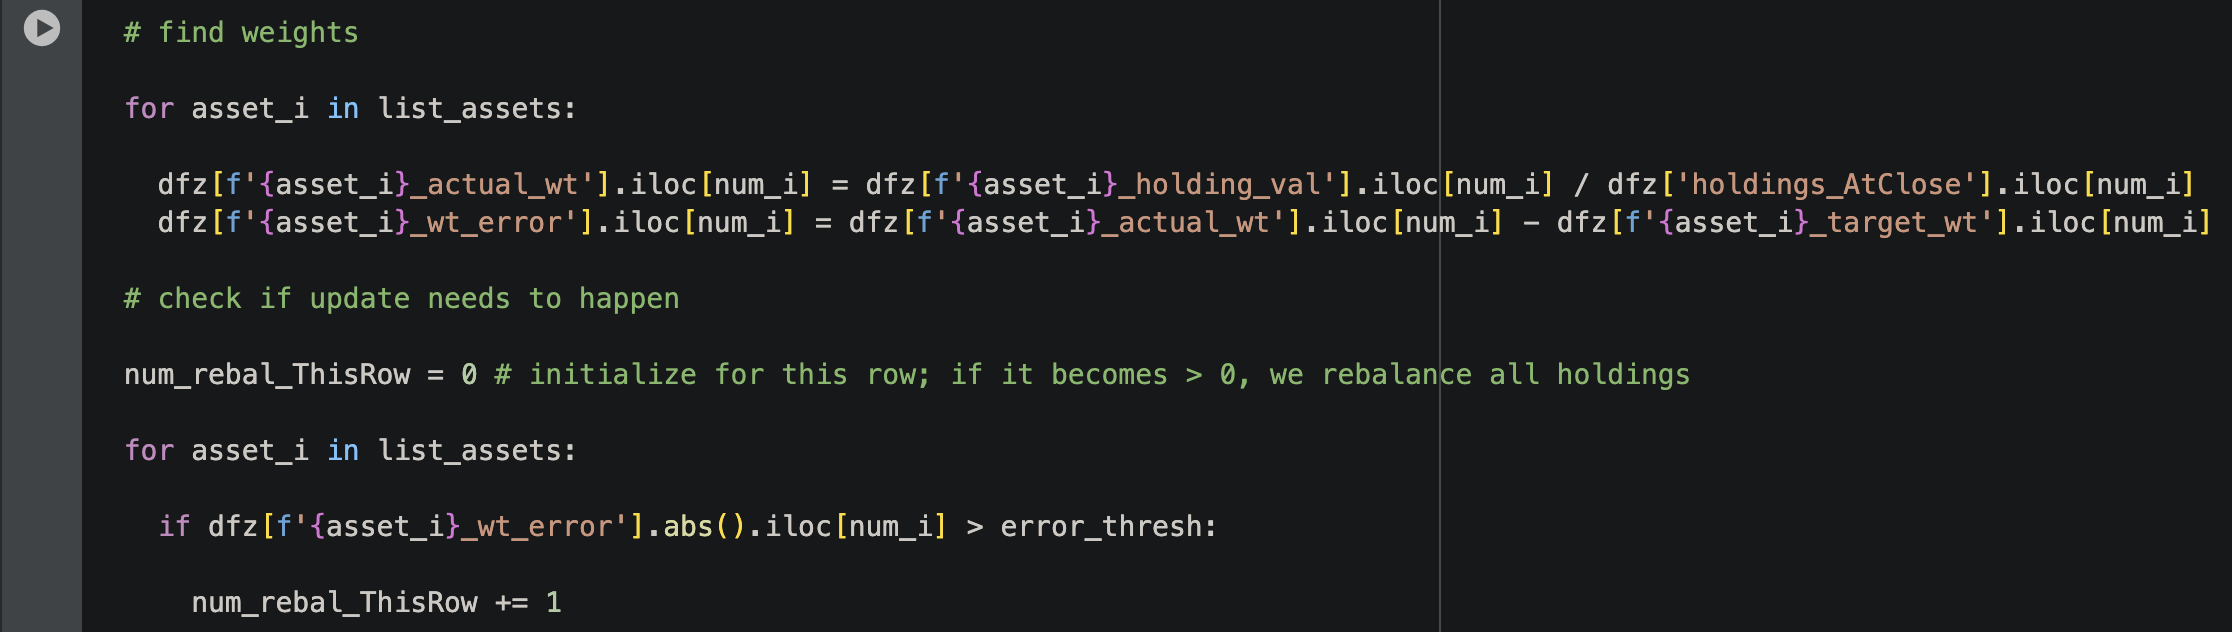
Next we find the weight of each of our stock positions and find the weight error. We also figure out if we need to rebalance at the end of this particular row (this day). If any of our positions have a weight error that exceeds our threshold, a rebalance event is triggered.
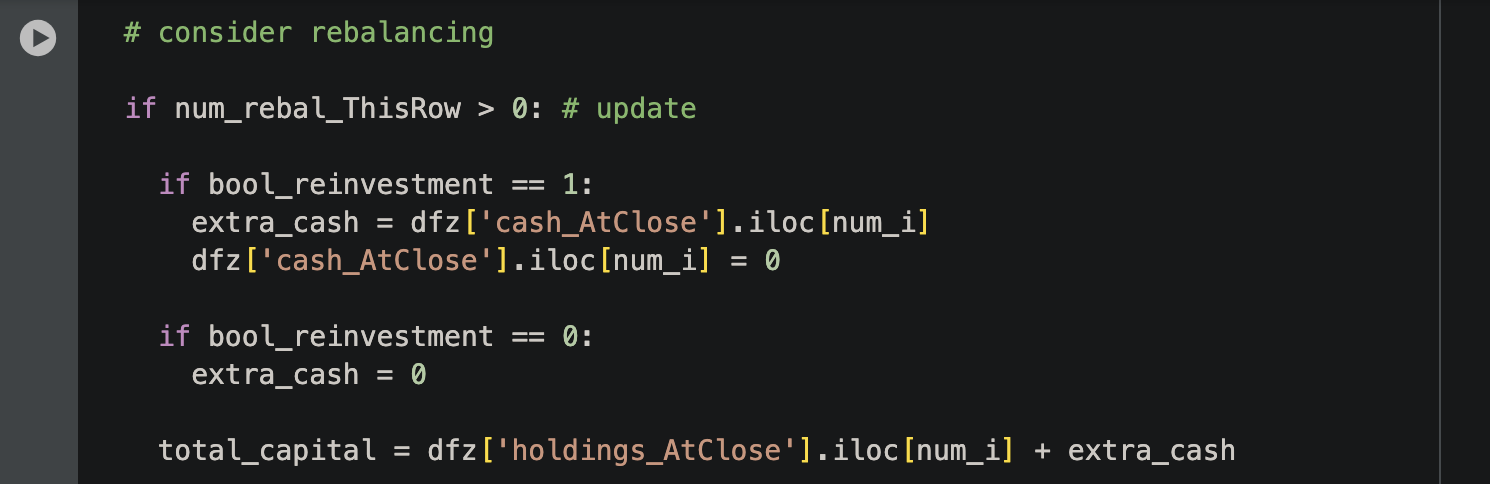
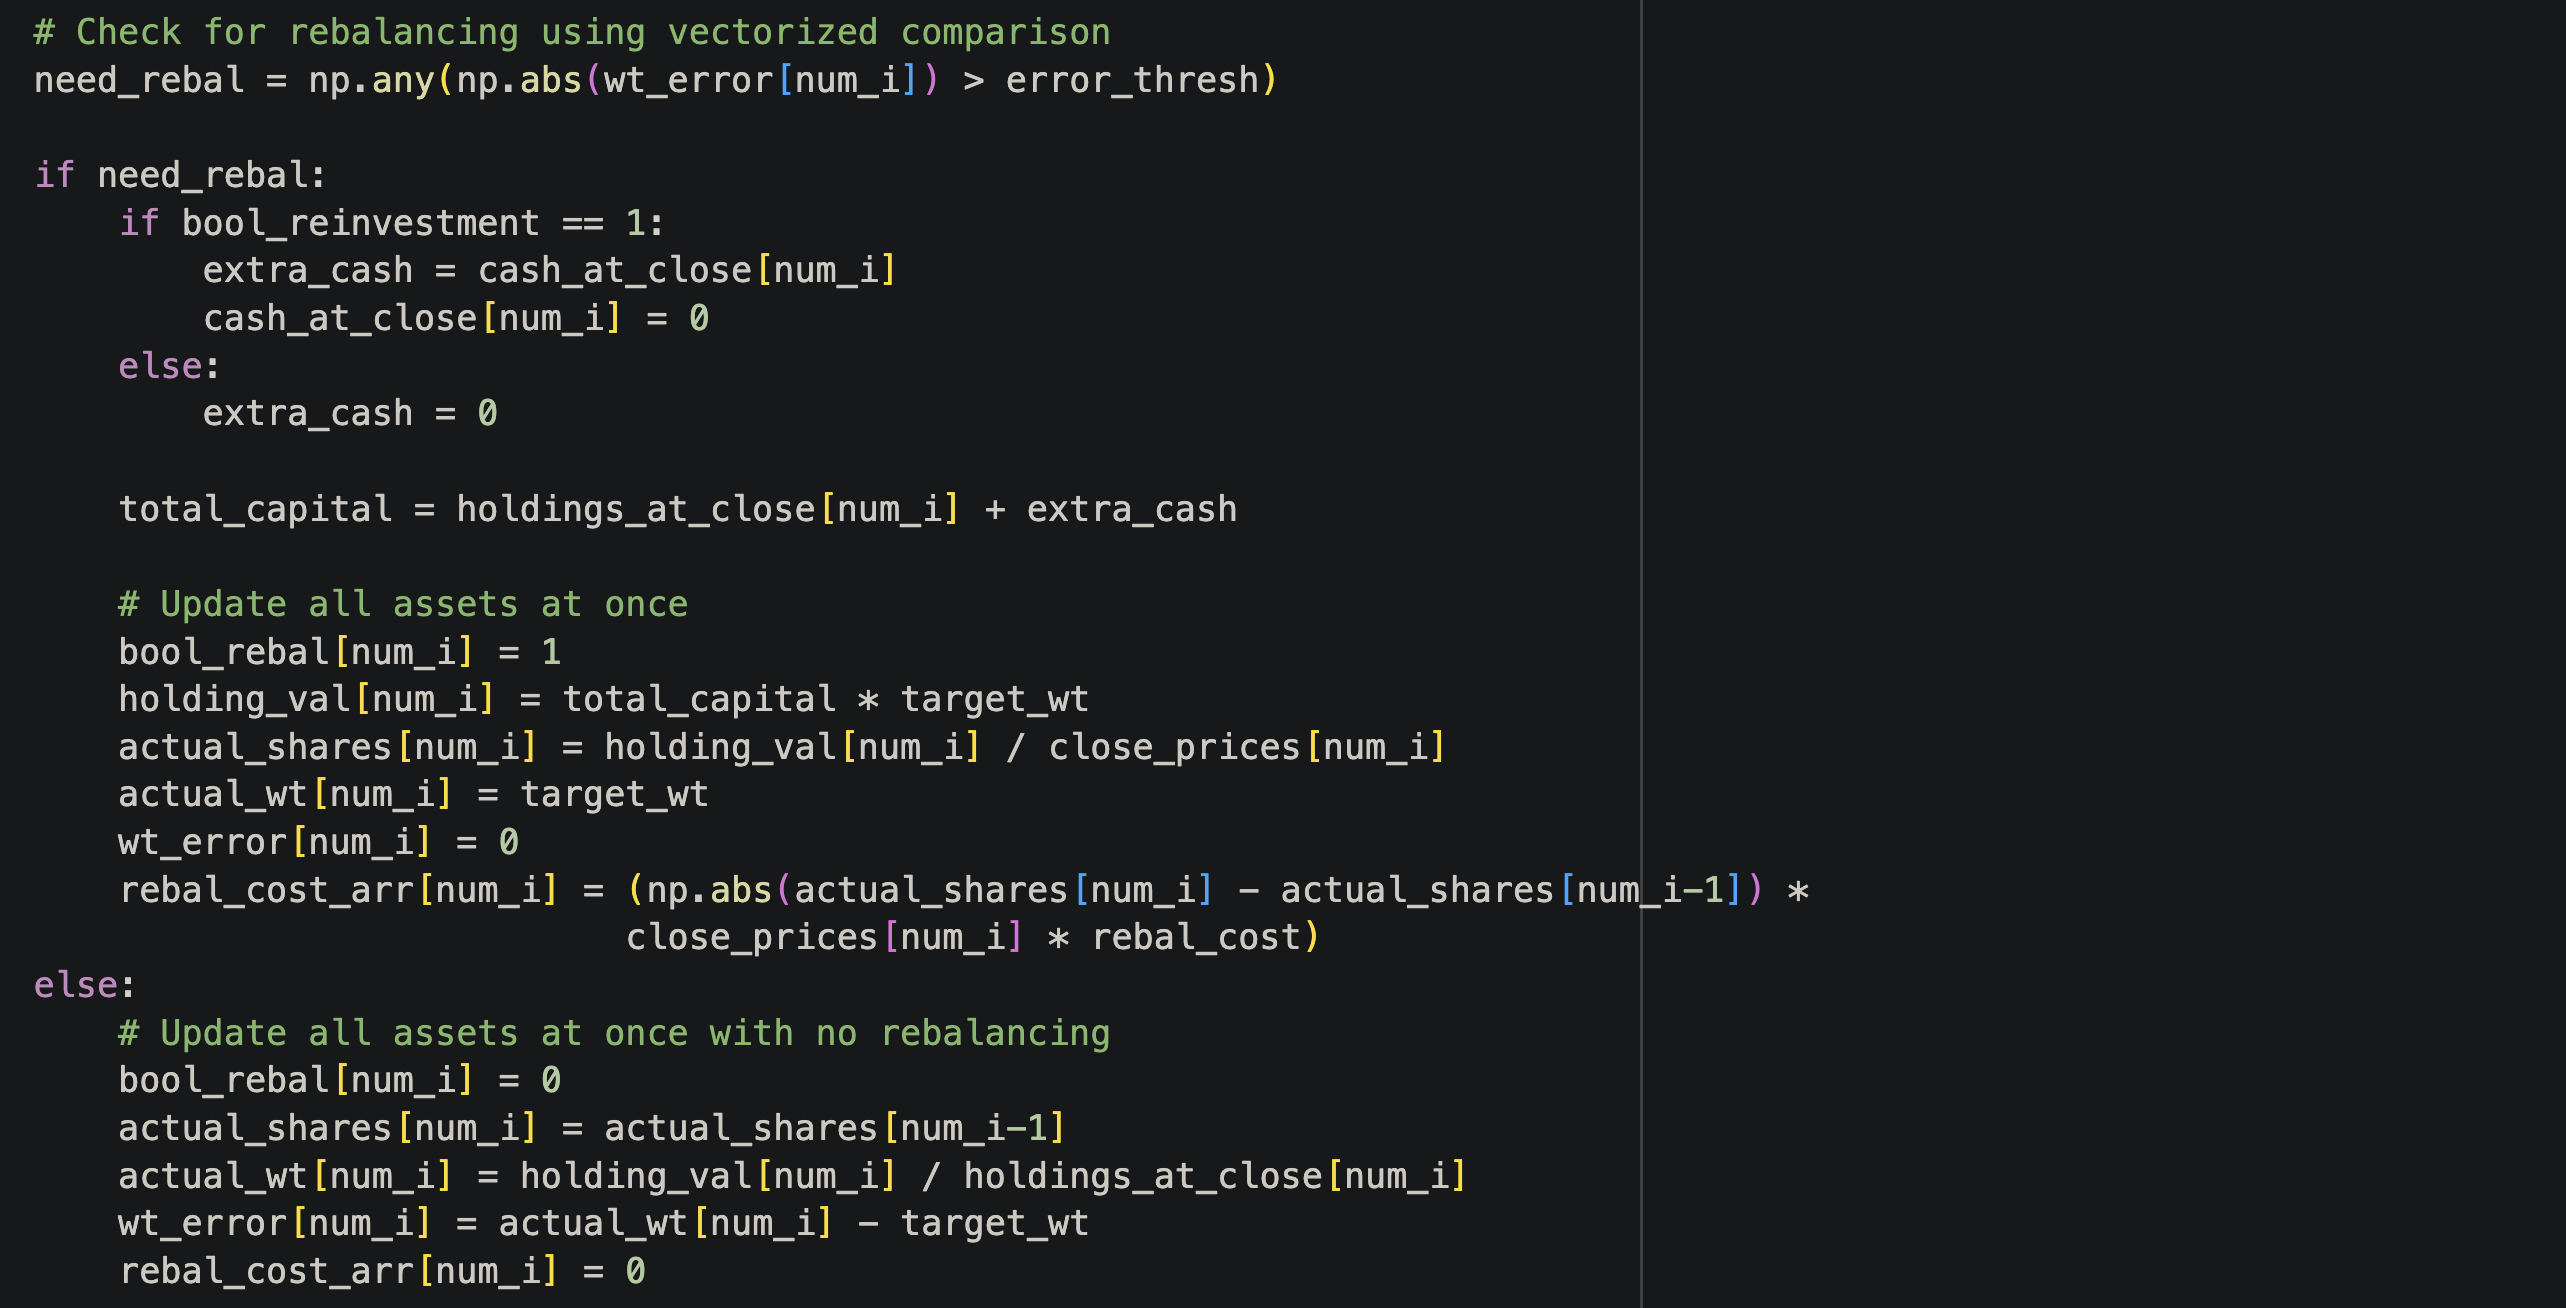
Next we consider if we need to rebalance. If so, first we need to figure out the total amount of capital we have to divide up into our stock positions. If reinvestment is allowed, this will include the profits that we have amassed (which are stored as cash).
We iterate over each stock and update our position in each. Our desired holding value for the stock equals the desired weight times our total capital. The number of shares equals the holding value divided by the close value of the stock (rebalances in this test occur at the close). To account for costs, we multiply the rebalance cost by the change in dollar value of the position. As mentioned earlier, these costs act as a drag on the profit that is experienced the next day.

Finally, if no rebalance event occurs, the logic is more simpler. For each position, our actual number of shares is the same as it was in the prior row. There is no rebalance cost.

For a dataframe with only 200 rows and 7 stocks involved, this process takes about 7 seconds. The time goes up a lot if you have hundreds of stocks and many years worth of data!
Part 3B: Faster Approach to Row by Row Portfolio Rebalancing
Let's look at how this same task can be done using numpy arrays. This part will have less explanation, but the overall functionality ends up being the same.
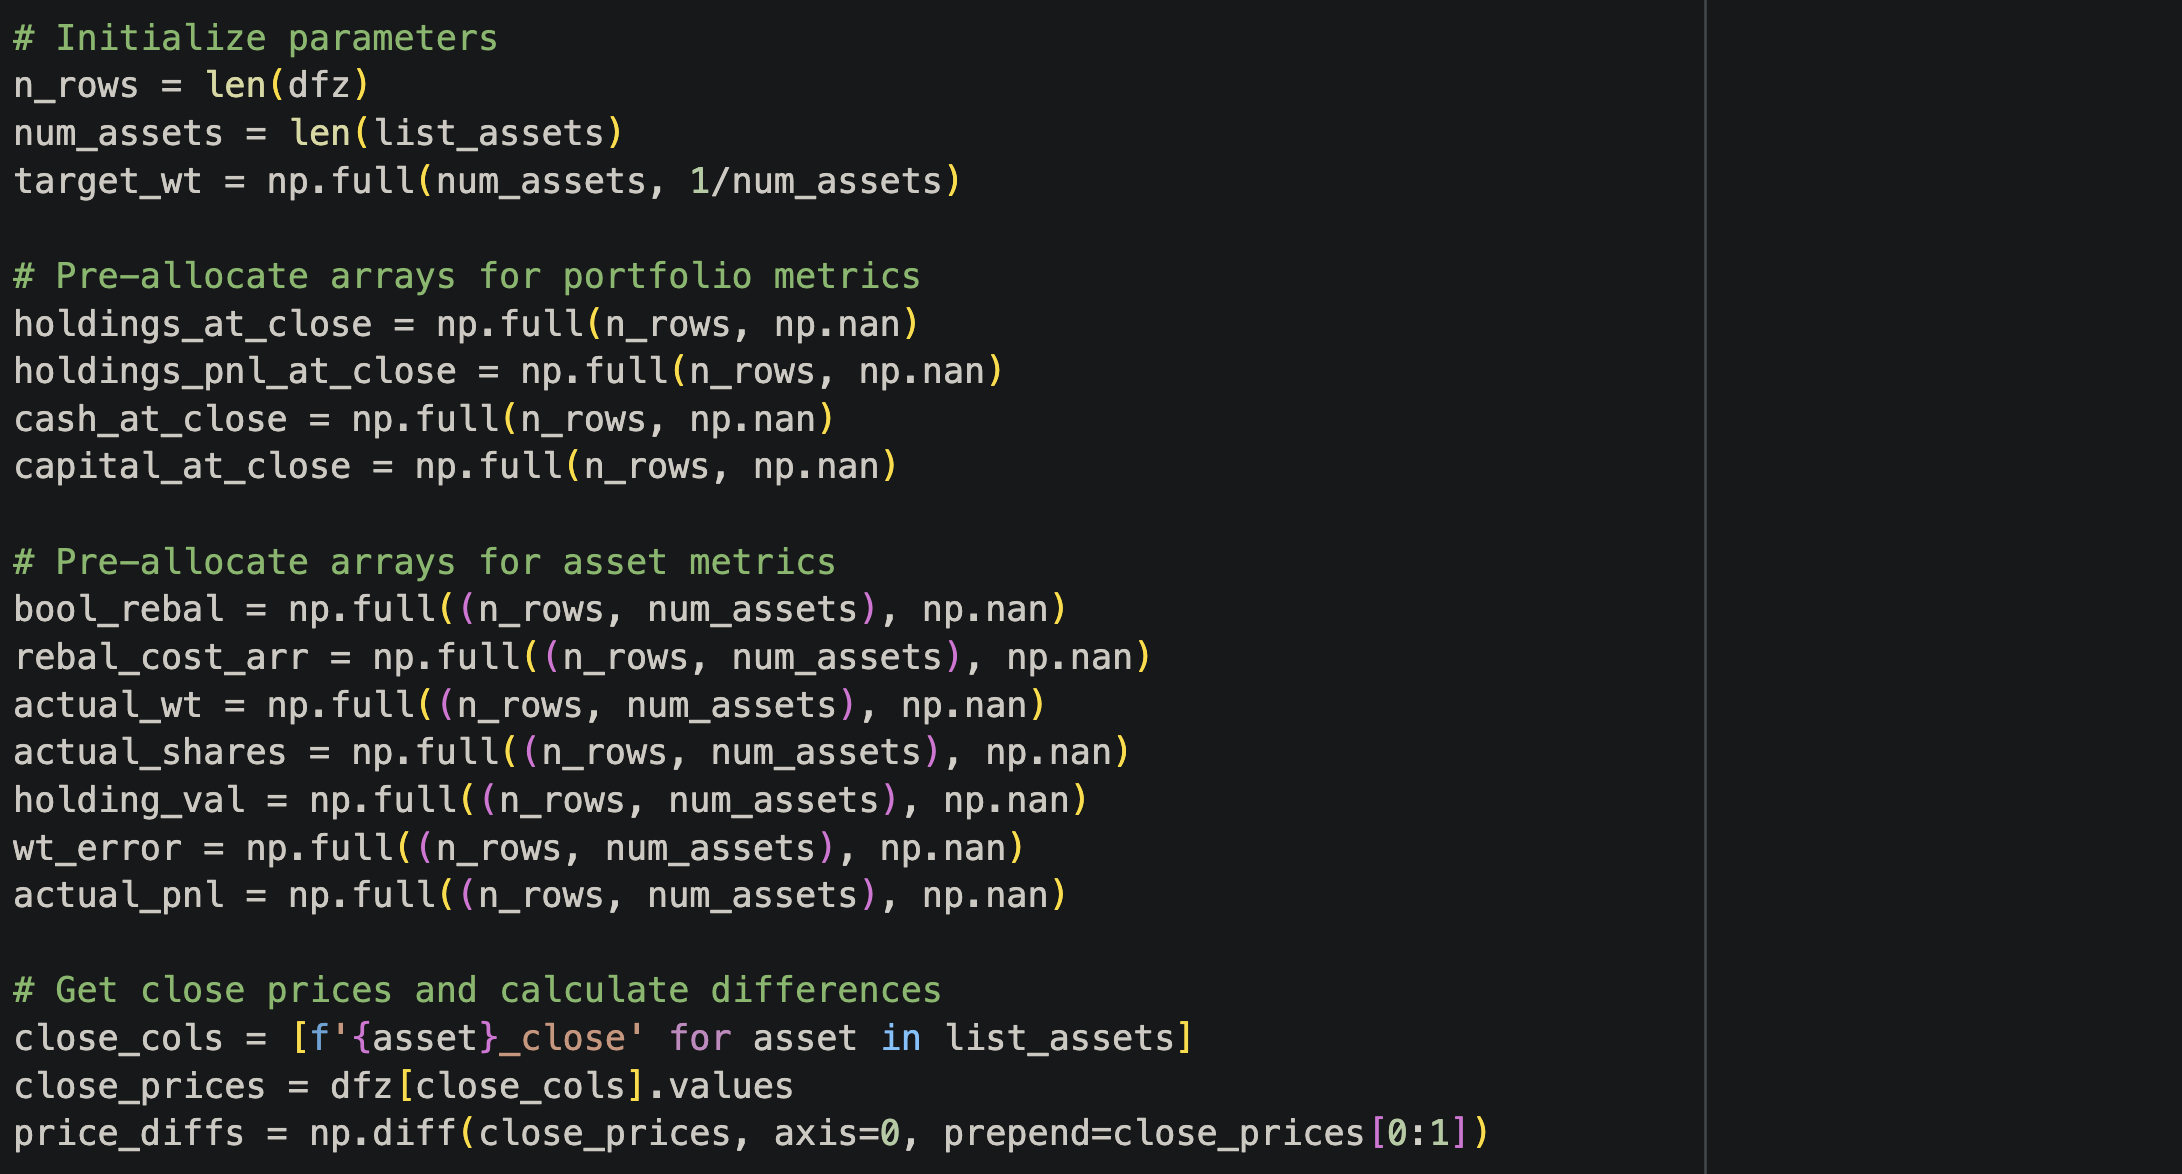
First, we pre-allocate arrays and calculate price differences.
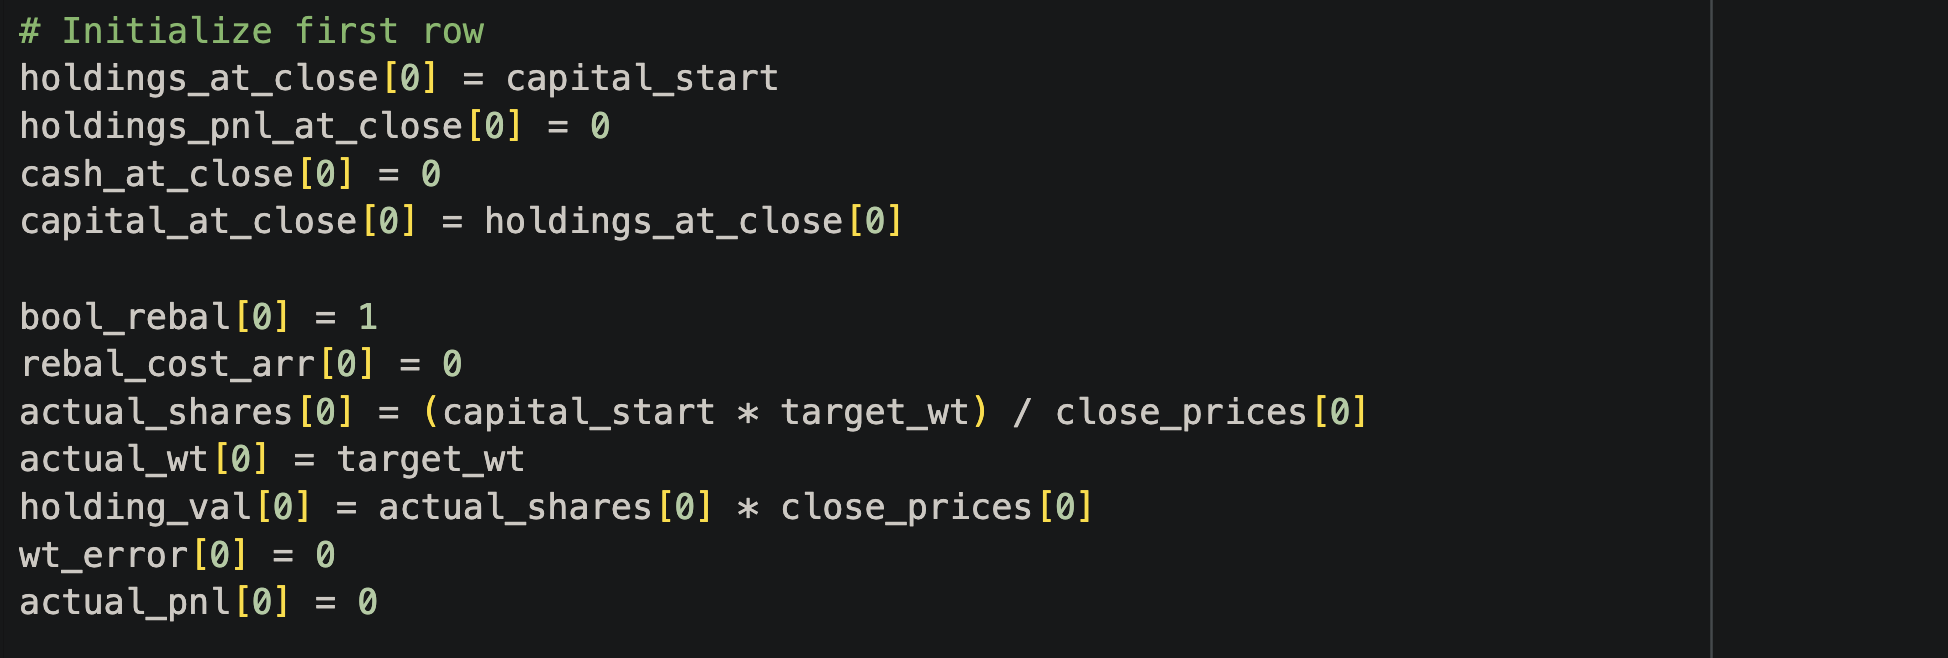
Next, we initialize values in the first row.
Now we start our row by row iteration.
In this loop, we need to consider rebalancing.
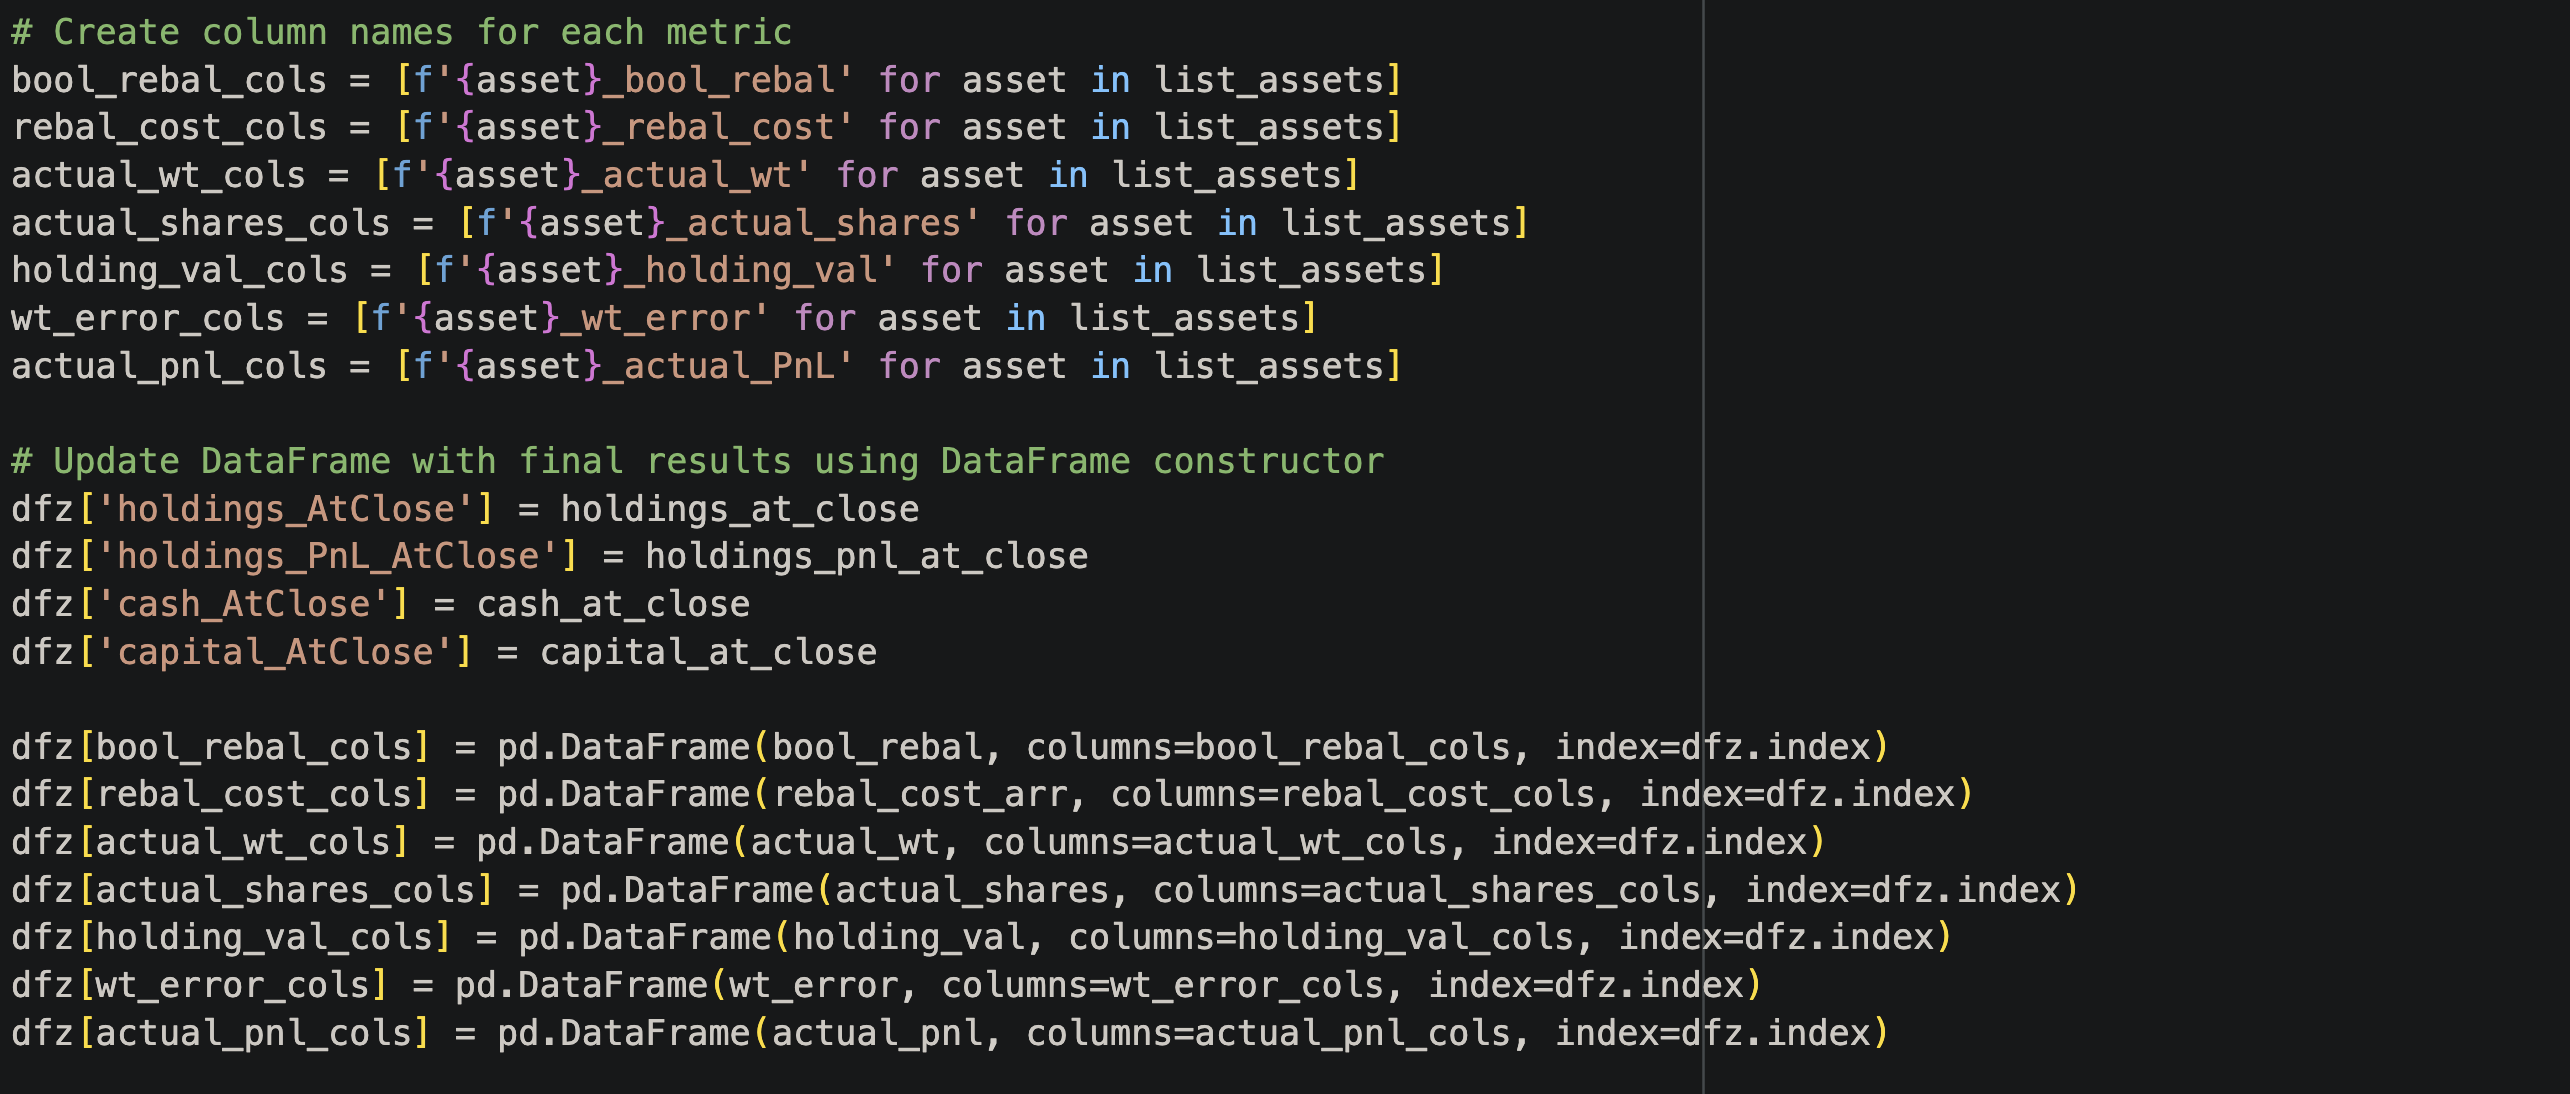
Finally, we set column names and we store our results (our numpy arrays) in our original dataframe, dfz.
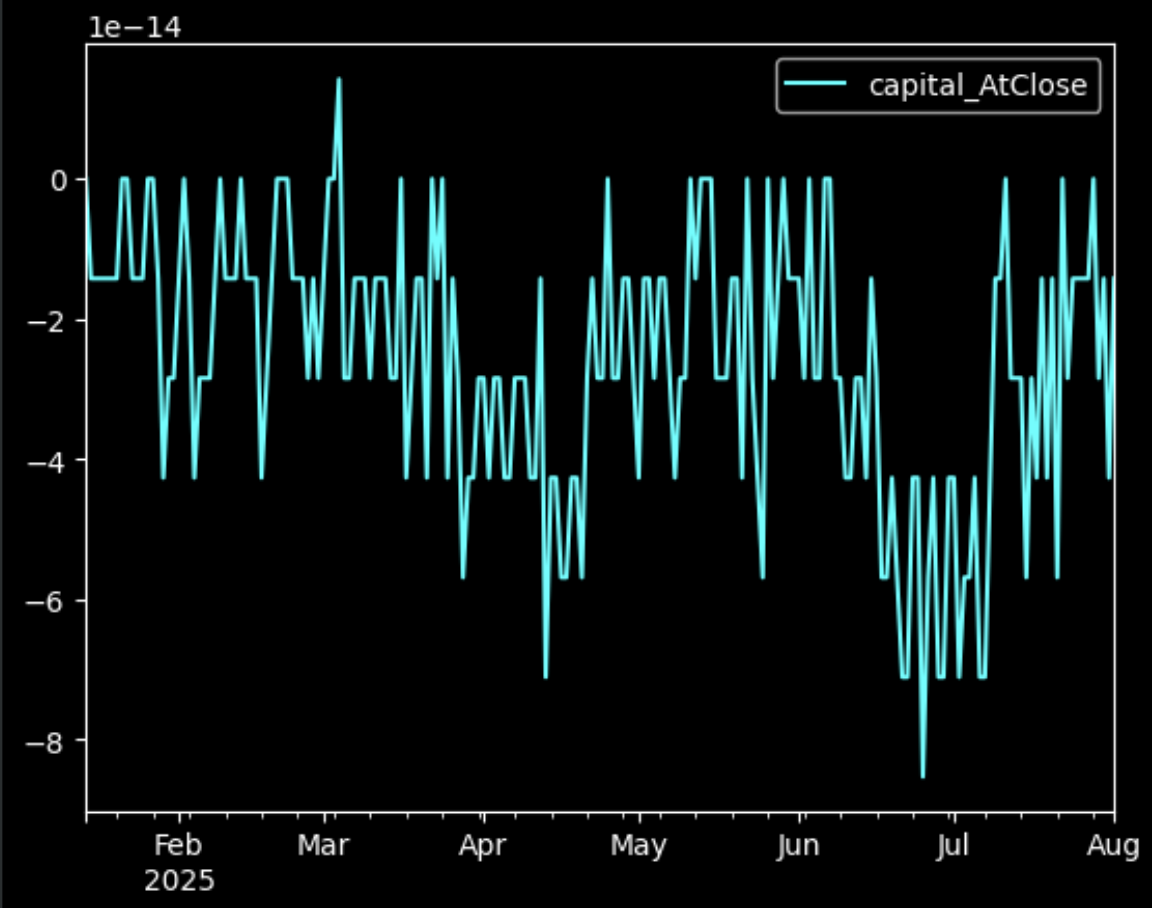
Now we can check to see if the results from the faster method match the results from the slower method. They are not identical, but they are very close!
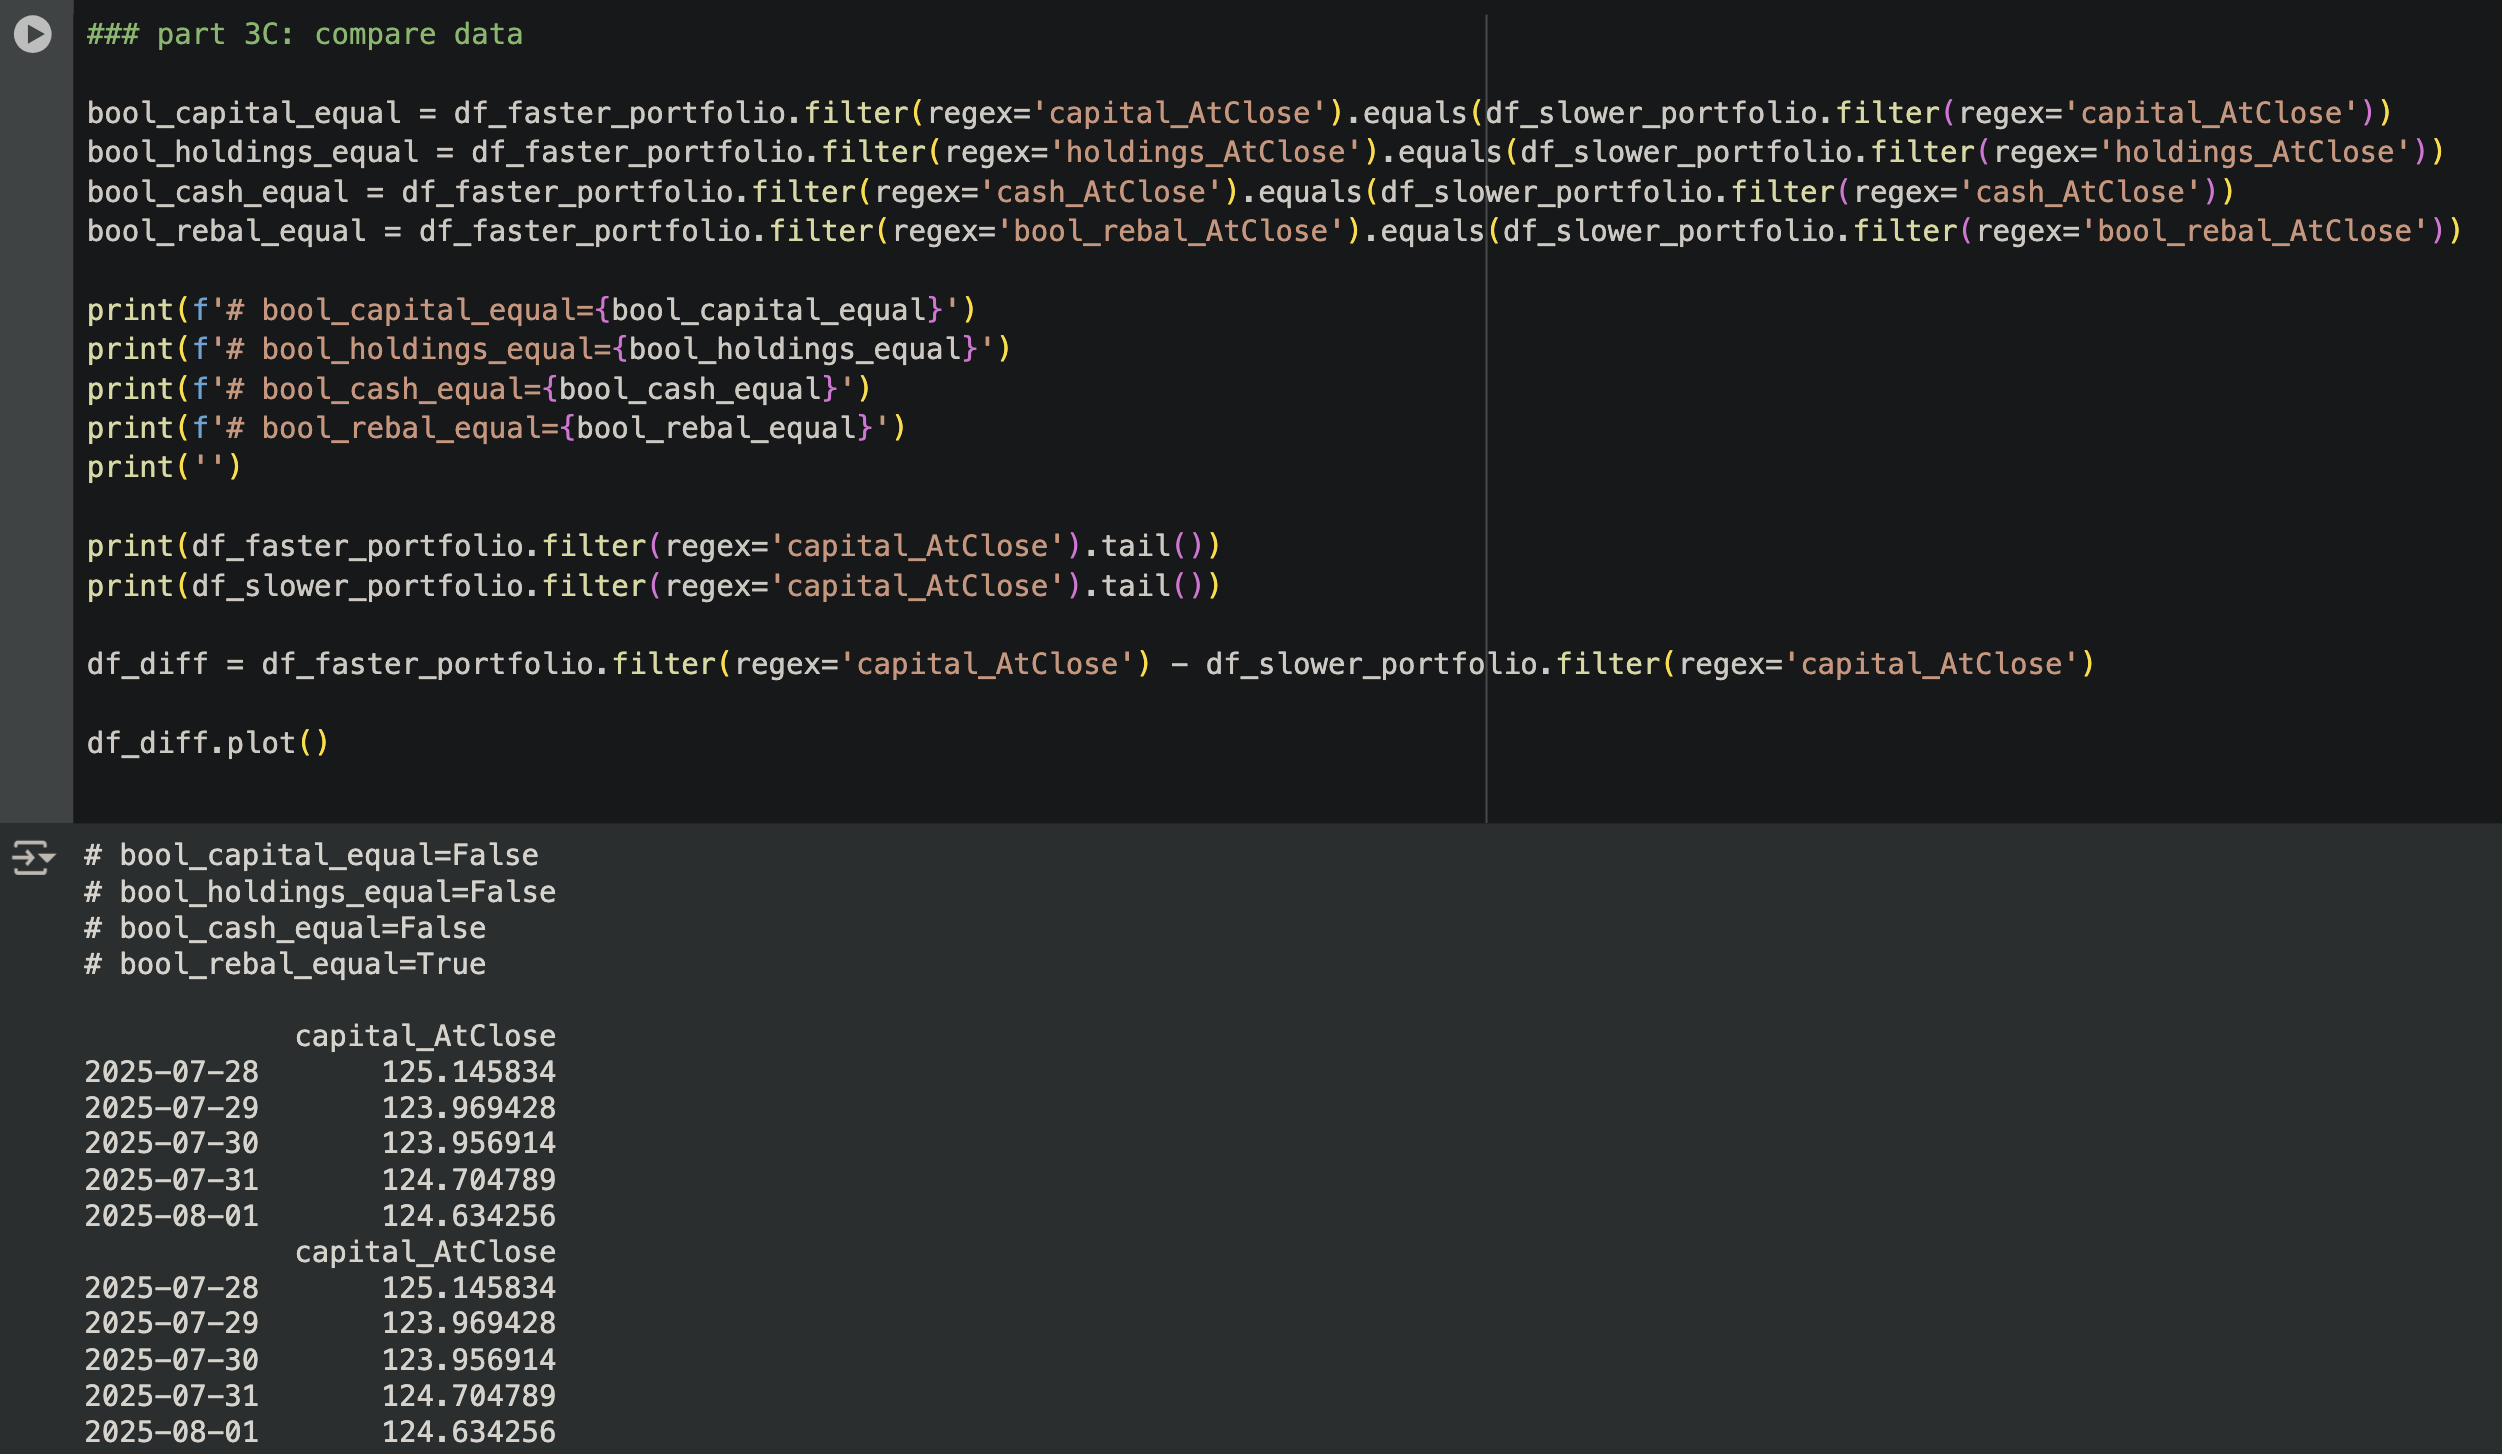
How close? When we plot the discrepancy, we see that it has a magnitude of 10^-14. That is extremely small and is due to floating-point calculation discrepancies between the two methods. For practical purposes, there is no meaningful difference in the results!
All in all, this method takes just 0.03 seconds, a massive improvement compared to the 7 seconds that the prior method takes.
Wrapping Up
When we work with pandas, we should try to handle all columns at once whenever possible. Also, we should try converting data to numpy arrays, and then converting back to a pandas dataframe.
These ideas are powerful and lead to big speed improvements!
Thank you for reading this article, and I hope it helps you write faster code! If you found this article valuable, feel free to buy me a cup of coffee!
Sincerely,
Entropy