

If you follow the lipid field, you may have seen the following graph:
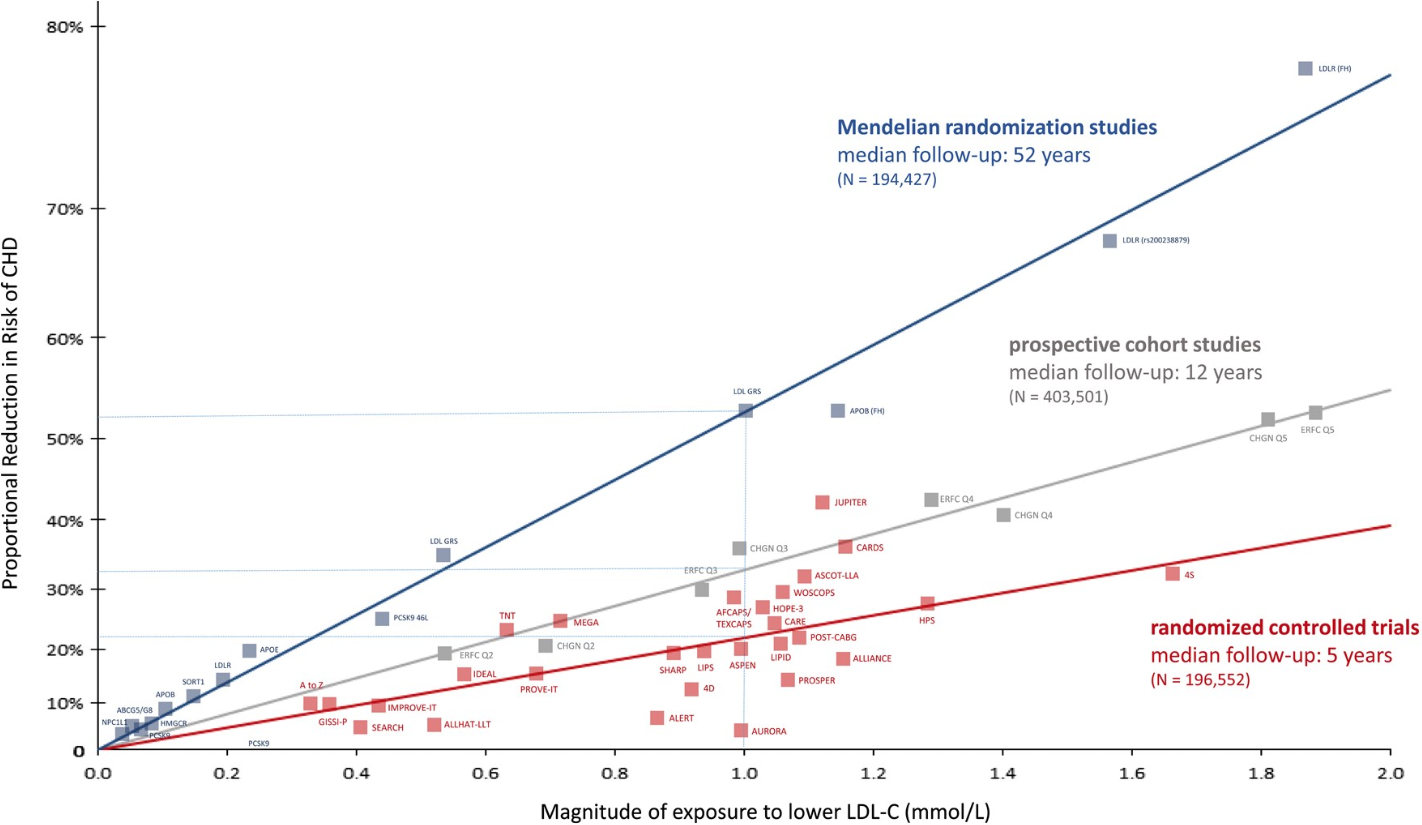 This graph, labeled Figure 2, is what Ference and colleagues (2017) used to support a dose-response relationship between LDL-C and CVD. Specifically, a log-linear relationship.
To quote:
The prospective epidemiologic studies, Mendelian randomization studies, and randomized intervention trials all demonstrate a remarkably consistent dose-dependent log-linear association between the absolute magnitude of exposure to LDL-C and the risk of ASCVD, and together demonstrate that the effect of LDL-C on the risk of ASCVD increases with increasing duration of exposure (Figure 2).
However, on the surface, it is not clear how the figure was made.
Underneath the figure, Ference et al. said they used data "as reported in meta-analyses of Mendelian randomization studies, prospective epidemiologic cohort studies, and randomized trials."
They then said:
The included meta-analyses were identified from (i) MEDLINE and EMBASE using the search terms meta-analysis, LDL, and ‘cardiovascular or coronary’; (ii) the reference lists of the identified meta-analyses; (iii) public data from GWAS consortia; and (iv) by discussion with members of the EAS Consensus Panel.
But it is not apparent which studies they used. The specific studies were not cited with the figure.
Nevertheless, after some digging, I discovered that the "Mendelian randomization" data (N = 194,427) must have come from the CARDIoGRAMplusC4D Consortium (2013) Metabochip meta-analysis. (Note the identical sample size in Table S2.)
The "prospective cohort studies" data (N = 403,510) must have come from two studies, one being the Emerging Risk Factors Collaboration (2009) (ERFC) and the other being an unknown study called the Community Health Global Network (CHGN).
And finally, the "randomized controlled trials" data (N = 196,552) must have come from the Cholesterol Treatment Trialists’ (CTT) Collaboration (2010) combined with the SHARP and IMPROVE-IT trials (28 trials in total with the corresponding sample size).
Original Meta-Regressions?
At first glance, it is easy to think that Ference et al. fitted three lines to the data points in Figure 2 by conducting regression analyses.
But this is not the case. The paper does not mention original meta-analyses or statistics to show that such analyses were done.
Instead, they created Figure 2 for illustrative purposes: To summarize alleged log-linear relationships between LDL and CVD based on previous meta-analyses.
The red trial squares, for instance, serve no real purpose, because the dose-response line is directly based on the CTT 2010 meta-analysis. Indeed, in the text, Ference et al. cited the CTT, highlighted the 22% proportional CVD reduction per mmol/L lower LDL, then referred to the same result in Figure 2.
Because Ference et al. believe that randomized controlled trials are perhaps the "most compelling clinical evidence for causality," we will start with the CTT trial analysis represented by the red dose-response line.
The CTT Paper
It is clear that Ference et al. think highly of the CTT 2010 analysis. After all, they cited the paper at least nine times and used its data for Figure 2 (trial estimate), their duration model, and other quantitative statements.
However, Abramson et al. (2017) noted that the “major vascular events” endpoint — the same one Ference et al. used — was not prespecified:
First, “major vascular events” (a composite of coronary deaths or myocardial infarctions, strokes, and coronary revascularisation procedures) is twice prohibited by the CTT’s 1995 protocol: it was not a prespecified endpoint, and the CTT meta-analysis applied it to data that had already been unblinded. About a third of the events in this combined endpoint are revascularisation procedures, the frequency of which can be influenced by patients’ LDL levels—which are lower in patients treated with statins than in those treated with placebo— that effectively unblind treatment allocation and affect diagnostic and treatment decisions. In the 1995 CTT protocol, total mortality was the first main question to be addressed. Thus, any discussion of “major vascular events” as an endpoint in CTT meta-analyses must be identified as post-hoc and hypothesis-generating only. [bold emphasis added]
The CTT analysis has also been criticized for other issues, including (Simpson, 2012; Thornley, 2014; Mayer, 2024):
(1) Application of an inappropriate adjustment to the data, which effectively assumed a log-linear relationship between LDL and CVD.
(2) The analyses assumed that reductions in LDL are fully responsible for the alleged benefits of statins (i.e., no pleiotropic effects).
(3) Despite having individual-participant data, the dose-response analyses (per mmol/L LDL reduction) were based on aggregated trial-level data prone to biases (i.e., aggregation bias and confounding).
Thus, contrary to what Ference et al. claimed and what Figure 2 pretends to illustrate, the CTT did not establish a log-linear relationship with its "per millimole per litre reduction in LDL-C" analysis. Rather, the statistical analysis assumed, without sufficient justification, that the effectiveness of statins scales with the degree of LDL reduction.
To be clear: This approach to meta-analysis is not accepted by many researchers, and it would be circular reasoning to use it as support for a log-linear relationship.
As Dr. Jim Wright said in a presentation:
As Coordinating Editor of the Cochrane hypertension group, we would never accept a meta-analysis that made an adjustment.
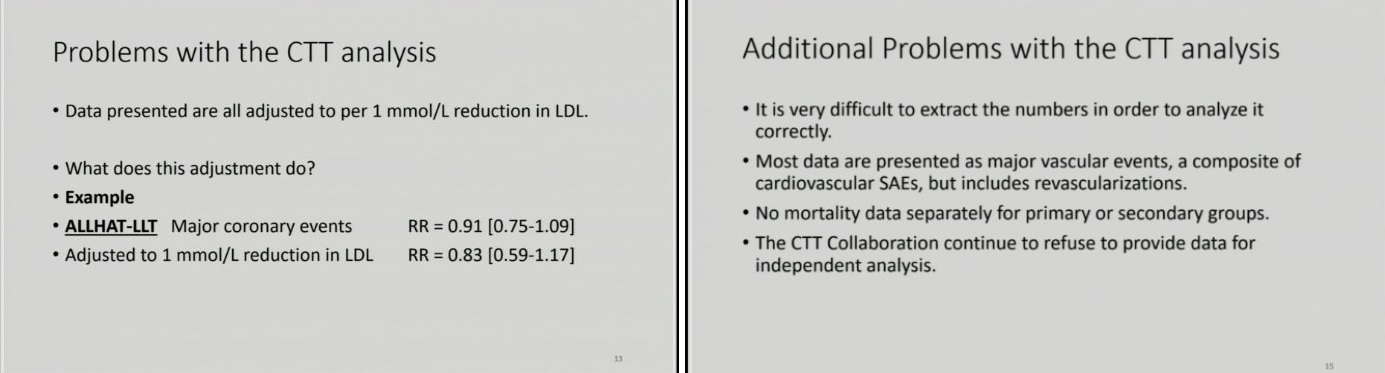 (Image: Taken from Wright's presentation. An RR adjusted to a 1 mmol/L LDL reduction is an assumption-based estimate)
So Ference et al. presented the CTT result (the red dose-response line) as a "randomized controlled trial" analysis when, according to its method (standardized per mmol/L LDL reduction), it is better described as a model-dependent observational analysis.
To quote the excellent discussion from Battaggia, Scalisi, & Donzelli, 2018:
The log-linear hypothesis about the relationship between LDL-C changes and CV risk was postulated by CTT since 2005; all CTT analyses of individual data were so expressed as risk ratio of events for every change of 1 mmol/L of LDL-C.
This procedure was criticized. In fact, forcing the efficacy results towards a relationship defined ex ante between clinical efficacy and LDL-C lowering can introduce a strong observational component and a possible confounding effect in an experimental approach (as is a meta-analysis of RCTs). Most of the RCTs included by CTTC were powered to demonstrate the efficacy of drugs, not the efficacy of changes in LDL-C levels. A meta-analysis of RCTs constitutes an experimental approach only if it respects the statistical integrity of each trial, since each trial is powered to investigate a common and specific hypothesis. So, attributing ex ante the clinical efficacy of statins not only to drugs per se, but also and mostly to their efficacy on LDL-C levels, is not an experimental demonstration, but an observational interpretation of experimental results. . . .
Unfortunately, the CTTC dataset is not available to external observers, who could verify the strength of their conclusions through alternative analytical approaches.
Battaggia, Scalisi, and Donzelli are correct on every point.
Additionally, they noted that "in many analyses the association between LDL-C and major clinical endpoints seems far from log-linear."
Which is also correct.
Most trial analyses, in fact, have contradicted a log-linear relationship between LDL and CVD, including those from WOSCOPS, CARE, PROSPER, AURORA, MEGA, CARDS, SHARP, LIPID, SPARCL, LRC-CPPT, VA-HIT, and so on (discussed here and here).
For example, if a log-linear relationship truly existed, those with a larger LDL response to the same statin dose should get larger benefits (greater relative risk reductions) when compared with their properly matched controls. But this was not the case in the largest statin trial:
In the HPS, all participants received 40 mg of simvastatin (the study drug) before randomization and investigators measured each participant's biological response to statin therapy. This allowed a true experimental subgroup analysis. By giving all study participants a brief trial of 40 mg of simvastatin before randomization, investigators were able to match control and intervention participants according to their response to statin therapy. Contrary to the LDL log-linear hypothesis (which would suggest that those who have a larger LDL cholesterol response from a given statin dose would receive greater benefit), those with the worst prerandomization LDL response (<38% reduction in LDL cholesterol level) received the same benefit as those with the best LDL response (>48% reduction in LDL cholesterol level). [Hayward, Hofer, and Vijan, 2006]
Likewise, if a log-linear relationship truly existed, those with lower achieved LDL levels should have lower CVD event rates on the same statin dose adjusting for multiple variables. But again, this was not the case:
The major findings of the present study were as follows: (1) very low on-treatment LDL-C level (<70 mg/dL) was not associated with lower cardiovascular event risk compared with moderately low on-treatment LDL-C level (70–100 mg/dL) in patients receiving the same doses of statins; (2) high LDL-C (≥100 mg/dL) was not associated with higher cardiovascular event risk compared with a moderately low LDL-C level (70–100 mg/dL) in the pitavastatin 1 mg/day stratum. [Toyota et al., 2023]
The CTT and Mortality Outcomes
Although it is not apparent, the CTT dose-response analysis for LDL is equivalent to a fixed-effect meta-regression through the origin, which is at odds with the best meta-regression practices.
Because of this, the CTT method might produce flawed results, perhaps best seen when we examine mortality outcomes.
For example, if you read the CTT paper, you may notice that they claimed a log-linear relationship between LDL and all-cause mortality (their first prespecified endpoint), stating that "across all 26 trials, all-cause mortality was reduced by 10% per 1.0 mmol/L LDL reduction."
But, given that (1) there is no biologically plausible reason for log-linearity, (2) virtually all other analyses (see here and here) have failed to find a log-linear relationship between LDL and all-cause mortality, and (3) a meta-regression can produce a linear plot even when the true effect is nonlinear in every population, it is likely that the CTT result is an artifact of the statistical analysis.
Out of curiosity, I also conducted a meta-regression on CHD mortality — CTT's second primary endpoint — using the major nonstatin double-blinded trials that had published LDL data (mostly fibrates, PCSK9i, niacin, CETPi, ezetimibe, bempedoic acid, resins, and hormone therapy). The results showed that absolute reductions in LDL were not associated with reductions in CHD mortality:
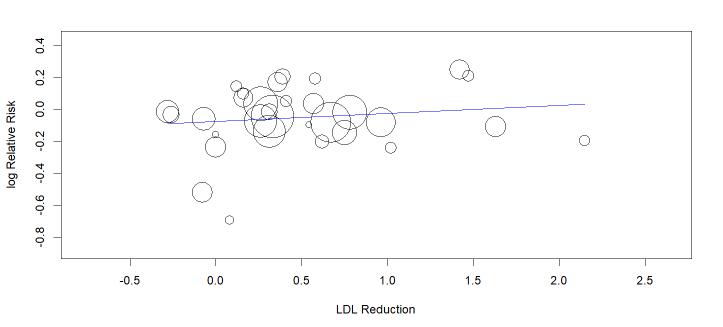 (Image: It is often overlooked that the CTT originally planned to assess nonstatins along with statins, specifically fibrate and dietary interventions. However, there is no evidence of an association between LDL reductions and CHD mortality across those trials or the broader data)
And to confirm with different software:
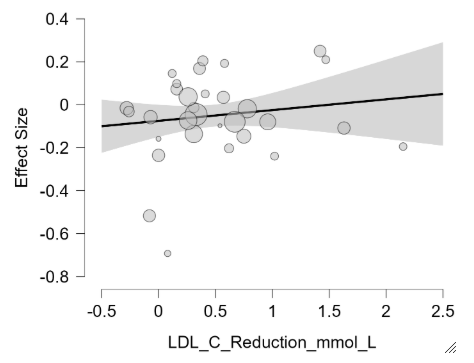 (Image: This represents a statistically nonsignificant 5% increase in CHD mortality per mmol/L LDL reduction)
Importantly, this result held regardless of inference method, measure of effect, drug class, or whether it was adjusted for trial duration. There were also no significant differences in leave-one-out analyses.
Conclusions on the CTT
Taken together: the post-hoc endpoint, the weak methods prone to biases, the unjustified model assumptions, the lack of power to assess nonlinearity, the mass of contradictory data, and the lack of independent verification, we must conclude that the CTT analysis did not and could not support a log-linear relationship between LDL and CVD.
Of course, the fact that the CTT data are unavailable for independent analysis is, by itself, a major red flag. As the 2016 statin debacle showed, the corrupt CTT group has a vested interest in promoting statin use. (Also see Abramson 2021 or 2025, who was directly involved, or Demasi 2018 and Kendrick 2026 for further discussion.)
The Prospective Cohort Studies
I noted at the beginning that the prospective cohort studies Ference et al. used for Figure 2 apparently came from two studies: The Emerging Risk Factors Collaboration (2009) (ERFC) and the unknown and unanalyzable Community Health Global Network.
The ERFC analysis, however, did not unequivocally support the strict log-linear relationship that Ference et al. showed in Figure 2. Instead, the authors reported an "approximate" log-linear relationship between non-HDL-C and CHD and actually left open the possibility that the relationship was attenuated at lower non-HDL-C levels.
Figure 1 of the ERFC, for instance, suggests a relatively flat relationship between the first two quantiles of non-HDL-C (about 118 vs. 132 mg/dL), which is at odds with a log-linear relationship but consistent with either flexible modelling analyses (e.g., Figure 3 of Zeng et al. 2022) or analyses that found no relationship:
We examined several combinations of lipid markers in the present study and found that only TC/HDL but not TC, HDLC, or non-HDLC, was a significant predictor of CHD death (Li et al., 2021).
Of note, the ERFC also reported approximate log-linear relationships between HDL-C or CRP concentrations and CHD, both of which are regarded as possible noncausal relationships. Indeed, a main author of the ERFC admitted that "even analyses in the ERFC . . . are limited in their ability to judge causality." [Angelantonio & Cohen, 2010]
Nevertheless, observational cohorts much larger than the ERFC, with enough statistical power to assess the full range of LDL values, have confirmed that the relationships between LDL and clinical outcomes are not log-linear (Yi et al., 2022):
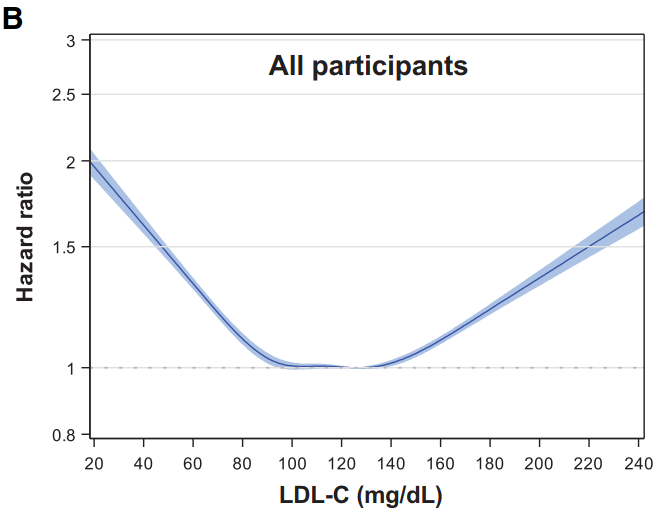 (Image: A U-shaped relationship between LDL and CVD mortality. Based on almost 15 million individuals, around 94,000 CVD deaths, and approximately 131 million person-years of follow-up)
Or, take the Global Cardiovascular Risk Consortium (2023), probably the largest individual-participant analysis to date (112 cohorts and over 80,000 CVD events). Based on flexible modelling, there was no evidence of a log-linear relationship, and the authors explicitly stated that non-HDL-C has a "J-shaped pattern" with CVD.
Or again, as a more recent example, here are the splines (flexible modelling) from a cohort study showing neither linear nor log-linear relationships between LDL and CHD mortality or all-cause mortality:
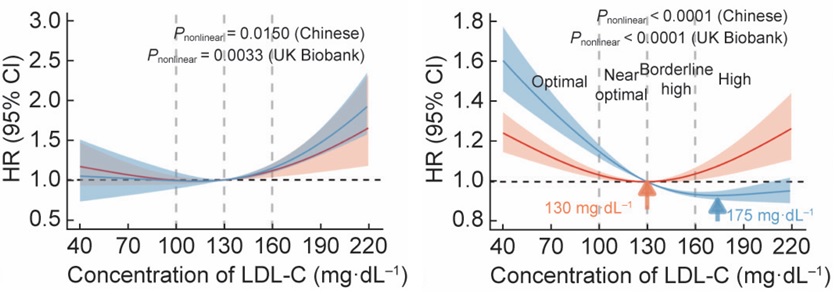 (Image: The left figure is CHD mortality, and the right figure is all-cause mortality.)
As explained in my two-part critique of Silverman et al., a review that Ference et al. cite, there are many observational analyses, including meta-regressions and cohorts, showing that the relationships between LDL and CVD events, CVD mortality, and total mortality are neither linear nor log-linear — similar to countless analyses on atherosclerosis.
On top of these, I have also recently highlighted two reviews by independent investigators showing that LDL does not qualify as a valid surrogate marker. Contrary to the impression Ference et al. give, LDL is not a reliable predictor of CVD or mortality outcomes, even with methods that assume linear or log-linear relationships.
Mendelian Randomization
Ference et al. claimed that observational genetic epidemiology, so-called Mendelian randomization (MR), examines "whether an observed association between an exposure and an outcome is likely to be causal."
This is false.
First, let us get one fact out of the way: MR itself cannot prove causation. That much is even admitted by advocates of the method. And it is an oversimplification to claim that MR provides stronger evidence than traditional observational studies.
Nor could MR provide empirical evidence for the shape of the relationship (i.e., the alleged log-linear relationship).
The reason for this is that MR relies on strong (unverifiable) assumptions, including additional implausible assumptions for estimation.
As VanderWeele et al. (2014) wrote:
The assumptions required for Mendelian randomization are strong, whether for estimation or for testing. . . . In using instrumental variable methods, it can seem that the sophistication of the analysis somehow produces the conclusion, whereas in fact, it is relying on assumptions—and even stronger assumptions for estimation.
And Schooling, Yeung, & Freeman (2013) in reply to Ference:
Mendelian randomization estimates should be interpreted as hypothesis testing, that is, able to disprove a postulated causal effect, rather than indicating the size or existence of a postulated causal effect.
In general, MR assumes linear relationships, and nonlinear methods remain controversial. Lu et al. (2024), citing a genetic study by Ference, noted that "these analyses were performed based on the assumption that LDL-C levels are linearly associated with the risk of cardiovascular events."
Also, keep in mind that Ference et al. are using LDL-C as a proxy for LDL particles. On multiple occasions, Ference has stated, in no uncertain terms, that MR has demonstrated that the number of LDL particles (estimated by apoB) determines CVD risk, not the cholesterol content carried by those particles (LDL-C).
Yet, this view has been disputed by other MR authors, including genetic experts, who claimed that apoB had "no independent effect beyond LDL cholesterol," and that risk is "better explained by non-HDL-C than particle concentration" (Helgadottir et al., 2022; Holm, 2023; Ding et al., 2025).
It is, of course, not possible with MR to determine who is right, or indeed, whether both are wrong. The experimental or mechanistic evidence must decide, not statistical-based methods with dubious assumptions.
Moreover, because MR studies have found associations between LDL-C and CVD, Ference's claim that LDL-C is a proxy for LDL particles (the latter proposed as the true cause) is itself an admission that MR can produce spurious associations.
So perhaps Ference et al. should take the advice from one of their own members, who noted that "(1) no scientific method is infallible; and (2) circumspection and vigilance are needed when interpreting MR data." (Credit to a reader, Clint O'Meley, for noticing the connection.)
The Duration Claim
Referring to Figure 2, Ference et al. claimed that the effect of LDL on CVD risk "increases with increasing duration of exposure."
So, for example, a 1 mmol/L lower LDL for 12 years would give a greater relative risk reduction than a 1 mmol/L lower LDL reduction for 5 years (30% vs. 22% risk reduction by their formula).
However, this claim is contradicted by Ference's own statement of the CTT 2010 analysis, which found that, after the first year of treatment, there is a "consistent 22-24% proportional reduction in cardiovascular events per millimole per litre reduction in LDL-C during each subsequent year of treatment."
A later trial analysis in 2024, based on individual-participant data and meta-regression, also found the same, noting that follow-up duration "was not associated with a change in the HR [hazard ratio] for major vascular events," with estimates "remaining stable up to the maximum follow-up duration of 6.7 years (guideline-recommended therapy), or 9.7 years (any therapy)" (Burger et al., 2024):
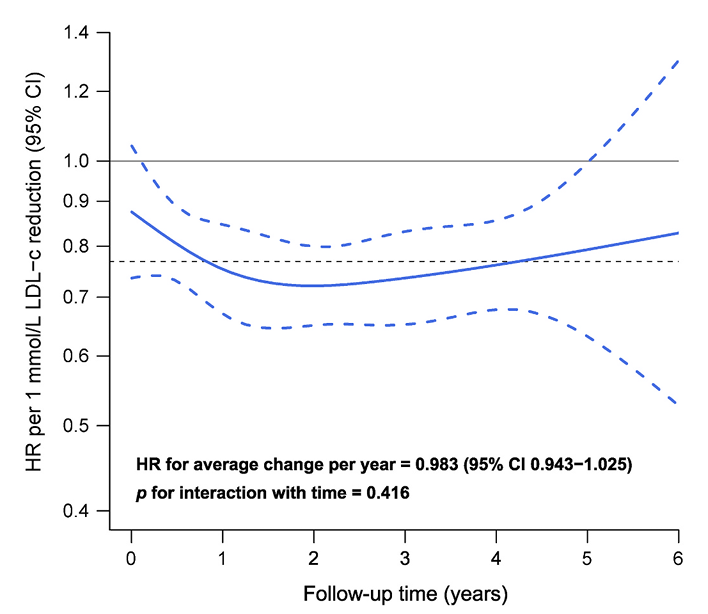 (Image: Burger's individual-participant analysis. If anything, the curve is even compatible with the hypothesis that the CVD rate reduction might decrease with longer follow-up)
Instead of accepting these results, Ference et al. relied on an extrapolation based on observational ecological comparisons across study types (RCTs, cohorts, and genetics) that differ in many ways (Labrecque & Swanson, 2023).
In other words, Ference et al. did not demonstrate that duration actually matters, but rather inferred it based on questionable assumptions.
(Note: All analyses that make a log-linear assumption and standardize to a "1 mmol/L LDL reduction," including those of the CTT, Burger et al., or whatever else, are flawed. I'm simply using Ference's standards here for the sake of argument.)
The Other Graphs
Ference's other graphs are equally amusing.
In the "Evidence from randomized controlled trials" section, Ference et al. stated:
Notably, in the statin trials, the absolute yearly event rate observed in each randomized treatment arm was strongly and linearly associated with the absolute achieved LDL-C level (Figure 5A).
Figure 5A included a plot of 12 statin trials.
But, I have two questions here.
First, why are Ference et al. now claiming a standard linear relationship when they have been hammering home throughout the paper that the relationship is log-linear? These relationships are not the same and have different implications.
And second, how were the trials selected? The study they cited for the above claim was actually an analysis of eight trials, which does not match Ference's selection. Also, that analysis found that non-HDL-C better "explained" treatment effects than apoB, which again undermines Ference's claim that the alleged causal effect of LDL is due to LDL particles (estimated by apoB).
In any case, as Ravnskov et al. (2018) noted, there were far more than 12 statin trials available for analysis. And, when all trials are included in the analysis, "there is no association between LDL-C lowering and coronary event rate."
Ference et al. then claimed:
Furthermore, intravascular ultrasound studies of coronary atherosclerosis involving statin-treated patients have consistently demonstrated that progression of coronary atherosclerotic plaque volume can be substantially arrested at achieved LDL-C levels of ~1.8 mmol/L (70 mg/dL) (Figure 5B).
But this is curious, because Ference et al. plotted a graph showing a group-level association between LDL and PAV (i.e., an ecological association across seven trials) even though within-study and individual-level analyses were available.
In fact, five years ago, I noted the following about Ference's Figure 5B:
Of the seven trials included in their analysis, six had published analyses at an individual level or at least provided within-study correlations. These studies are ASTEROID, REVERSAL, SATURN, CAMELOT, ILLUSTRATE, and PRECISE IVUS. Contrary to the EAS ecological analysis, these six studies found weak to non-existent relations between LDL and atherosclerosis progression.
I later highlighted many more in the Lipid Hypothesis of Atherosclerosis and another post, which included analyses that showed no significant differences in plaque progression for achieved LDL-C levels less than 70 mg/dL compared to levels greater than 70 mg/dL.
Conclusions
At face value, Ference's paper appears powerful because of its strong rhetoric, grand claims, and colorful graphs about the alleged log-linear relationship between LDL and CVD. Yet, when all these surface-level factors are stripped away, we see a paper that lacks what matters the most: strong empirical evidence.
Also, instead of being as objective as possible, Ference et al. rely on confirmation bias, studies that lack independent verification, models or concepts that have no solid empirical foundation, and a complete lack of stress-testing against alternative hypotheses. In other words, Ference's paper is, unfortunately, a case of pseudoscience in the literature.
Further Reading
As complementary to this post, see Ravnskov et al. (2018), Okuyama et al. (2018), and Harcombe (2026).
I have also written a critique of the European Atherosclerosis Society's subsequent consensus paper. In that book, I showed that the very foundation of Ference's hypothesis — the response-to-retention hypothesis of atherosclerosis — is flawed.