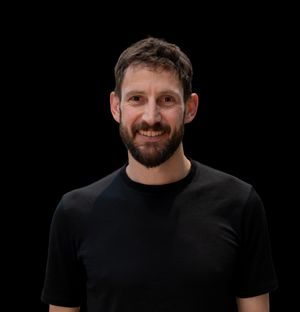


About Dan
creating data vizualisations, analysis, stuff in R
I genuinely love stats, data analysis, data visualisation, and creating things in R. R is what I use for work, rest, and play. My motivation is to make things easier, because I’m curious, or just to keep in touch with the hands-on work. Pretty much everything I do I share and make available to others.
Here are a few of the R packages I’ve built:
{survivoR}: [CRAN, Github] The largest publicly available database of Survivor data (AFAIK). I built this so I could analyse trends and relationships across seasons. I also built a confessional timing app to time and count confessionals. It’s built in R for R users in mind so it is simple to summarise and do what you need to do. I maintain it every week as a season airs and there are often multiple seasons at once. It keeps me very busy. I love it though!
{cropcircles}: [CRAN, Github] A set of functions to crop an image to a circle or other geometries. Very useful for data viz.
{alone}: [CRAN, Github] A R package of data from the Alone TV series
{eyedroppeR}: [Github] Allows you to click on an image in R and return the hex. As well as a function to extract a palette from an image or generate one from AI
{ggbrick}: [Github] A waffle-style ggplot2 extension that layers up like a brick wall.
If you’ve found any of these helpful or learned something from the data viz or code I’ve shared, and looking for a way to repay the favour a coffee would mean a lot to me! 🙂
Cheers!
Recent supporters