
You will find the content below in this order:
1. Definitions
2. The Good
3. The Bad
4. Key Levels
5. Final Thoughts
DEFINITIONS
Liquidity zones are high volume levels that offer support and resistance
Hidden bearish divergence: creating a lower high in price, with a higher high on the oscillators. This signals a possible trend continuation down.
Bearish divergence: higher high in price, lower high on the oscillators. This signals a possible trend reversal down.
Hidden bullish divergence: creating a higher low in price, with a lower low on the oscillators. This signals a possible trend continuation up.
Bullish divergence: creating a lower low in price, with a higher low on the oscillators. This signals a possible trend reversal up.
SR flip: turning old resistance into support, and vice-versa.
Fractal: recurring geometric pattern.
Price action (PA): the movement of an asset's price over time.
THE GOOD
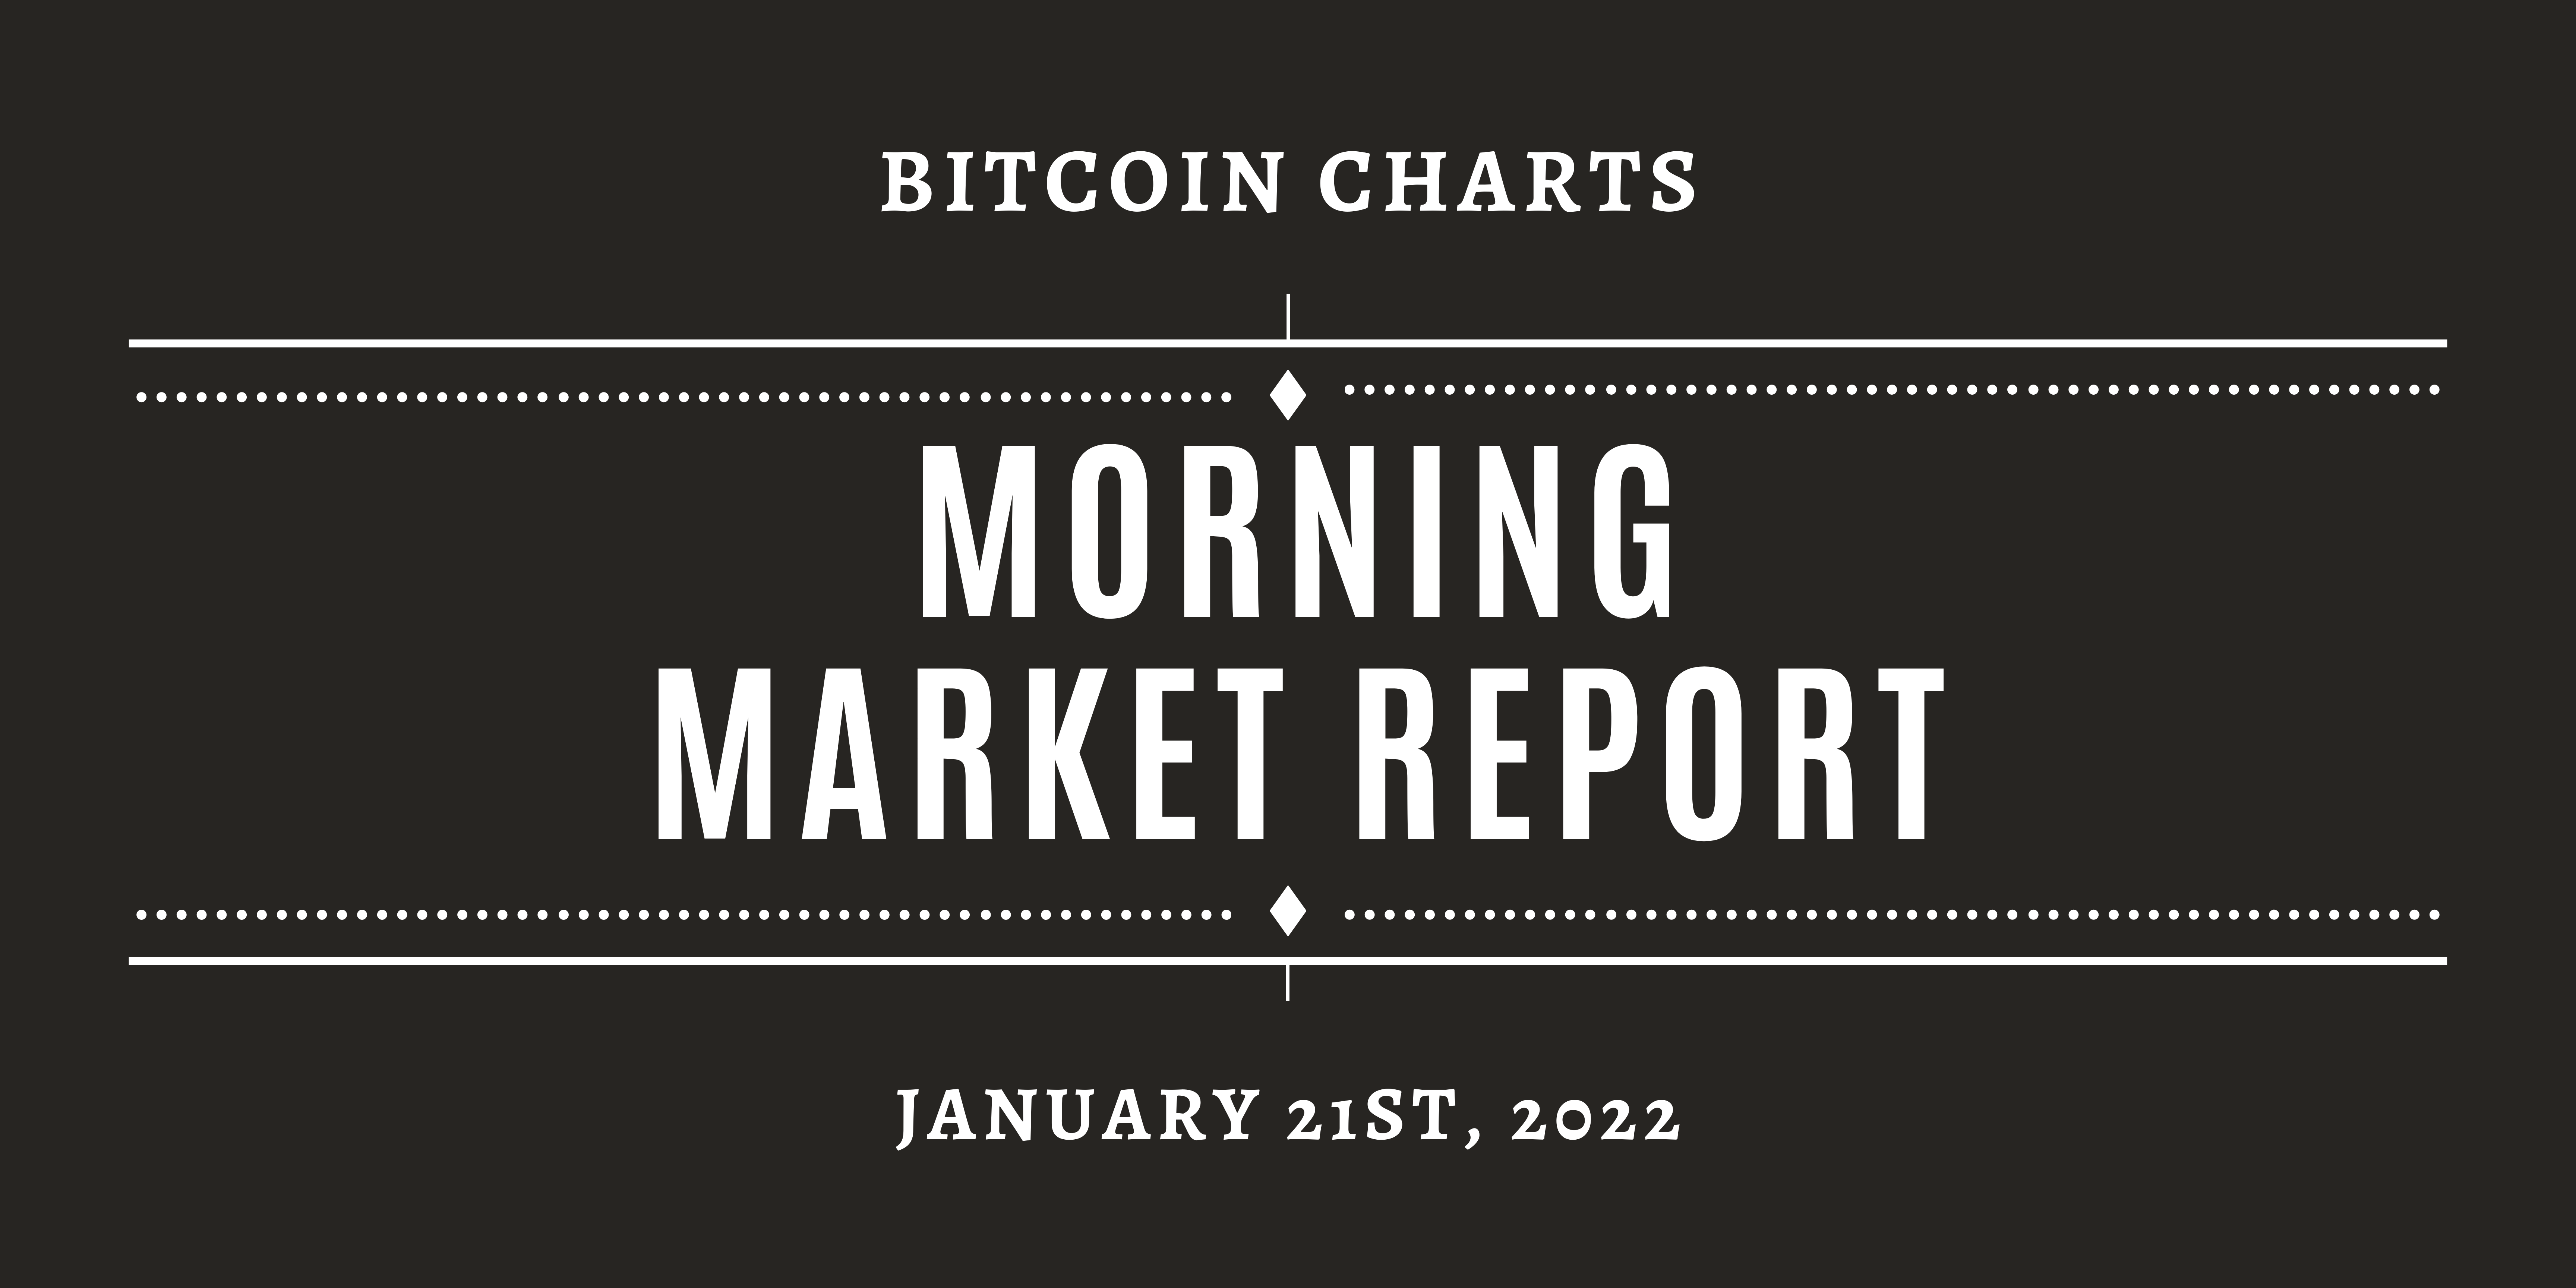
4H Timeframe
Divergences
Bullish Divergence
Bitcoin has a lower low in price, with a higher low in the RSI. This is a bullish divergence, which signals a possible trend reversal up.
Invalidation: Lower low in price and in the RSI.
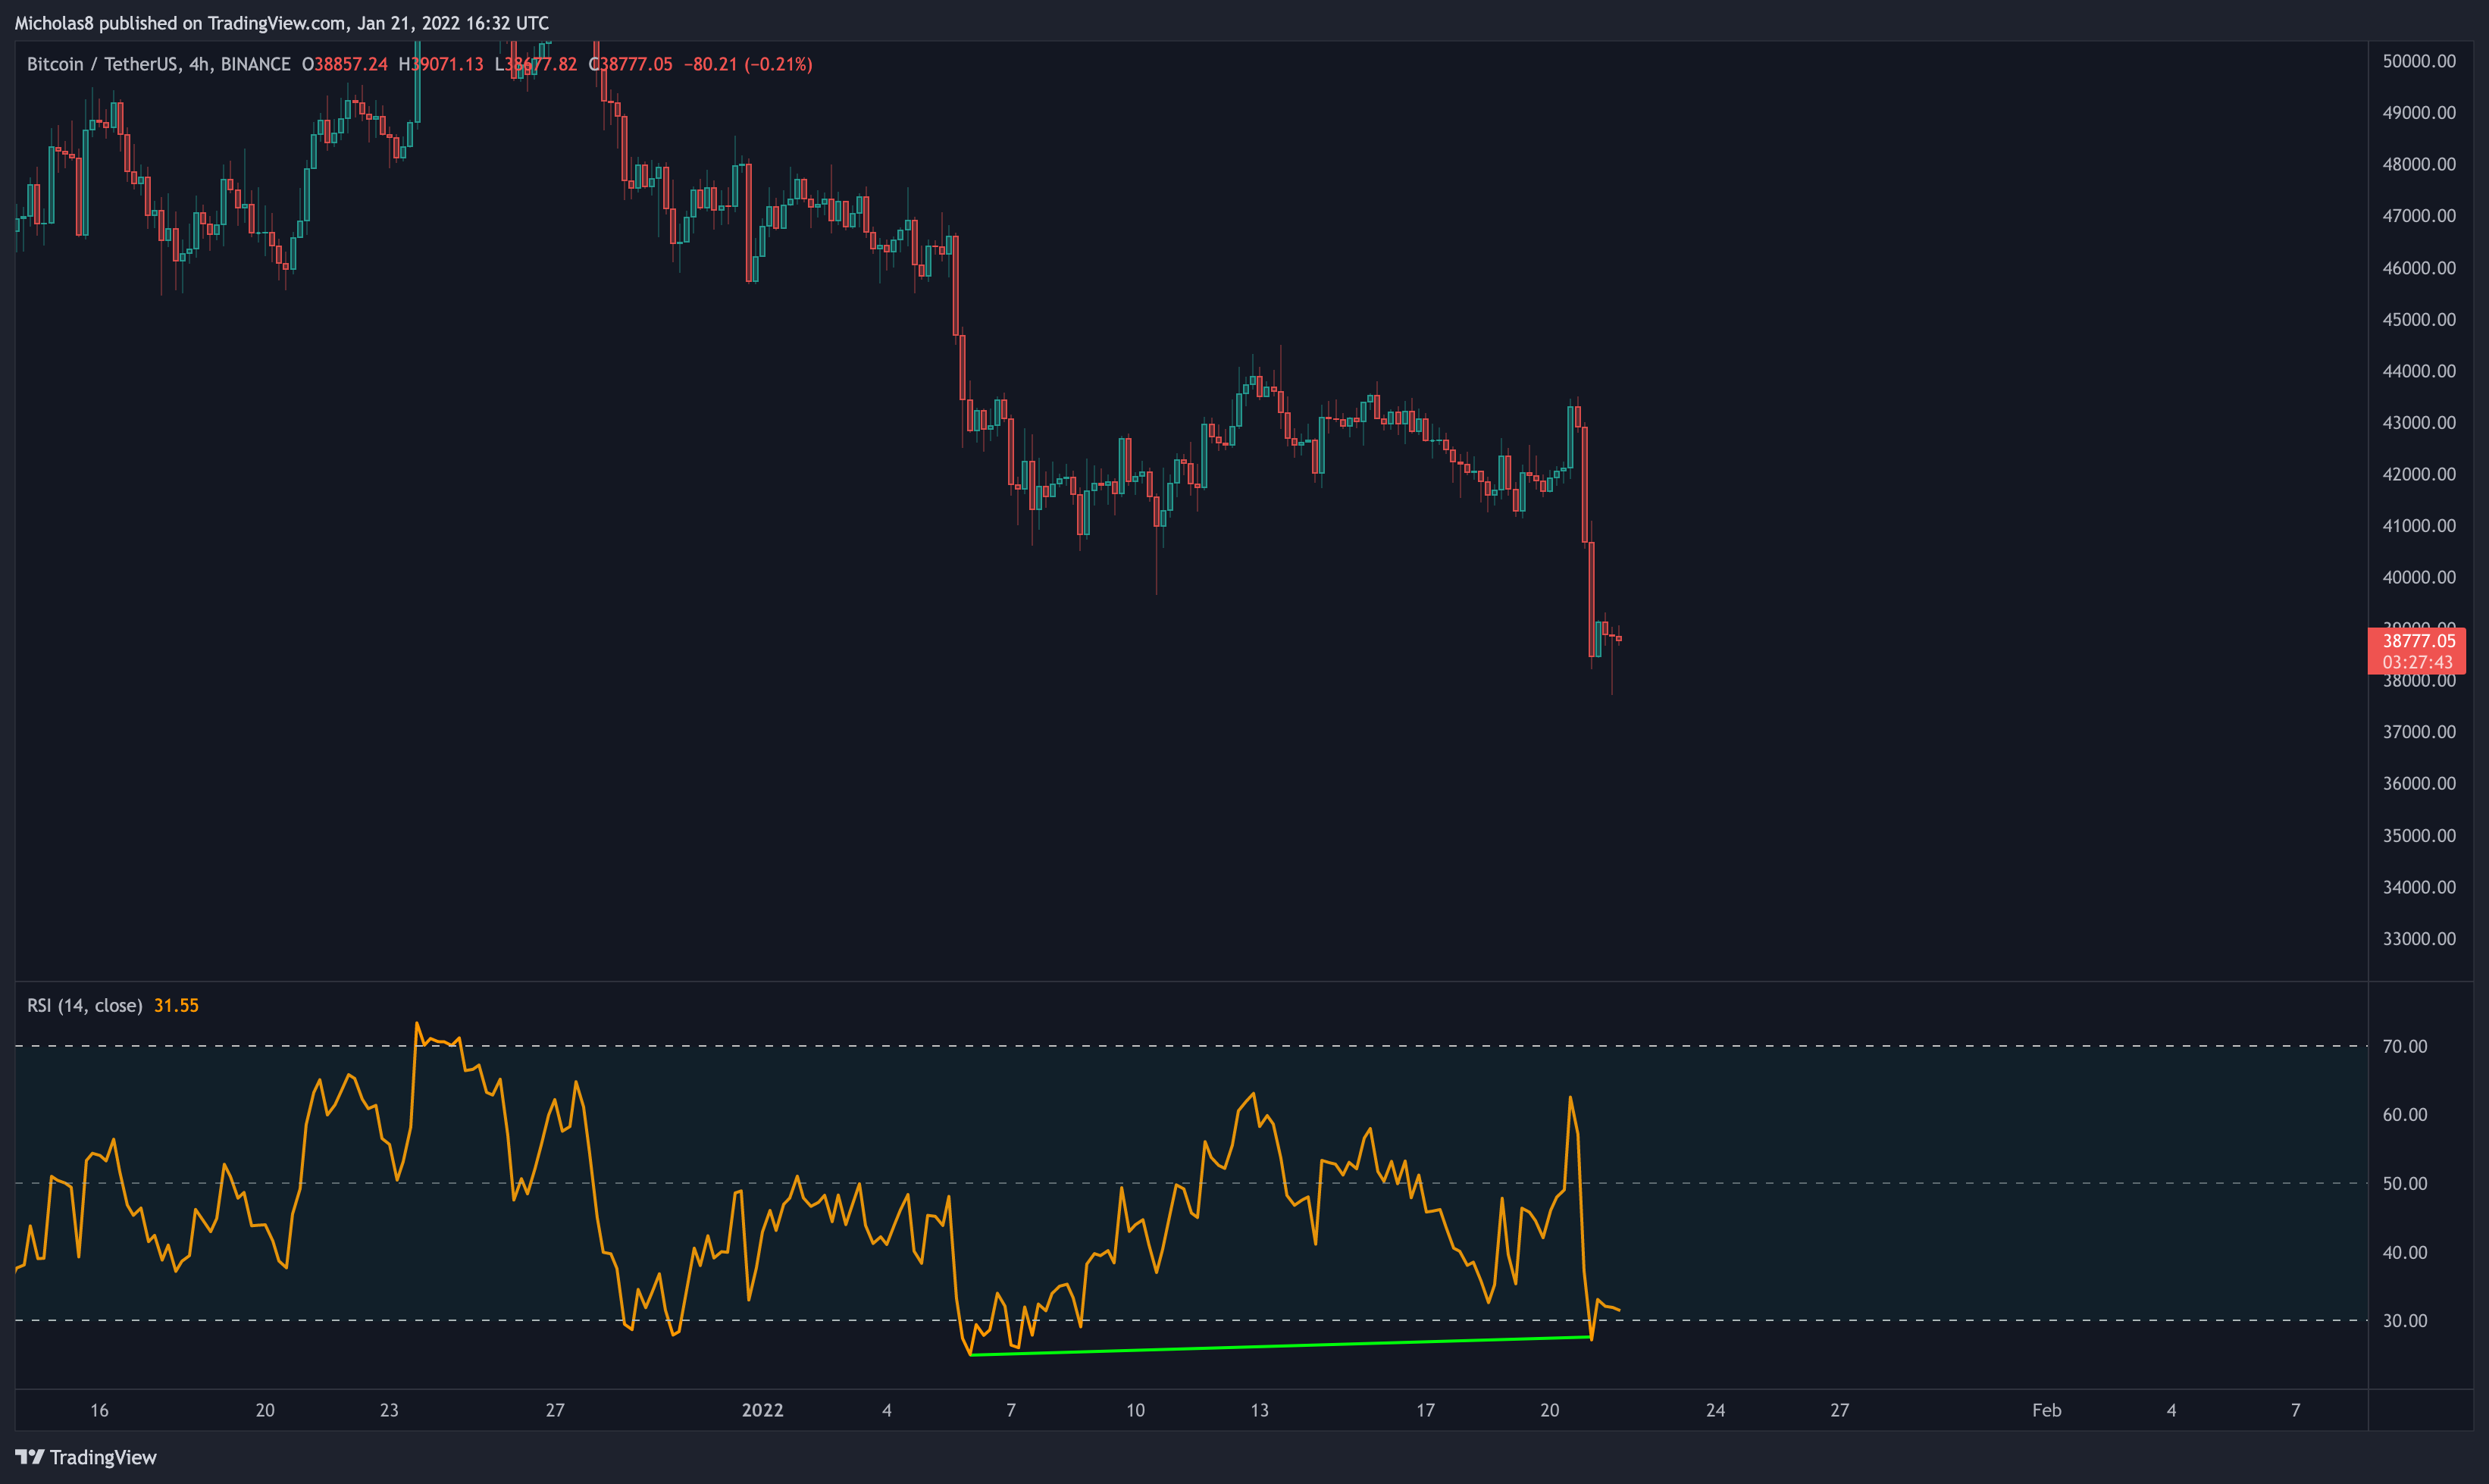
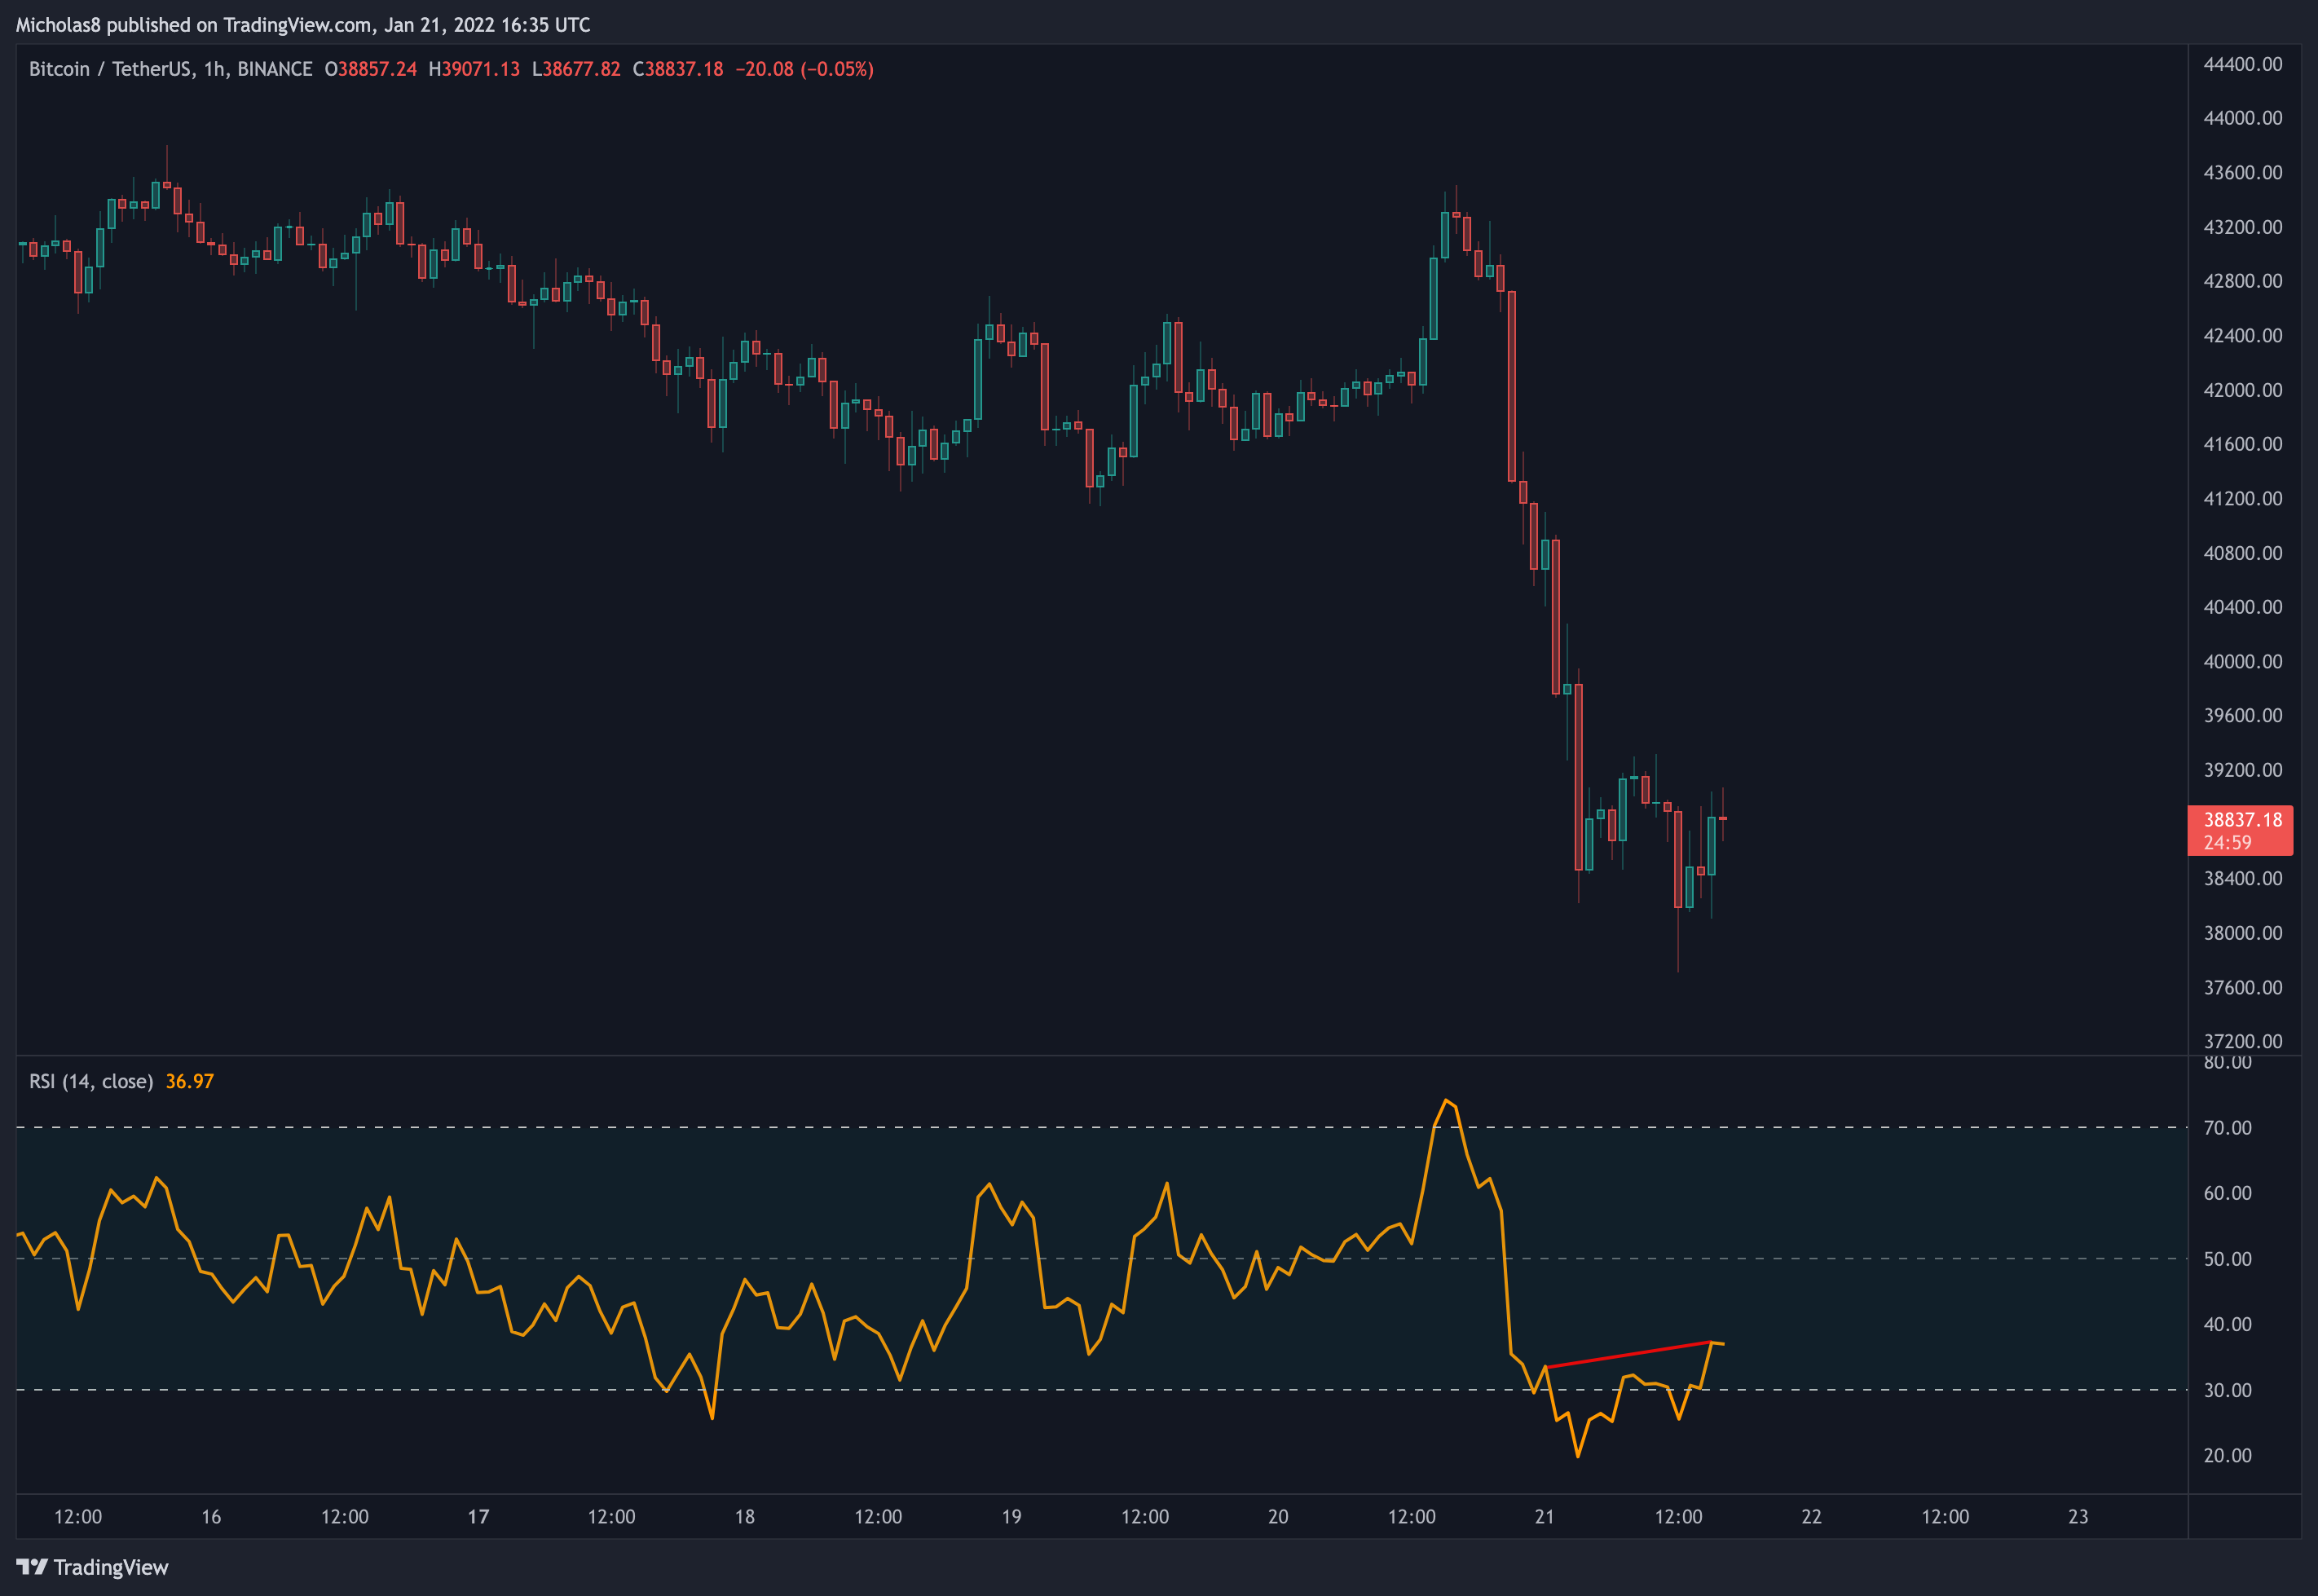
1H Timeframe
Divergences
Bullish Divergence
THE BAD
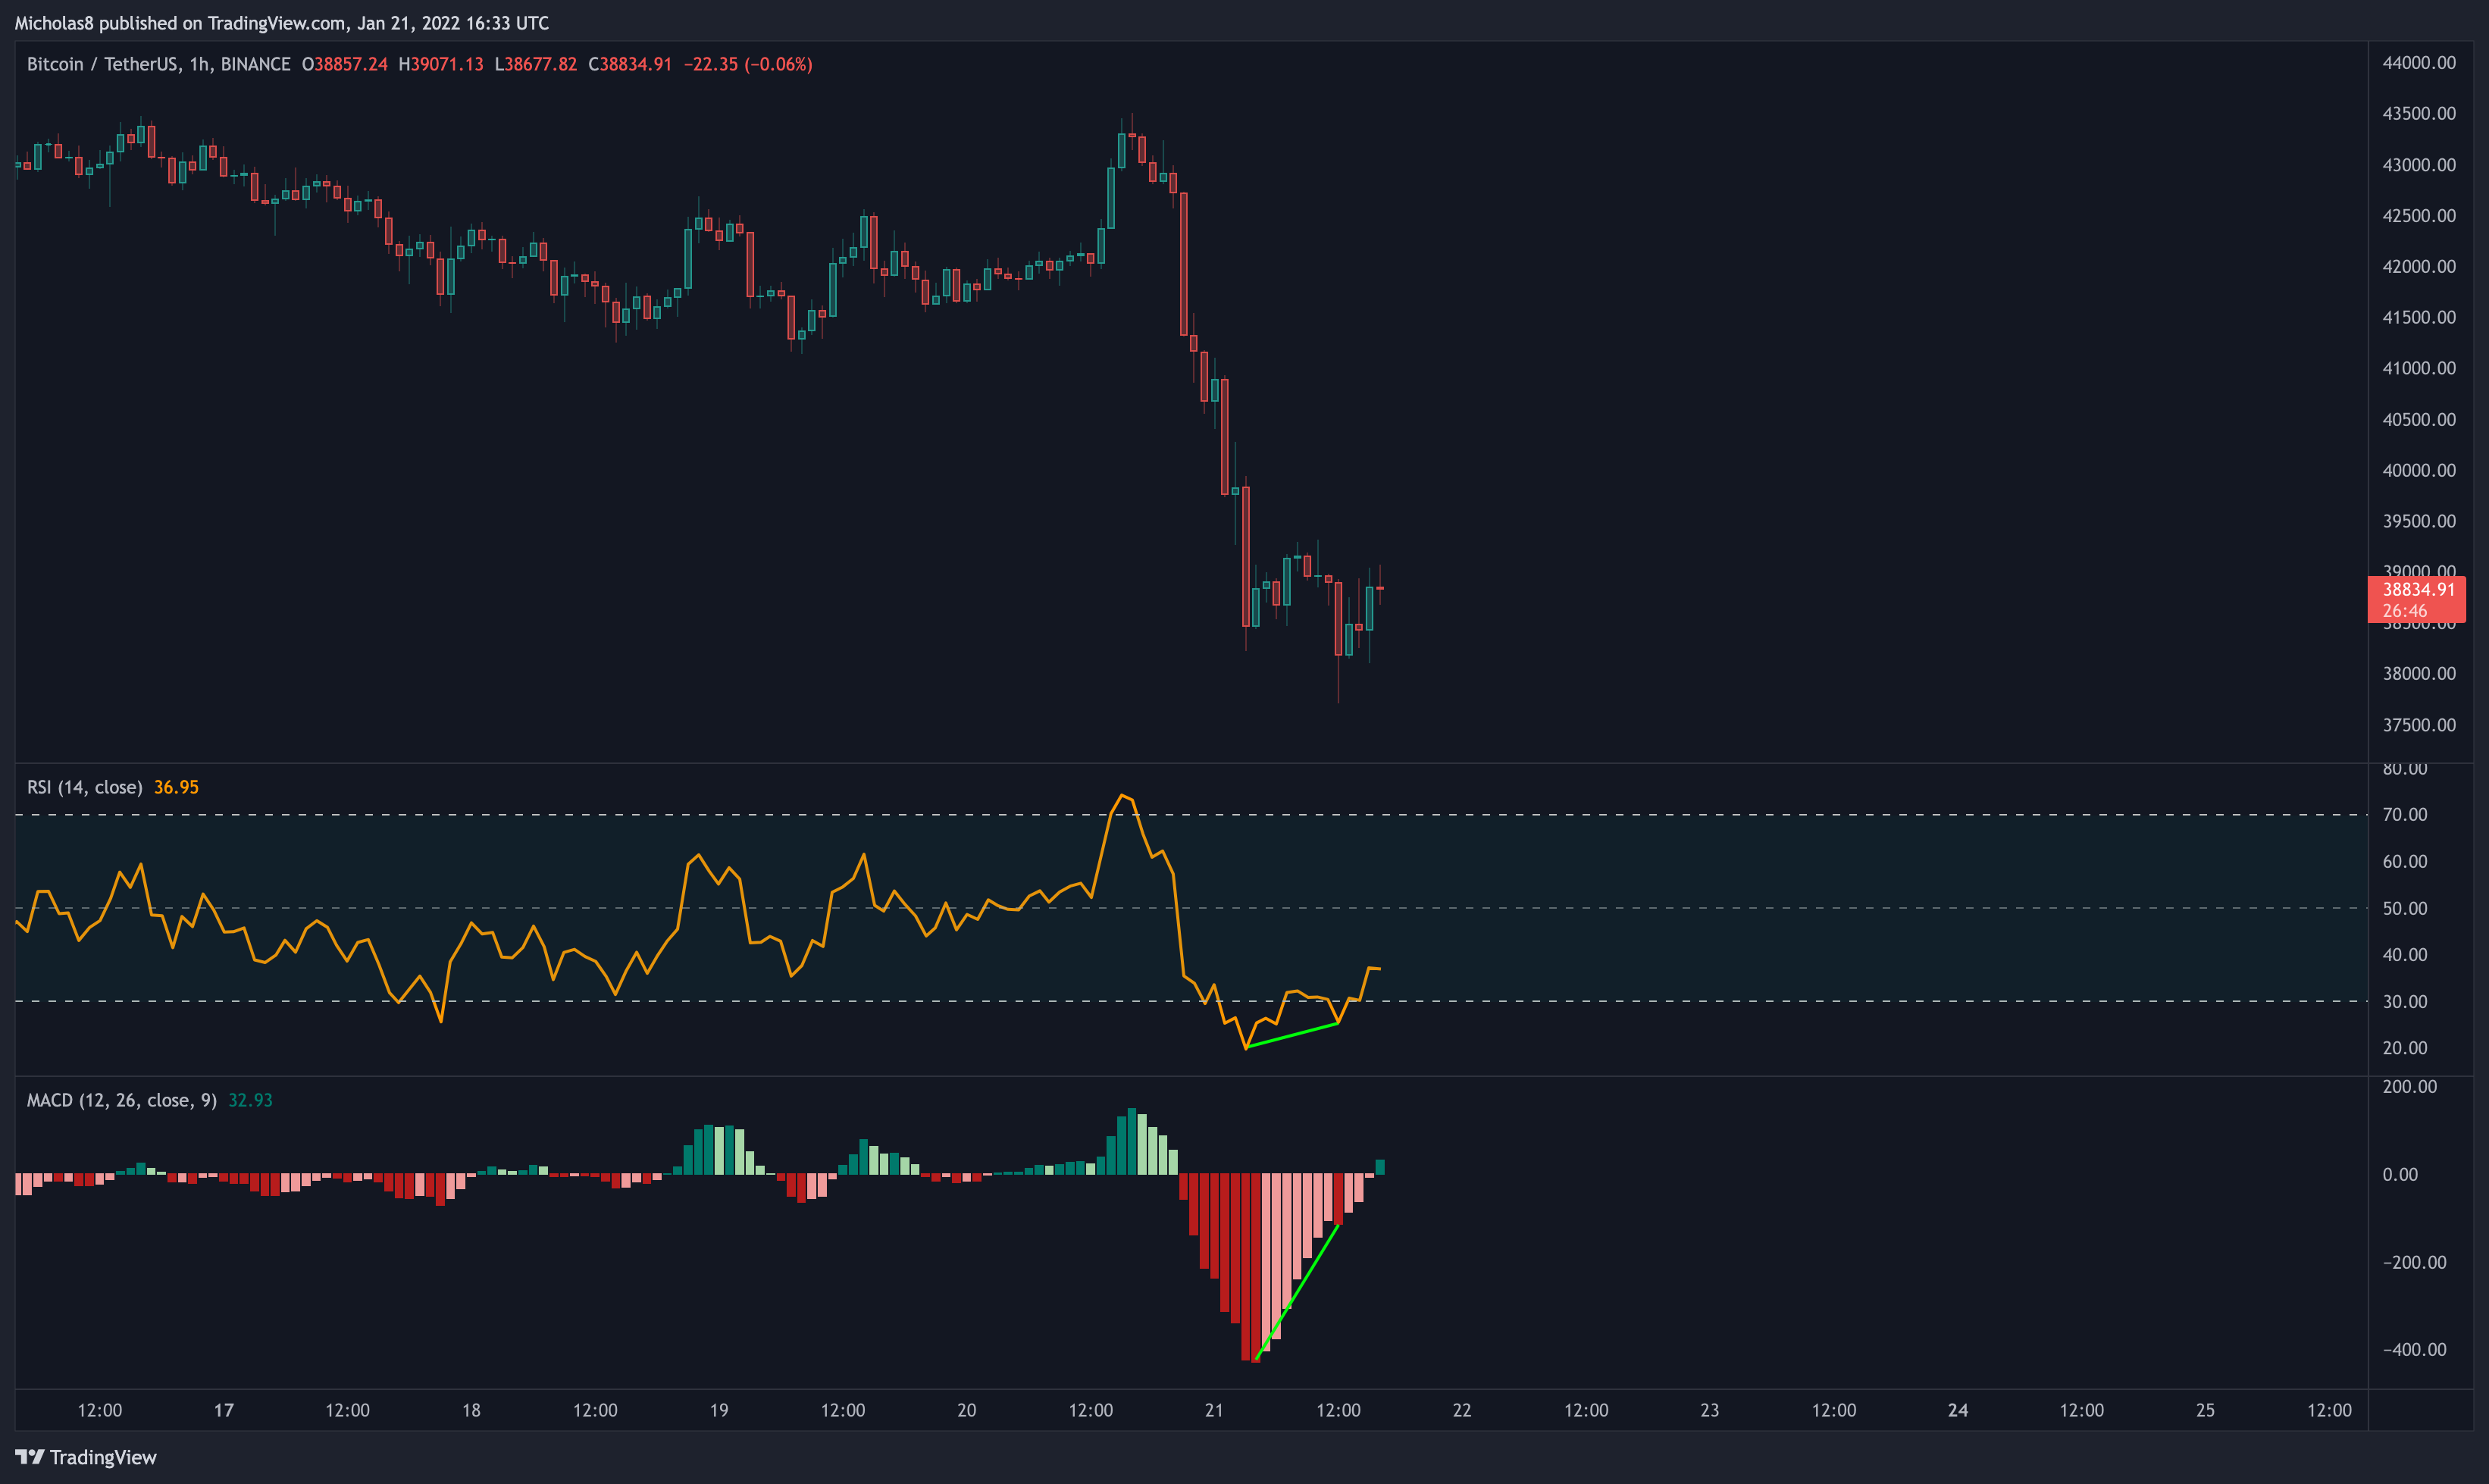
4H Timeframe
Key Liquidity Zone (LQZ)
Zone 1: The LQZ at 42.9k-43.1k has been lost as support.
Zone 1: Bitcoin continues to trade below the LQZ sitting at 41.7k-42k.
Implications: We may see these serve as resistance moving forward.
EMA Ribbon
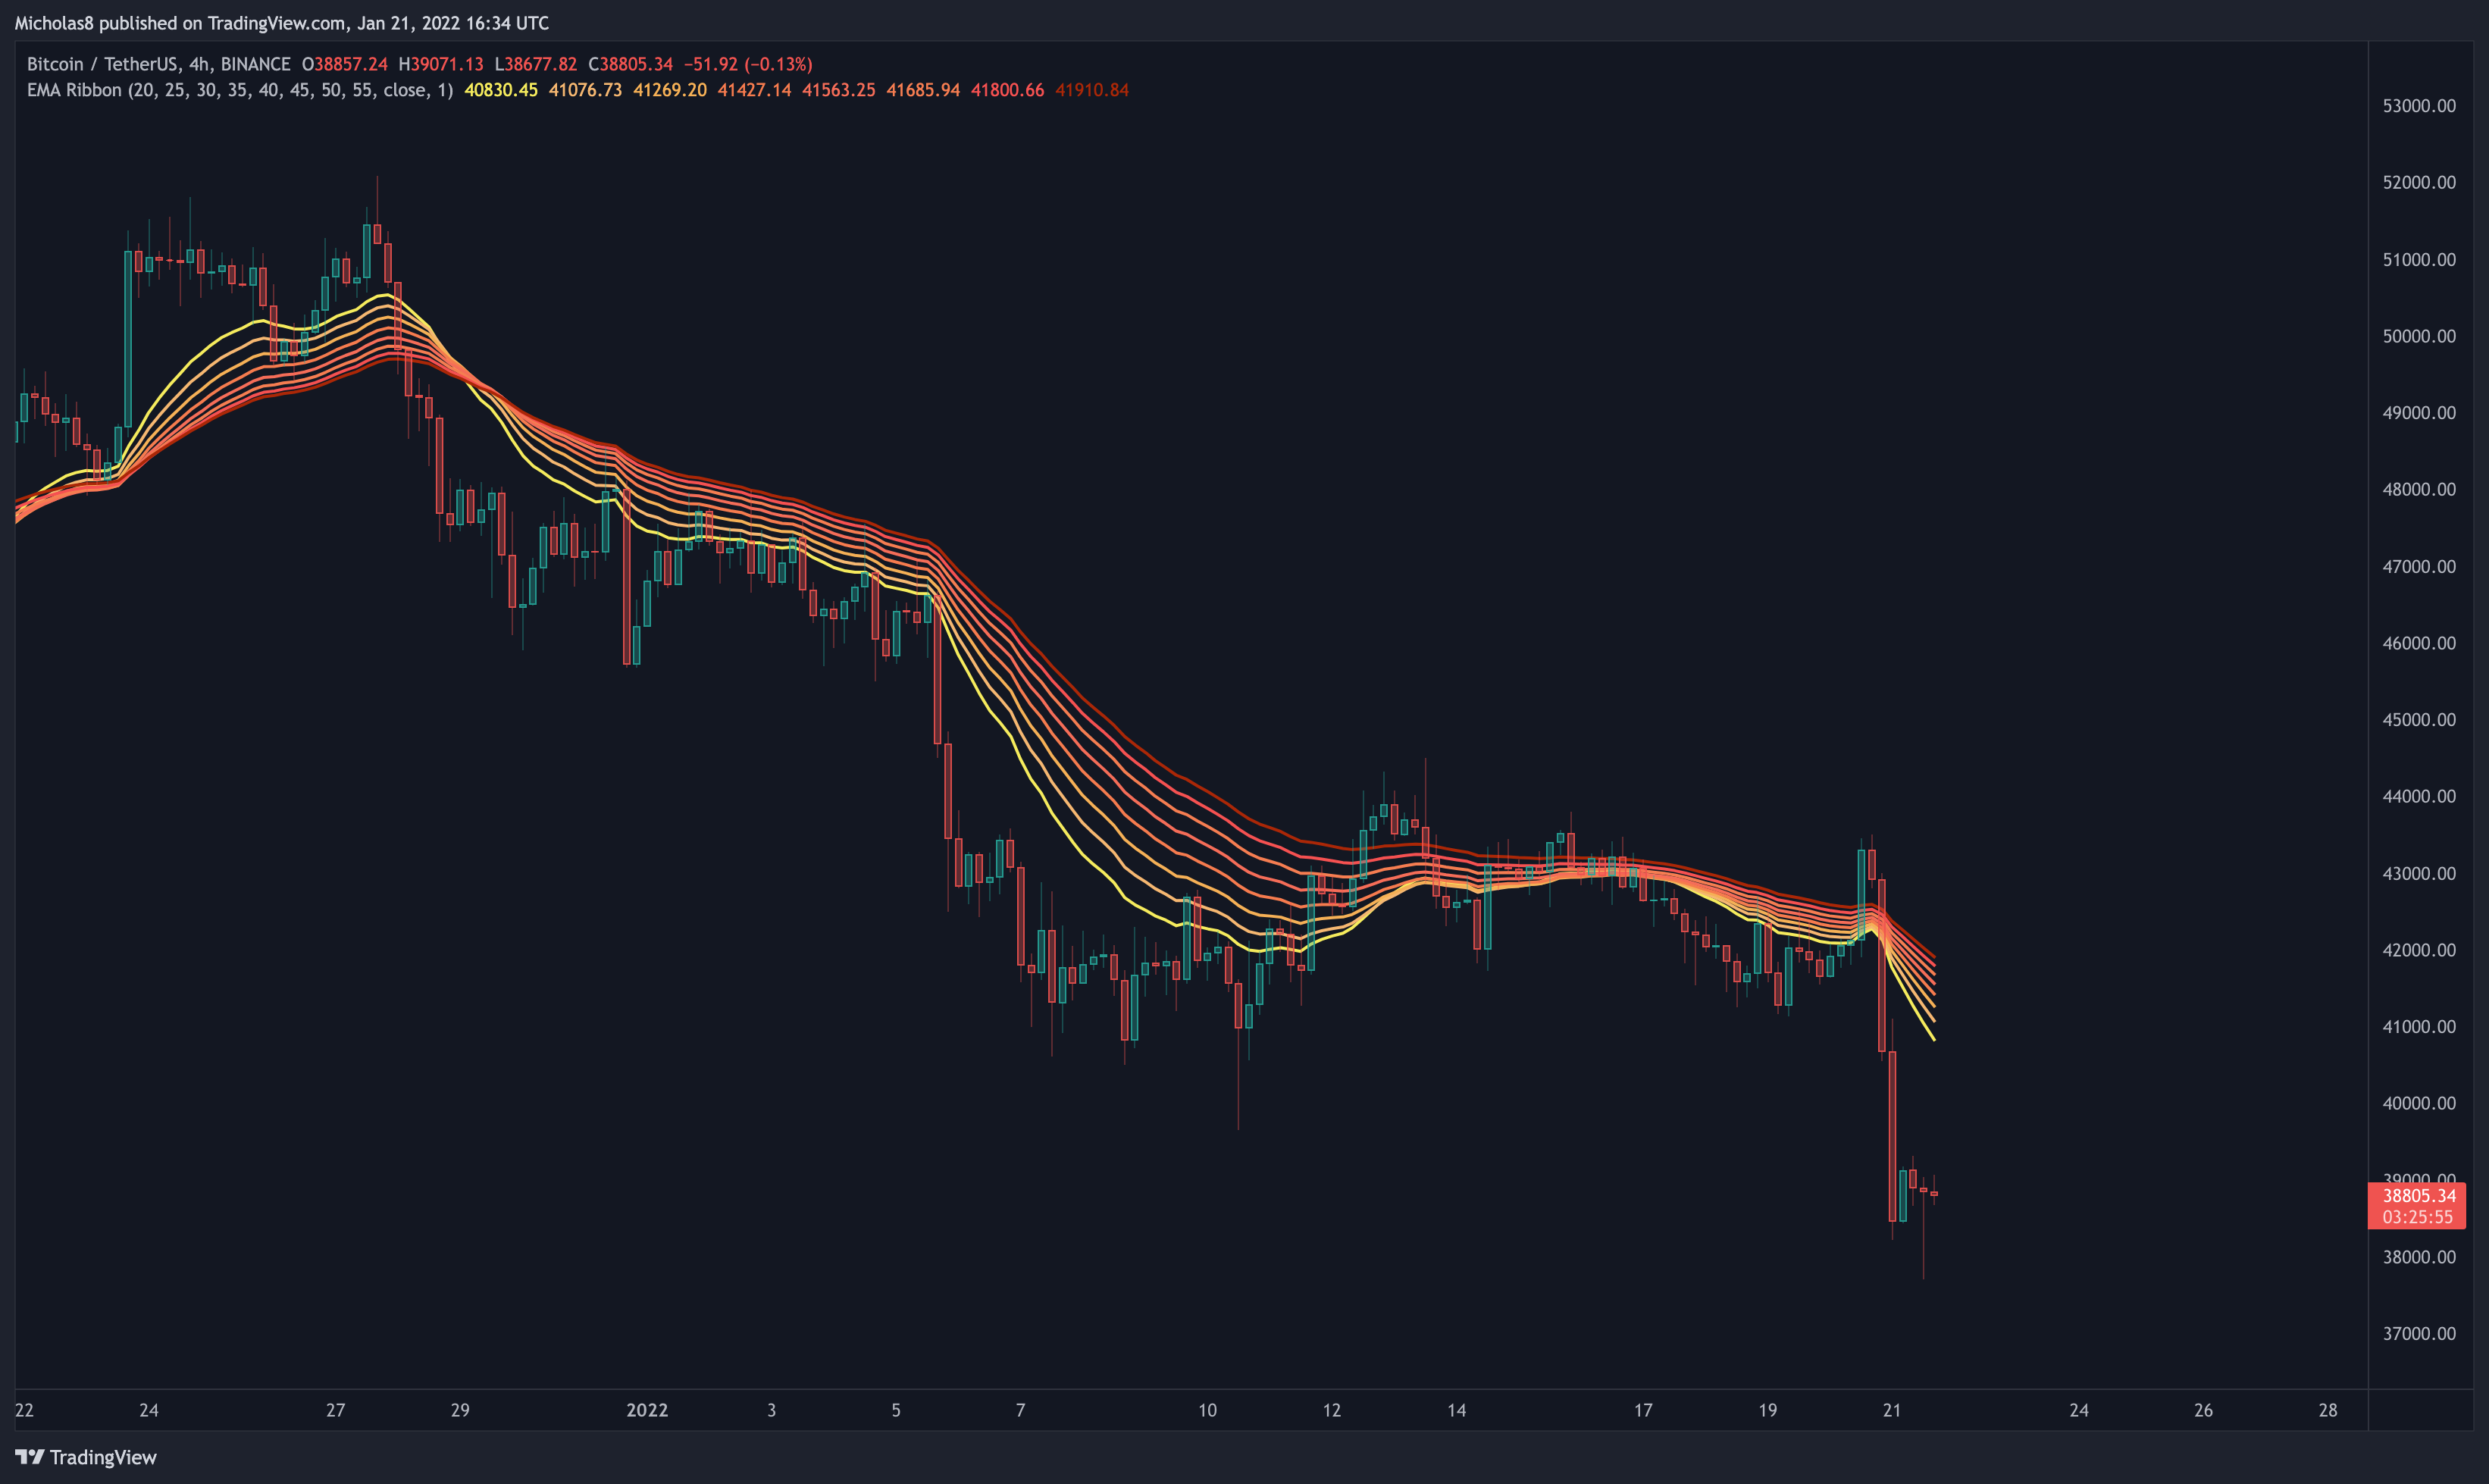
Bitcoin has lost the EMA ribbon as support in this timeframe.
Implication: This may serve as resistance moving forward.
What is an EMA ribbon? A 'ribbon' of EMAs that together indicate bearish and bullish momentum in the market. When an asset is trading is above the ribbon, it's considered bullish. Vice-versa.
Simple Moving Averages (SMA): 50 and 200
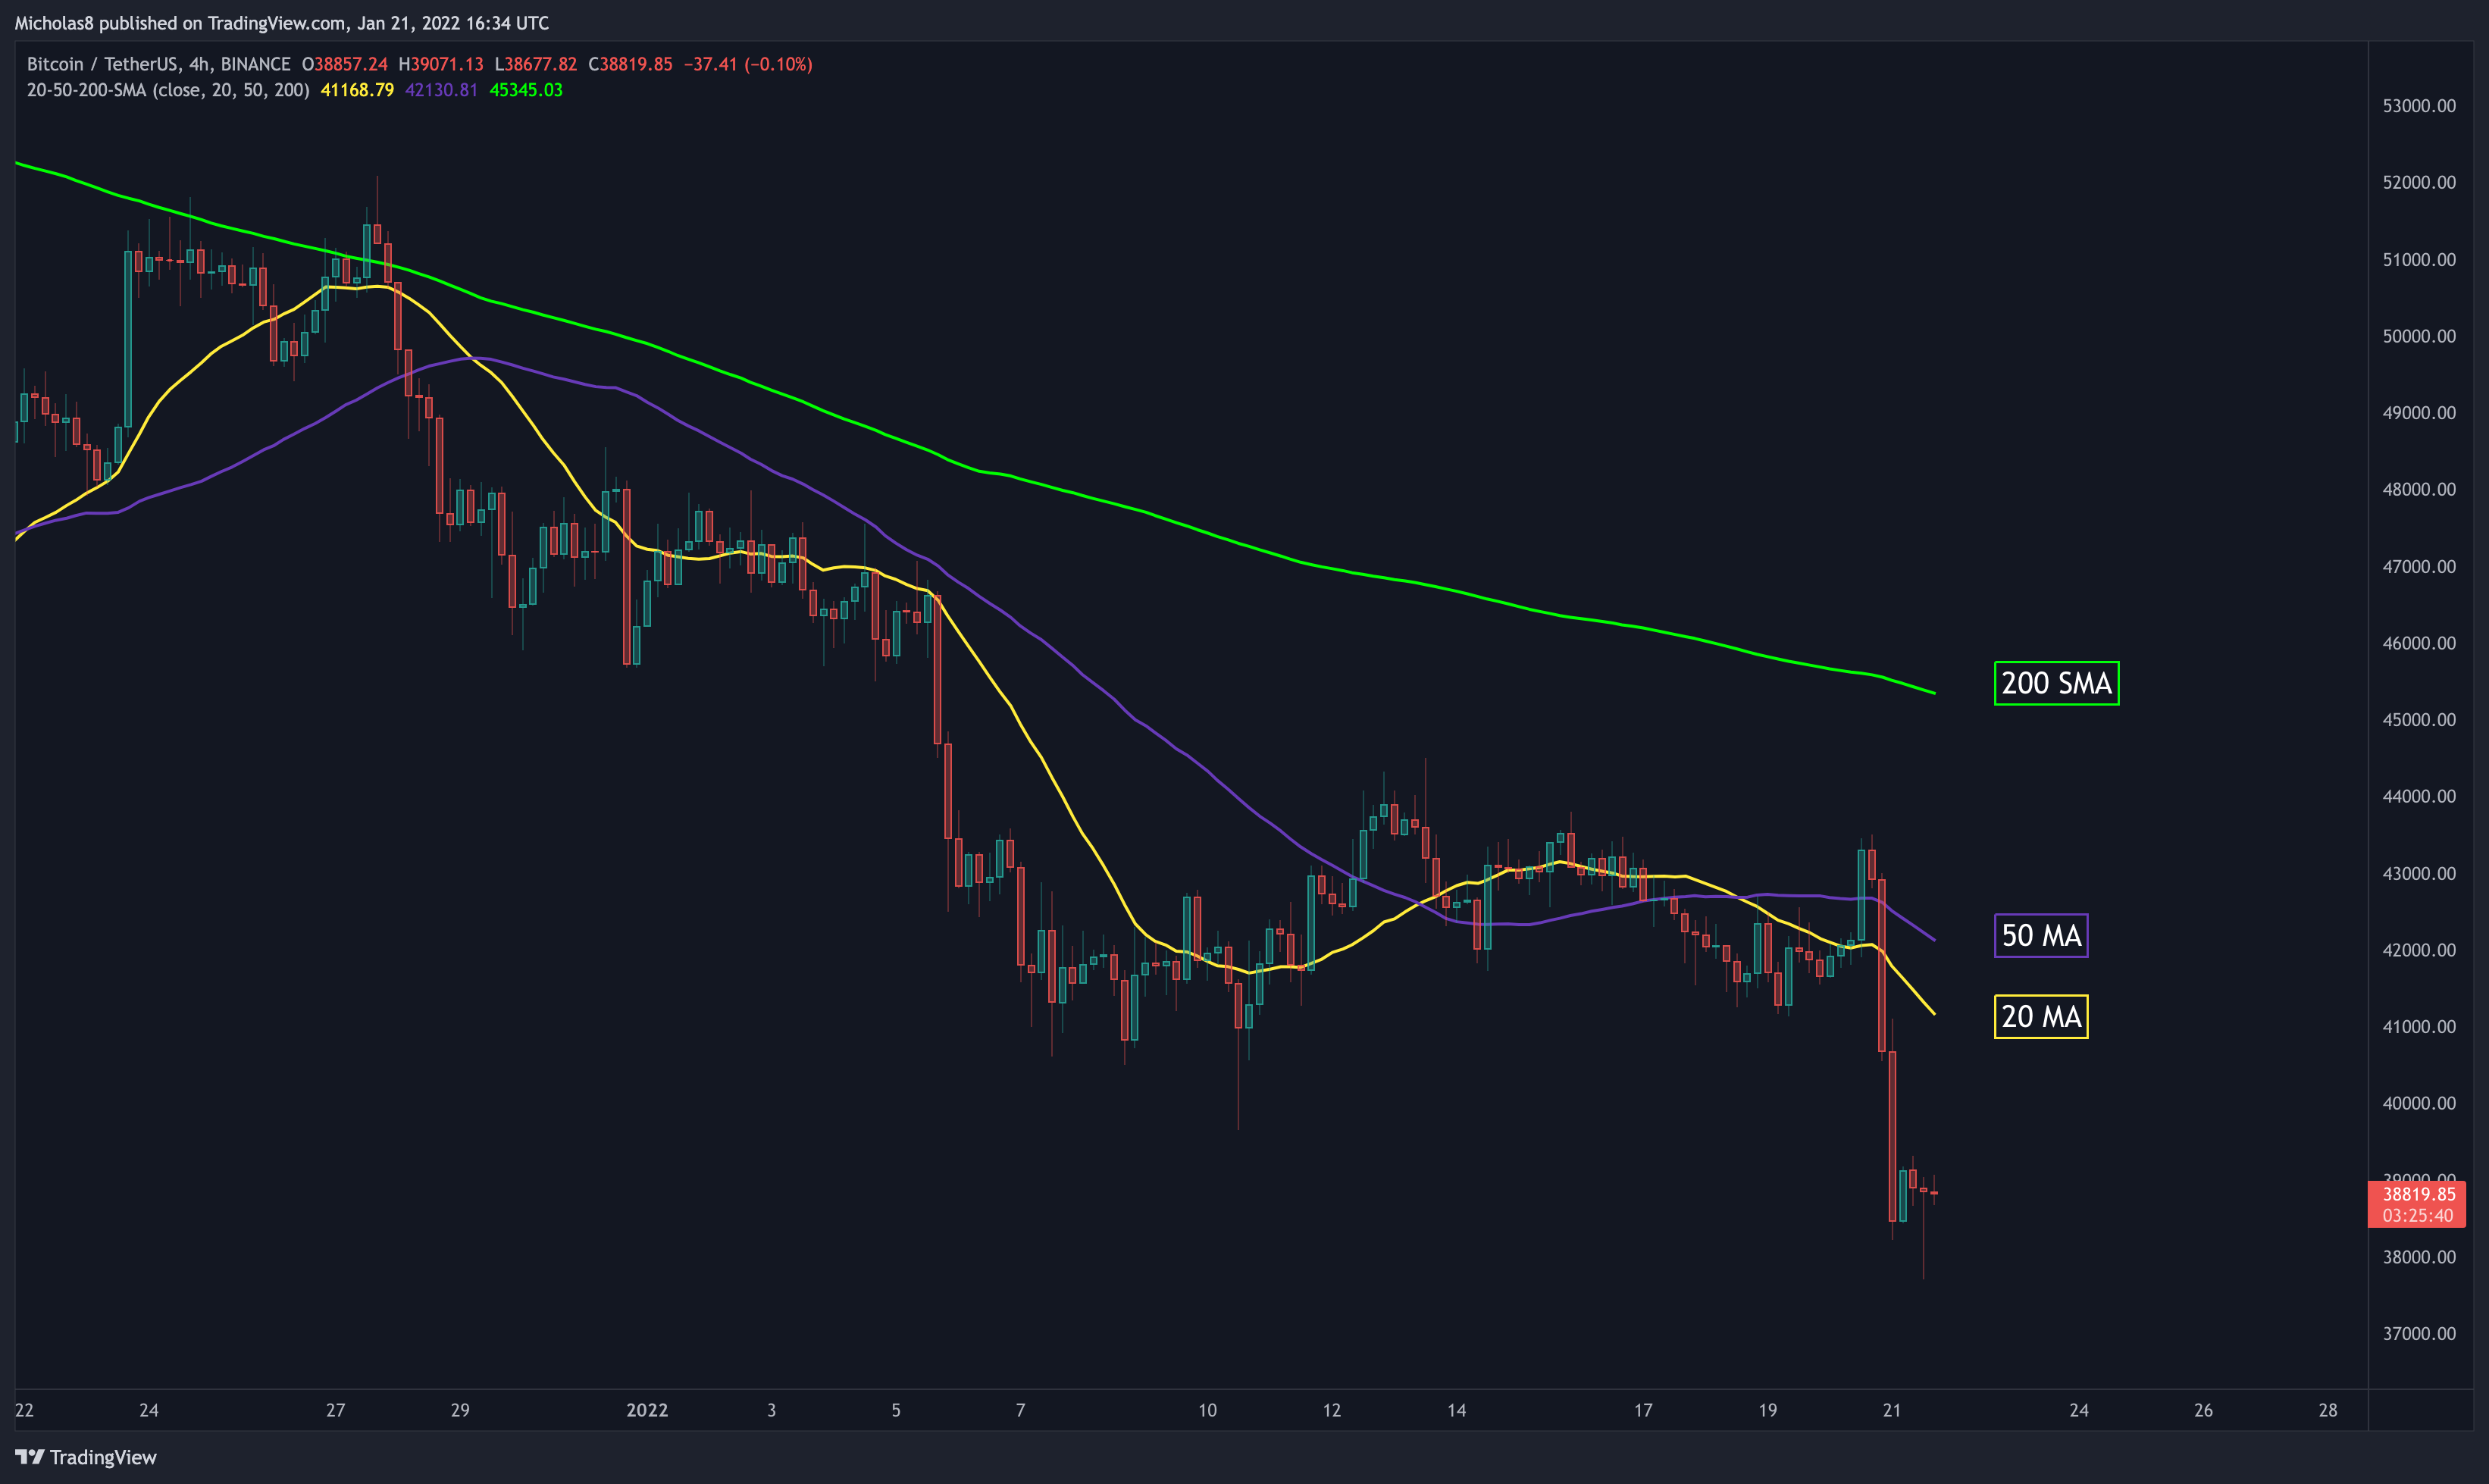
Bitcoin continues to trade below the 50/200 SMAs.
Implication: These may serve as resistance moving forward. However, if Bitcoin can rise above them in the near future, it may be an early indication of a move to the upside.
1H Timeframe
EMA Ribbon
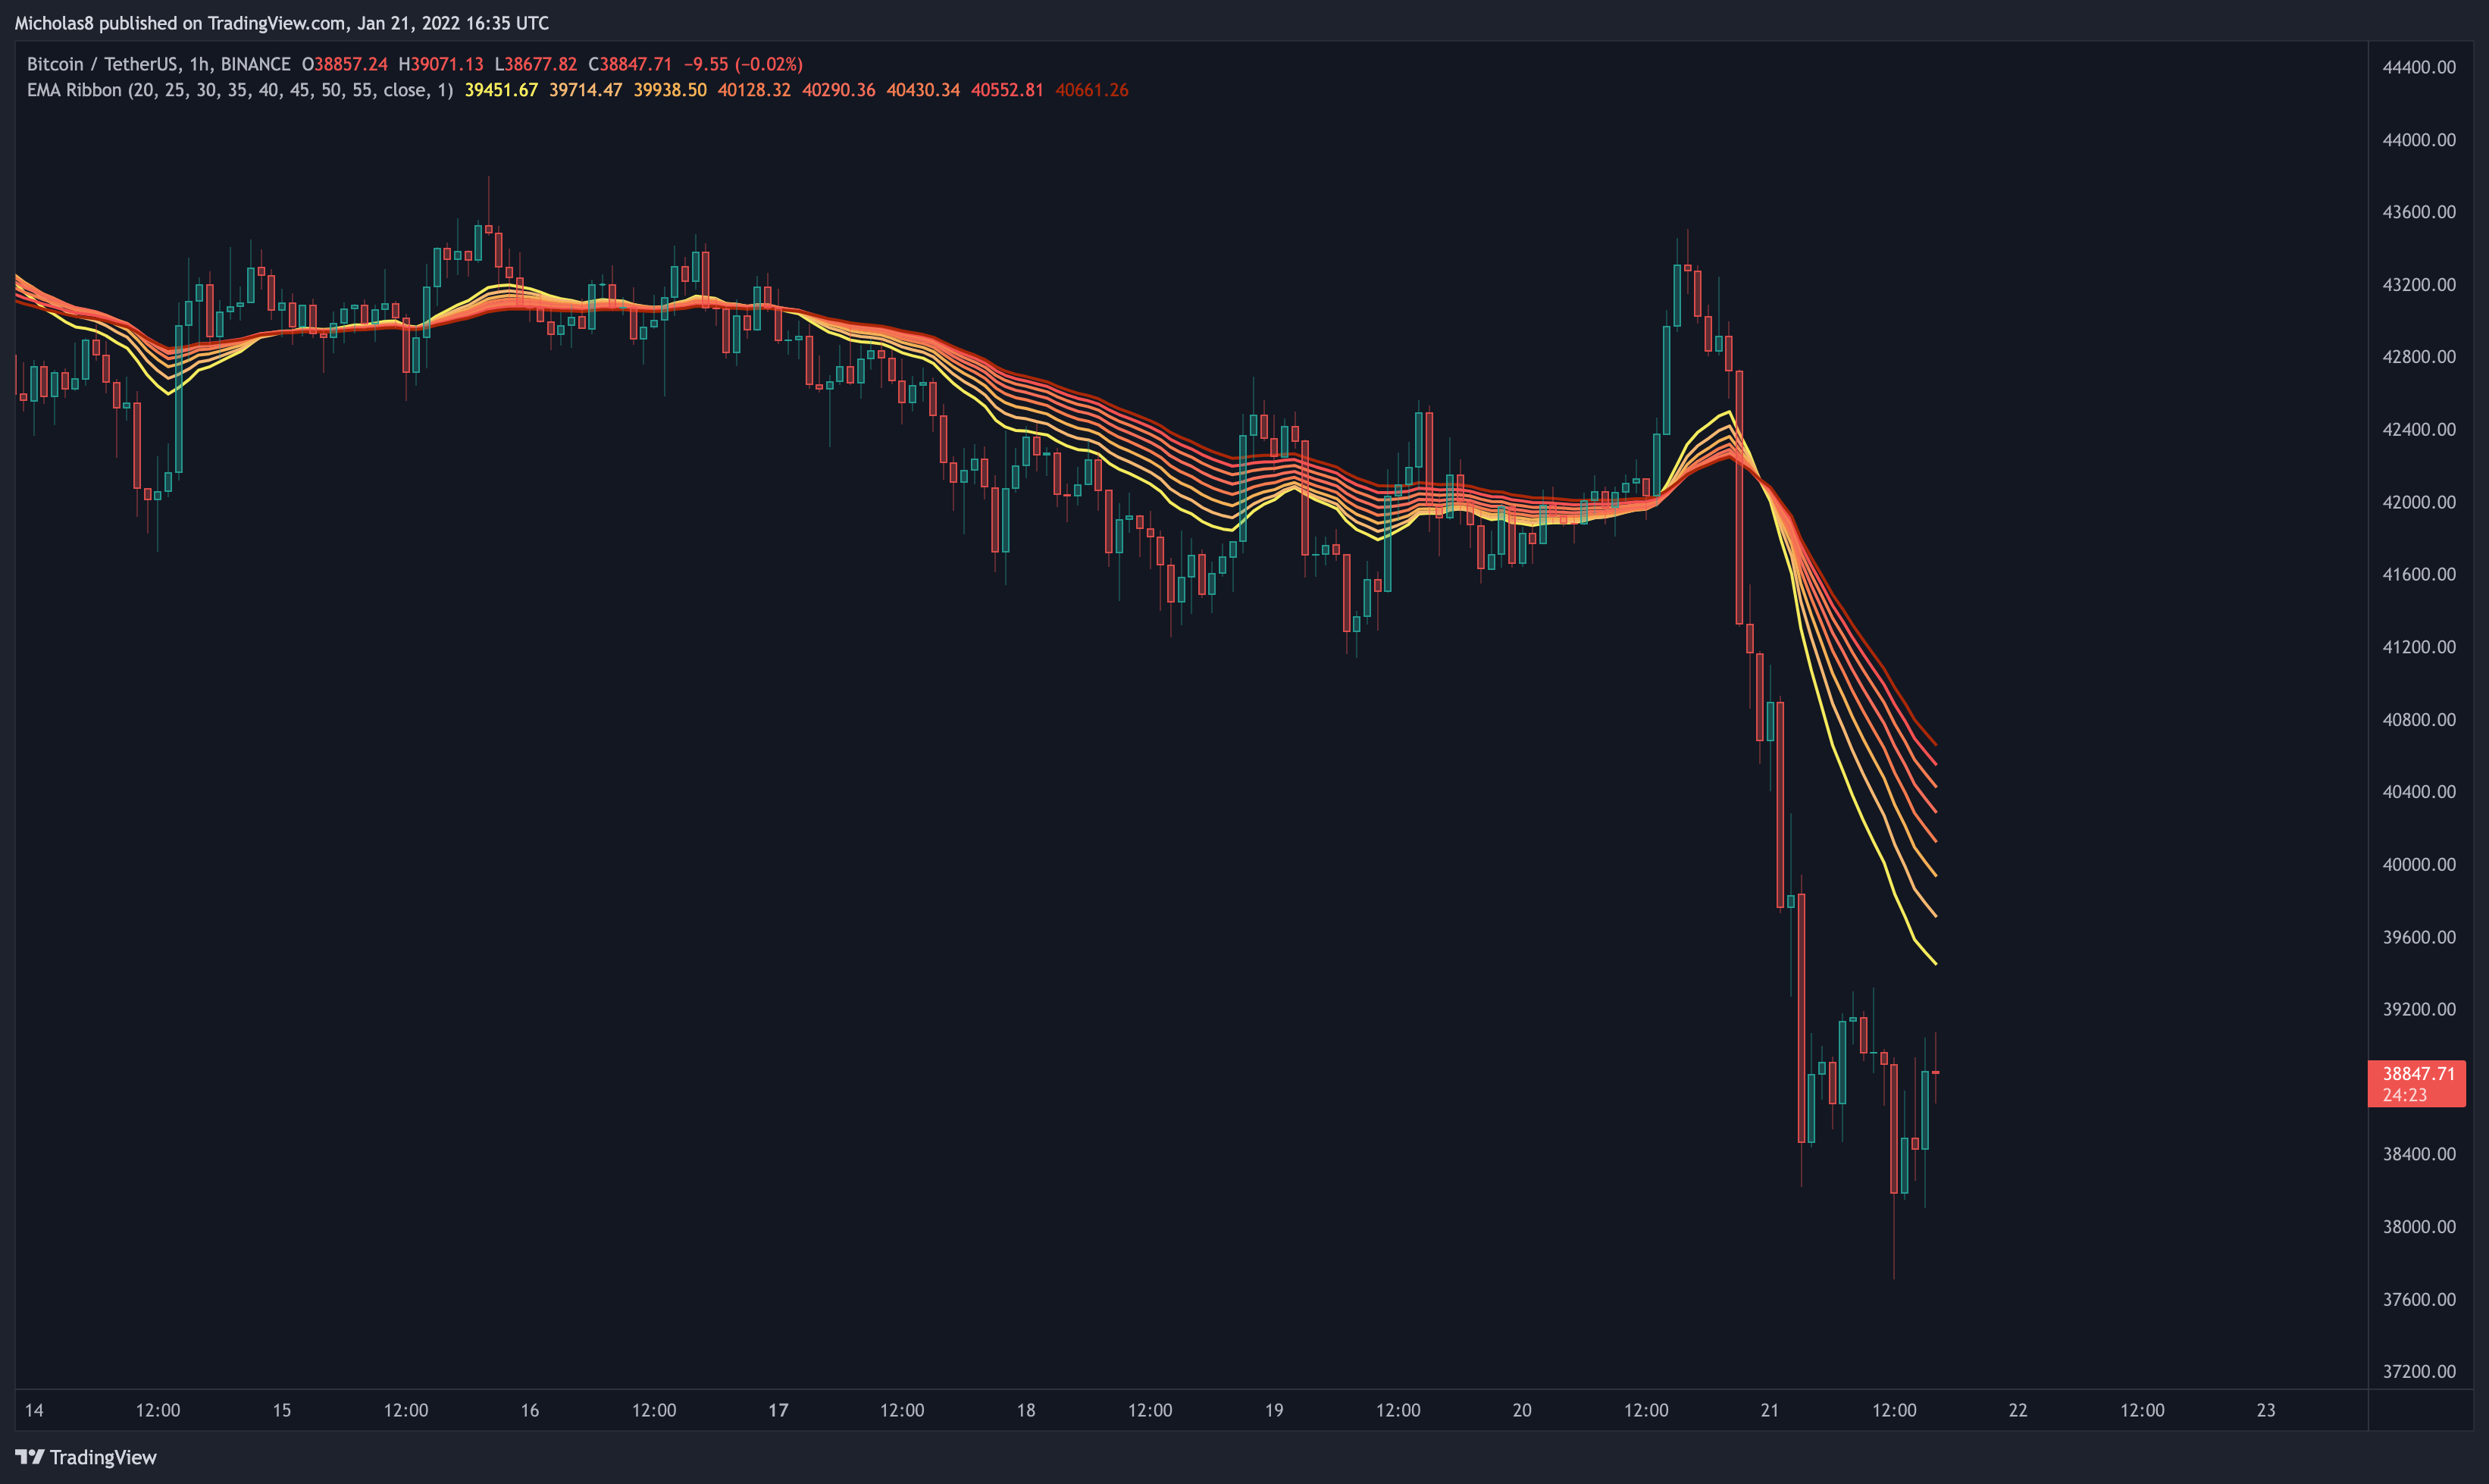
Bitcoin has lost the EMA ribbon as support in this timeframe.
Implication: This may serve as resistance moving forward.
What is an EMA ribbon? A 'ribbon' of EMAs that together indicate bearish and bullish momentum in the market. When an asset is trading is above the ribbon, it's considered bullish. Vice-versa.
Divergences
Hidden Bearish Divergence
Bitcoin has a lower high in price, with a higher high on the RSI. This is a hidden bearish divergence, which signals a possible trend continuation down.
Invalidation: Higher high in price and in the oscillators.
KEY LEVELS
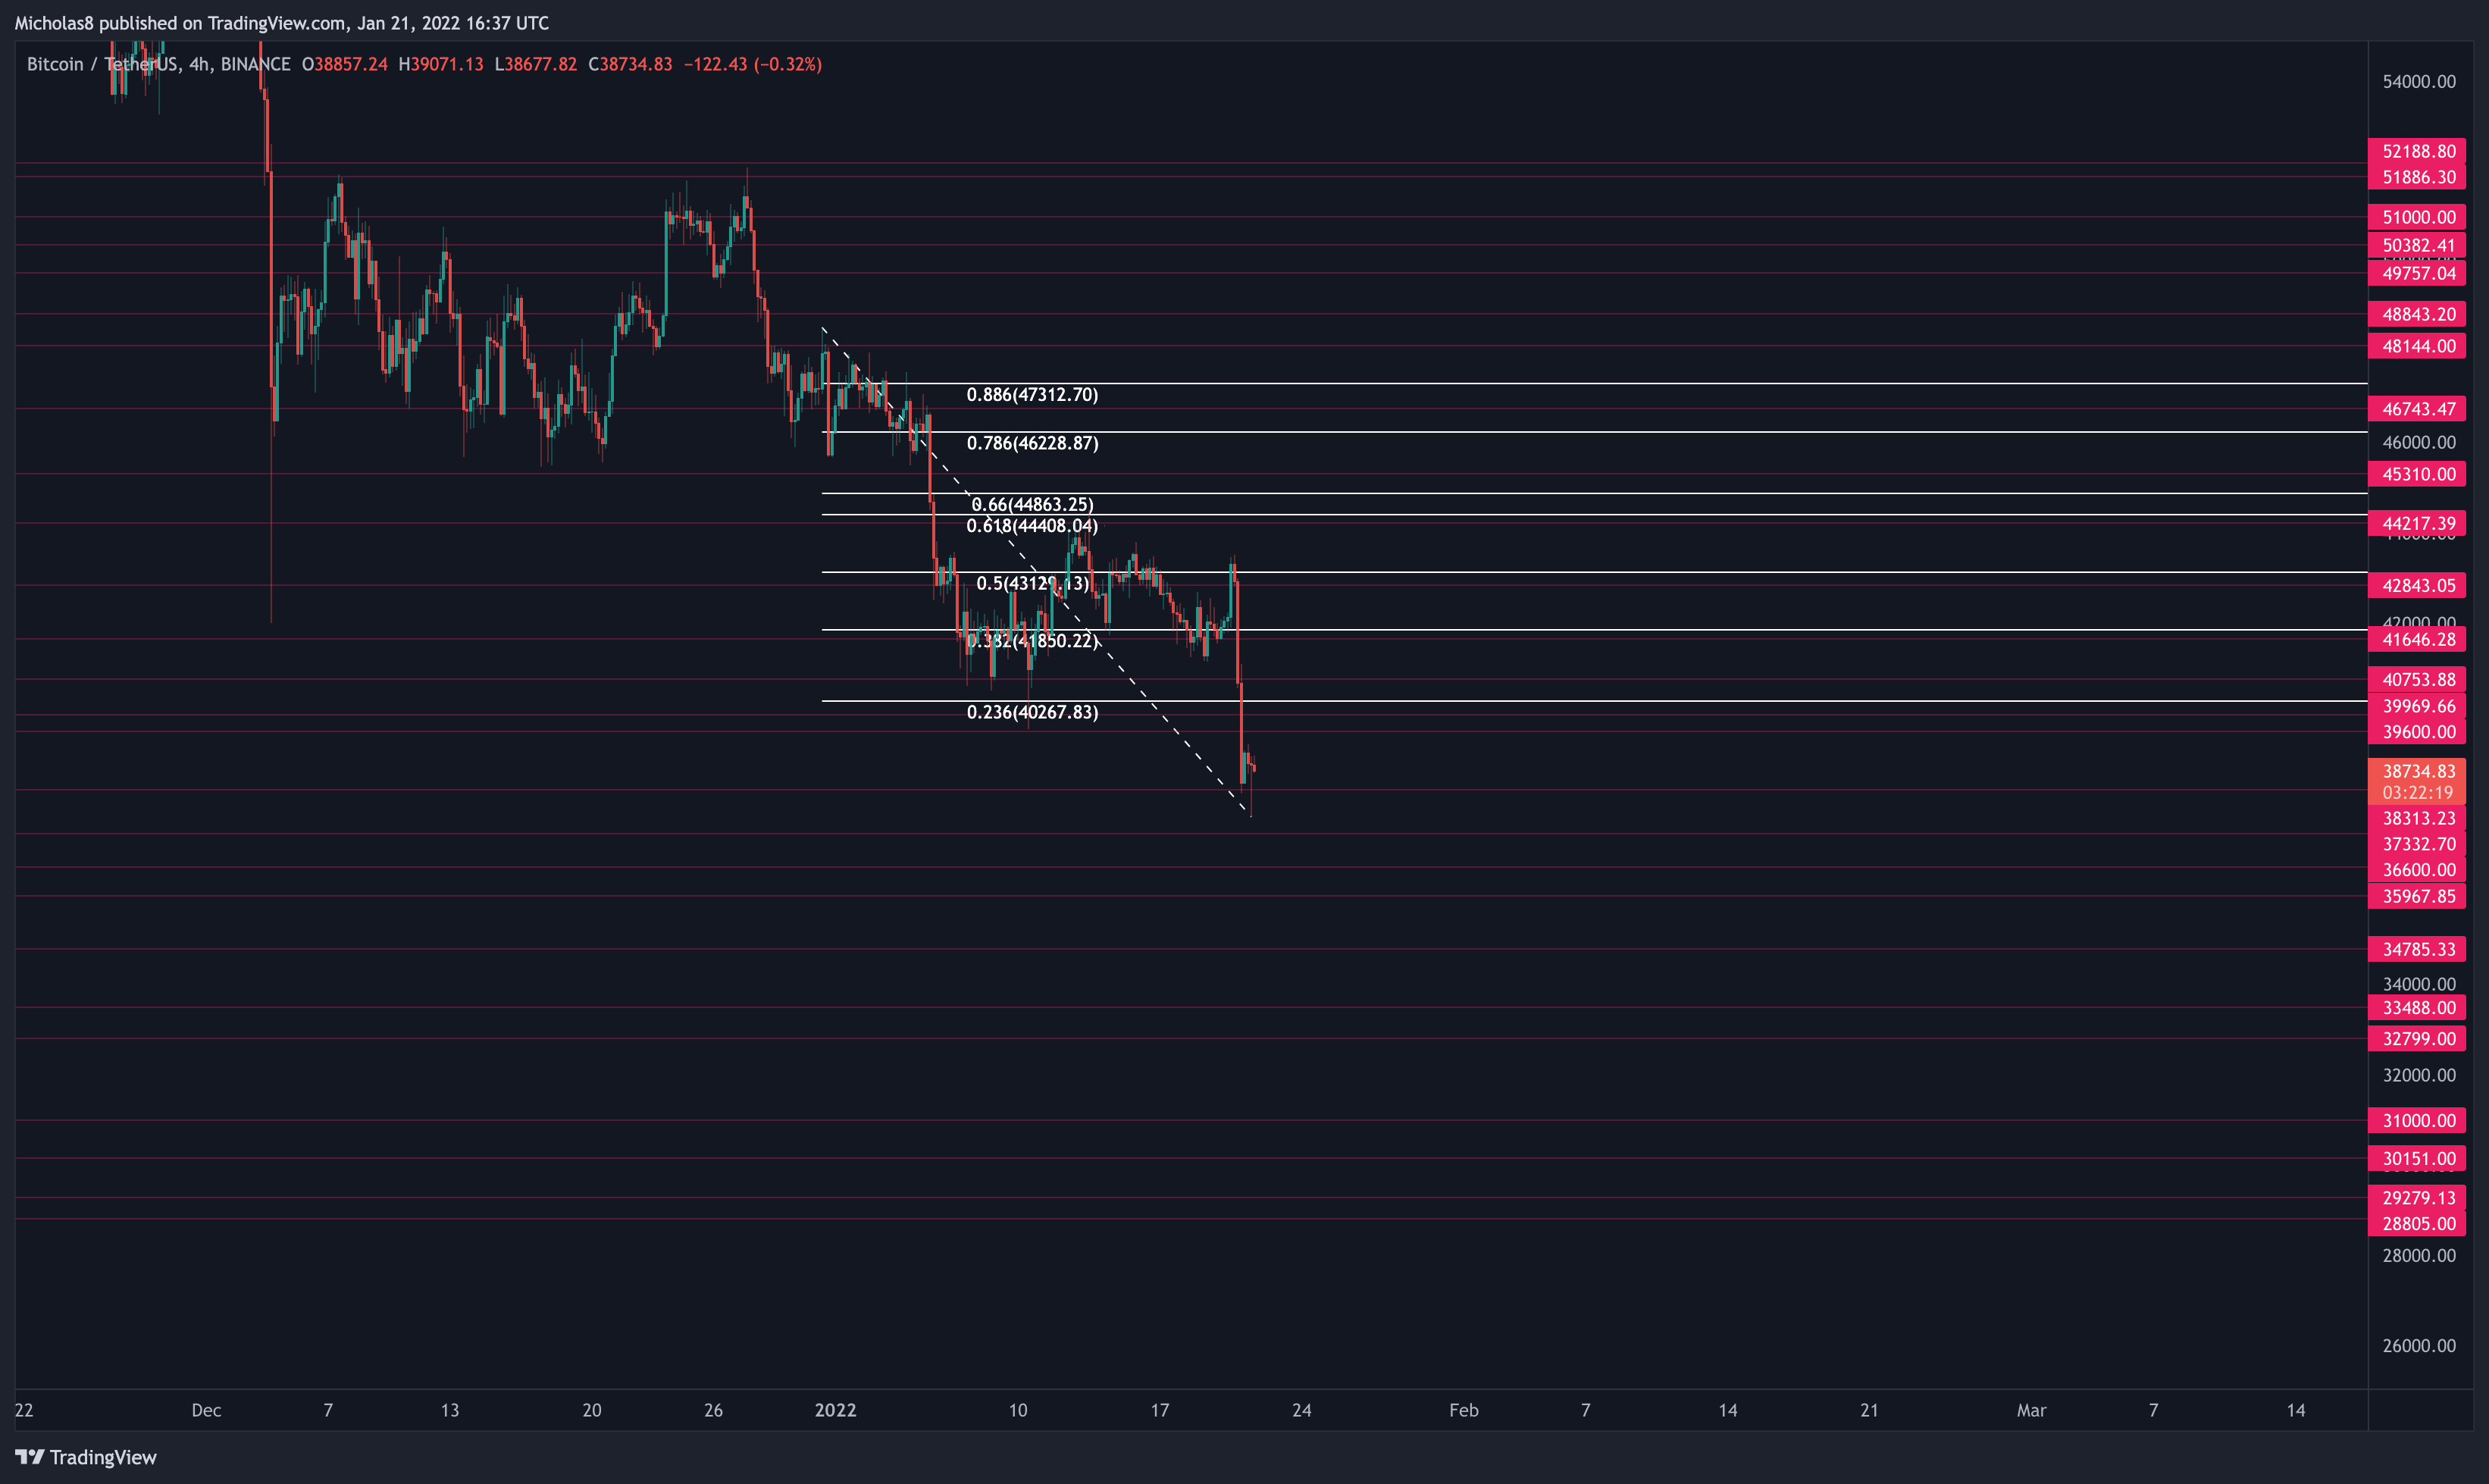
4H Timeframe
28805
29280
30150
31000
32800
33490
34785
35970
36000
37330
38313
39600
39970
40755
41645
42845
44215
45310
46745
48145
48845
49755
50380
51000
51885
52190
Fibonacci levels
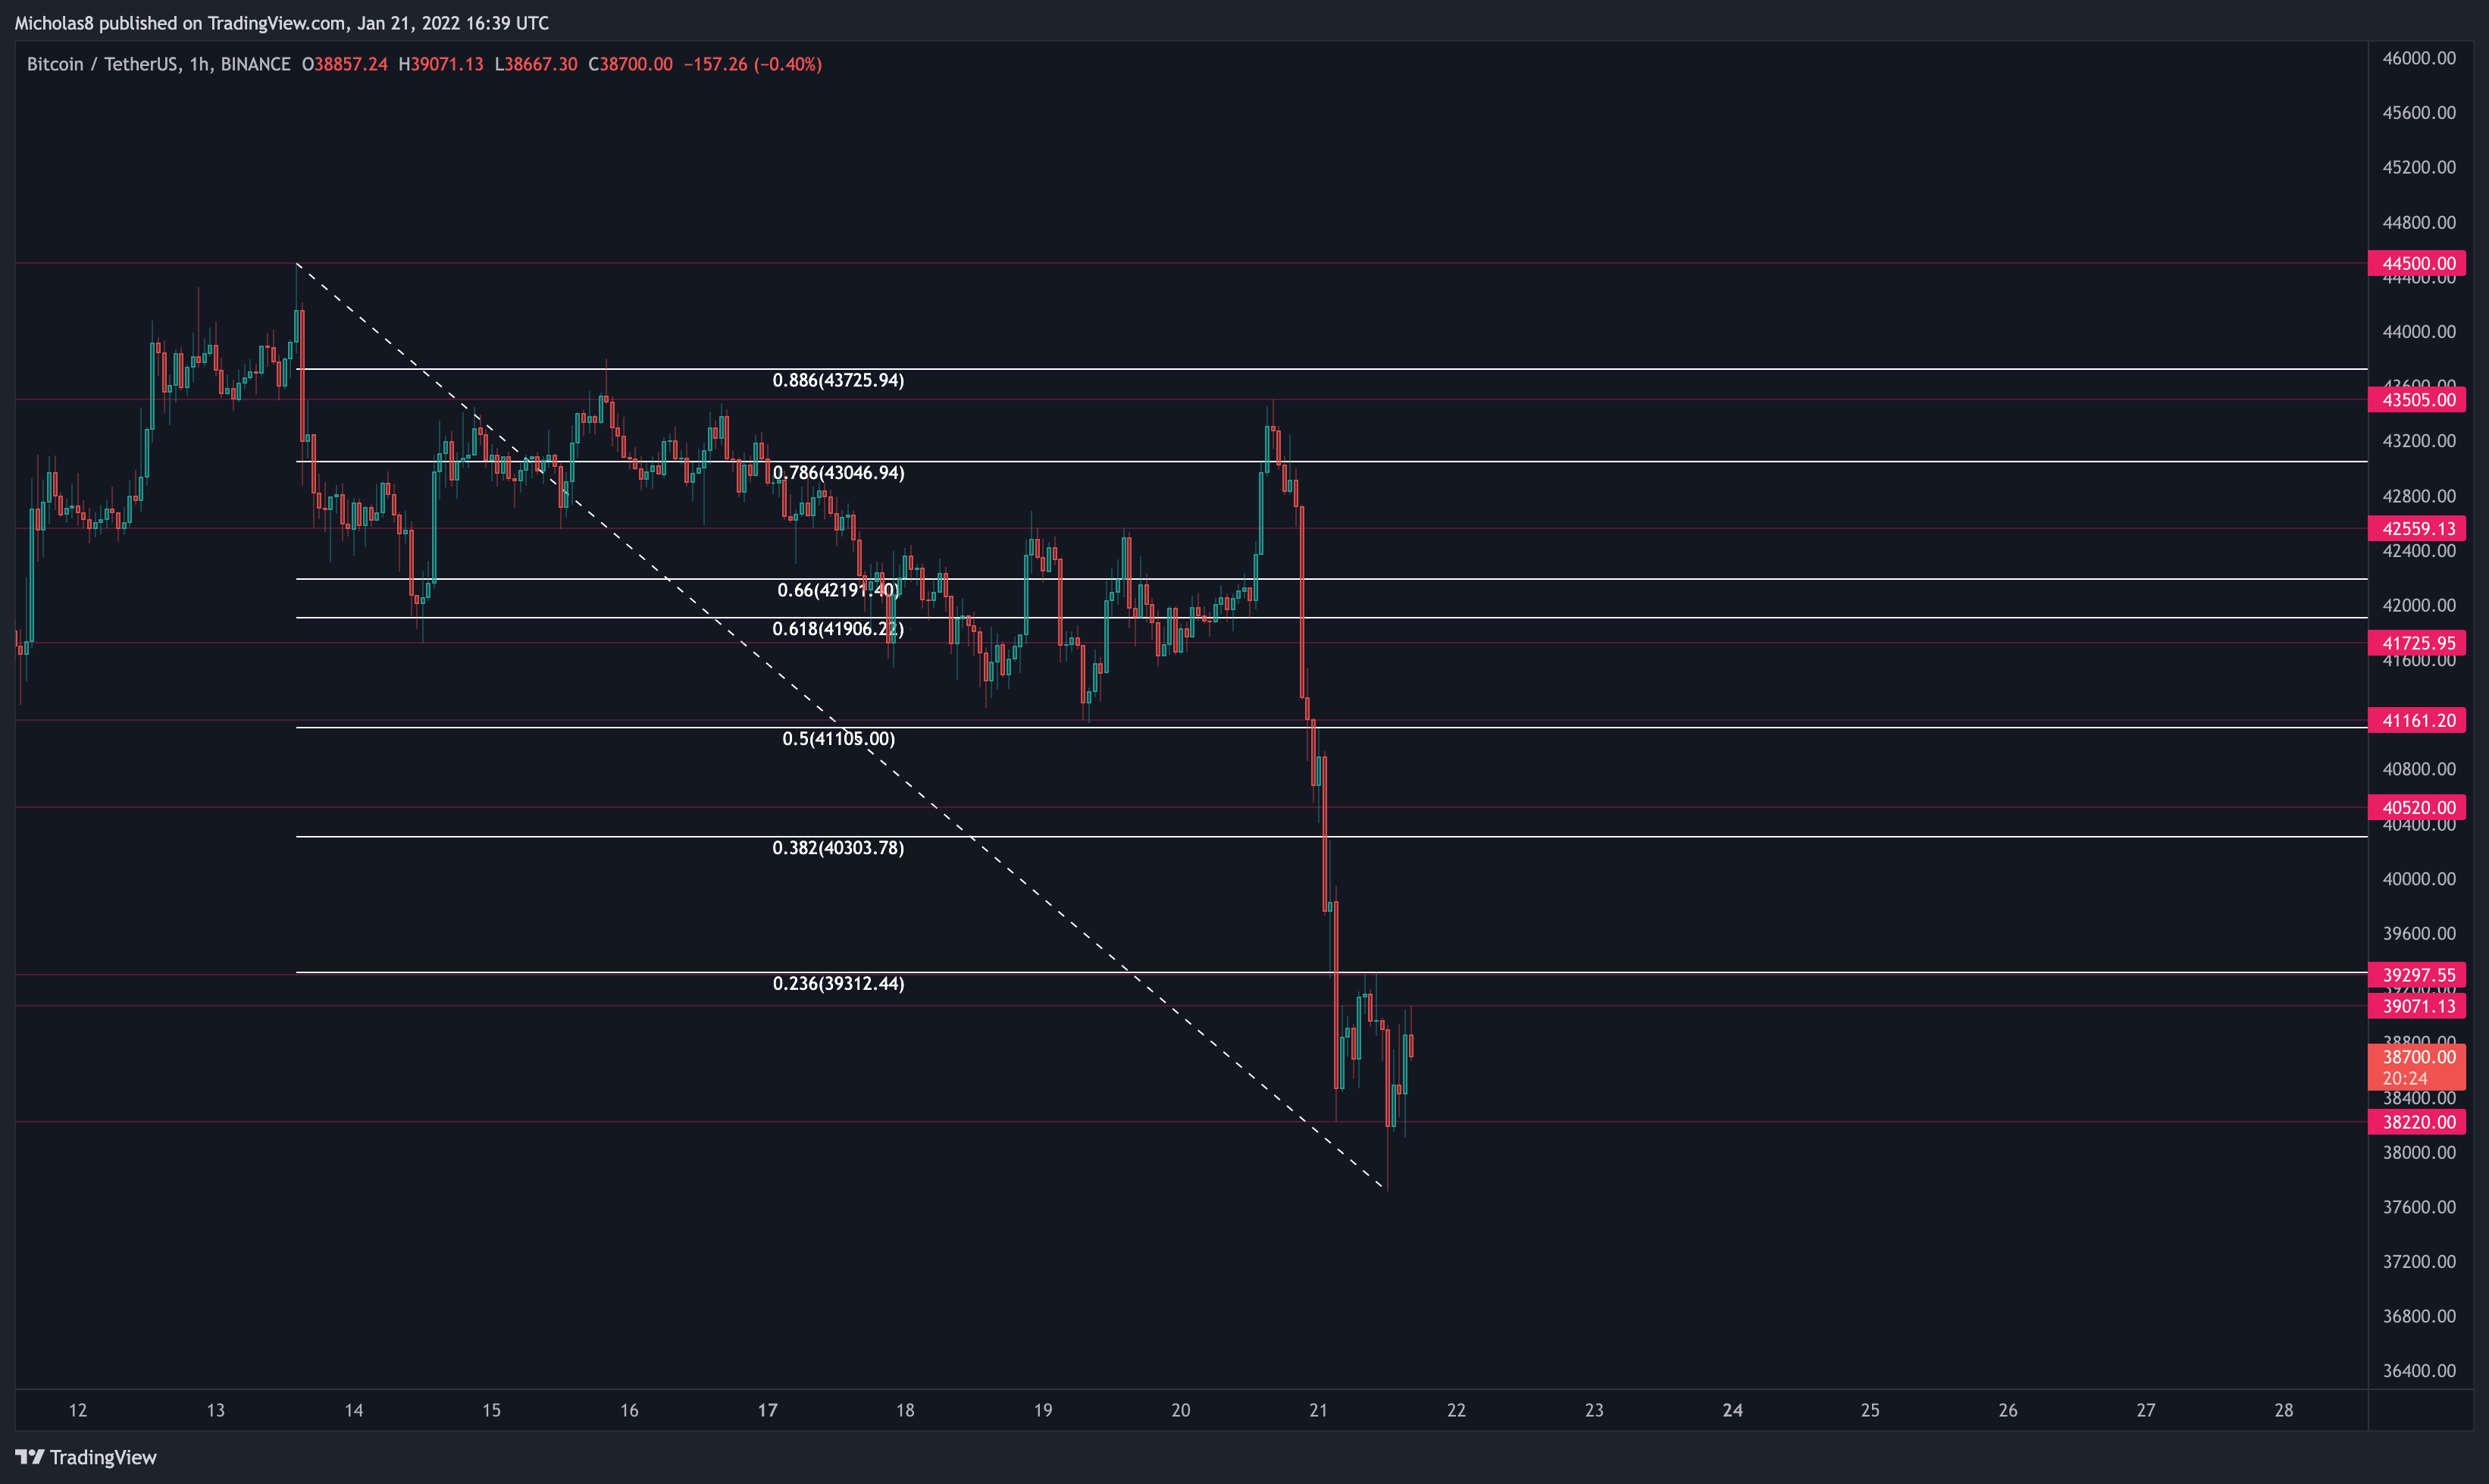
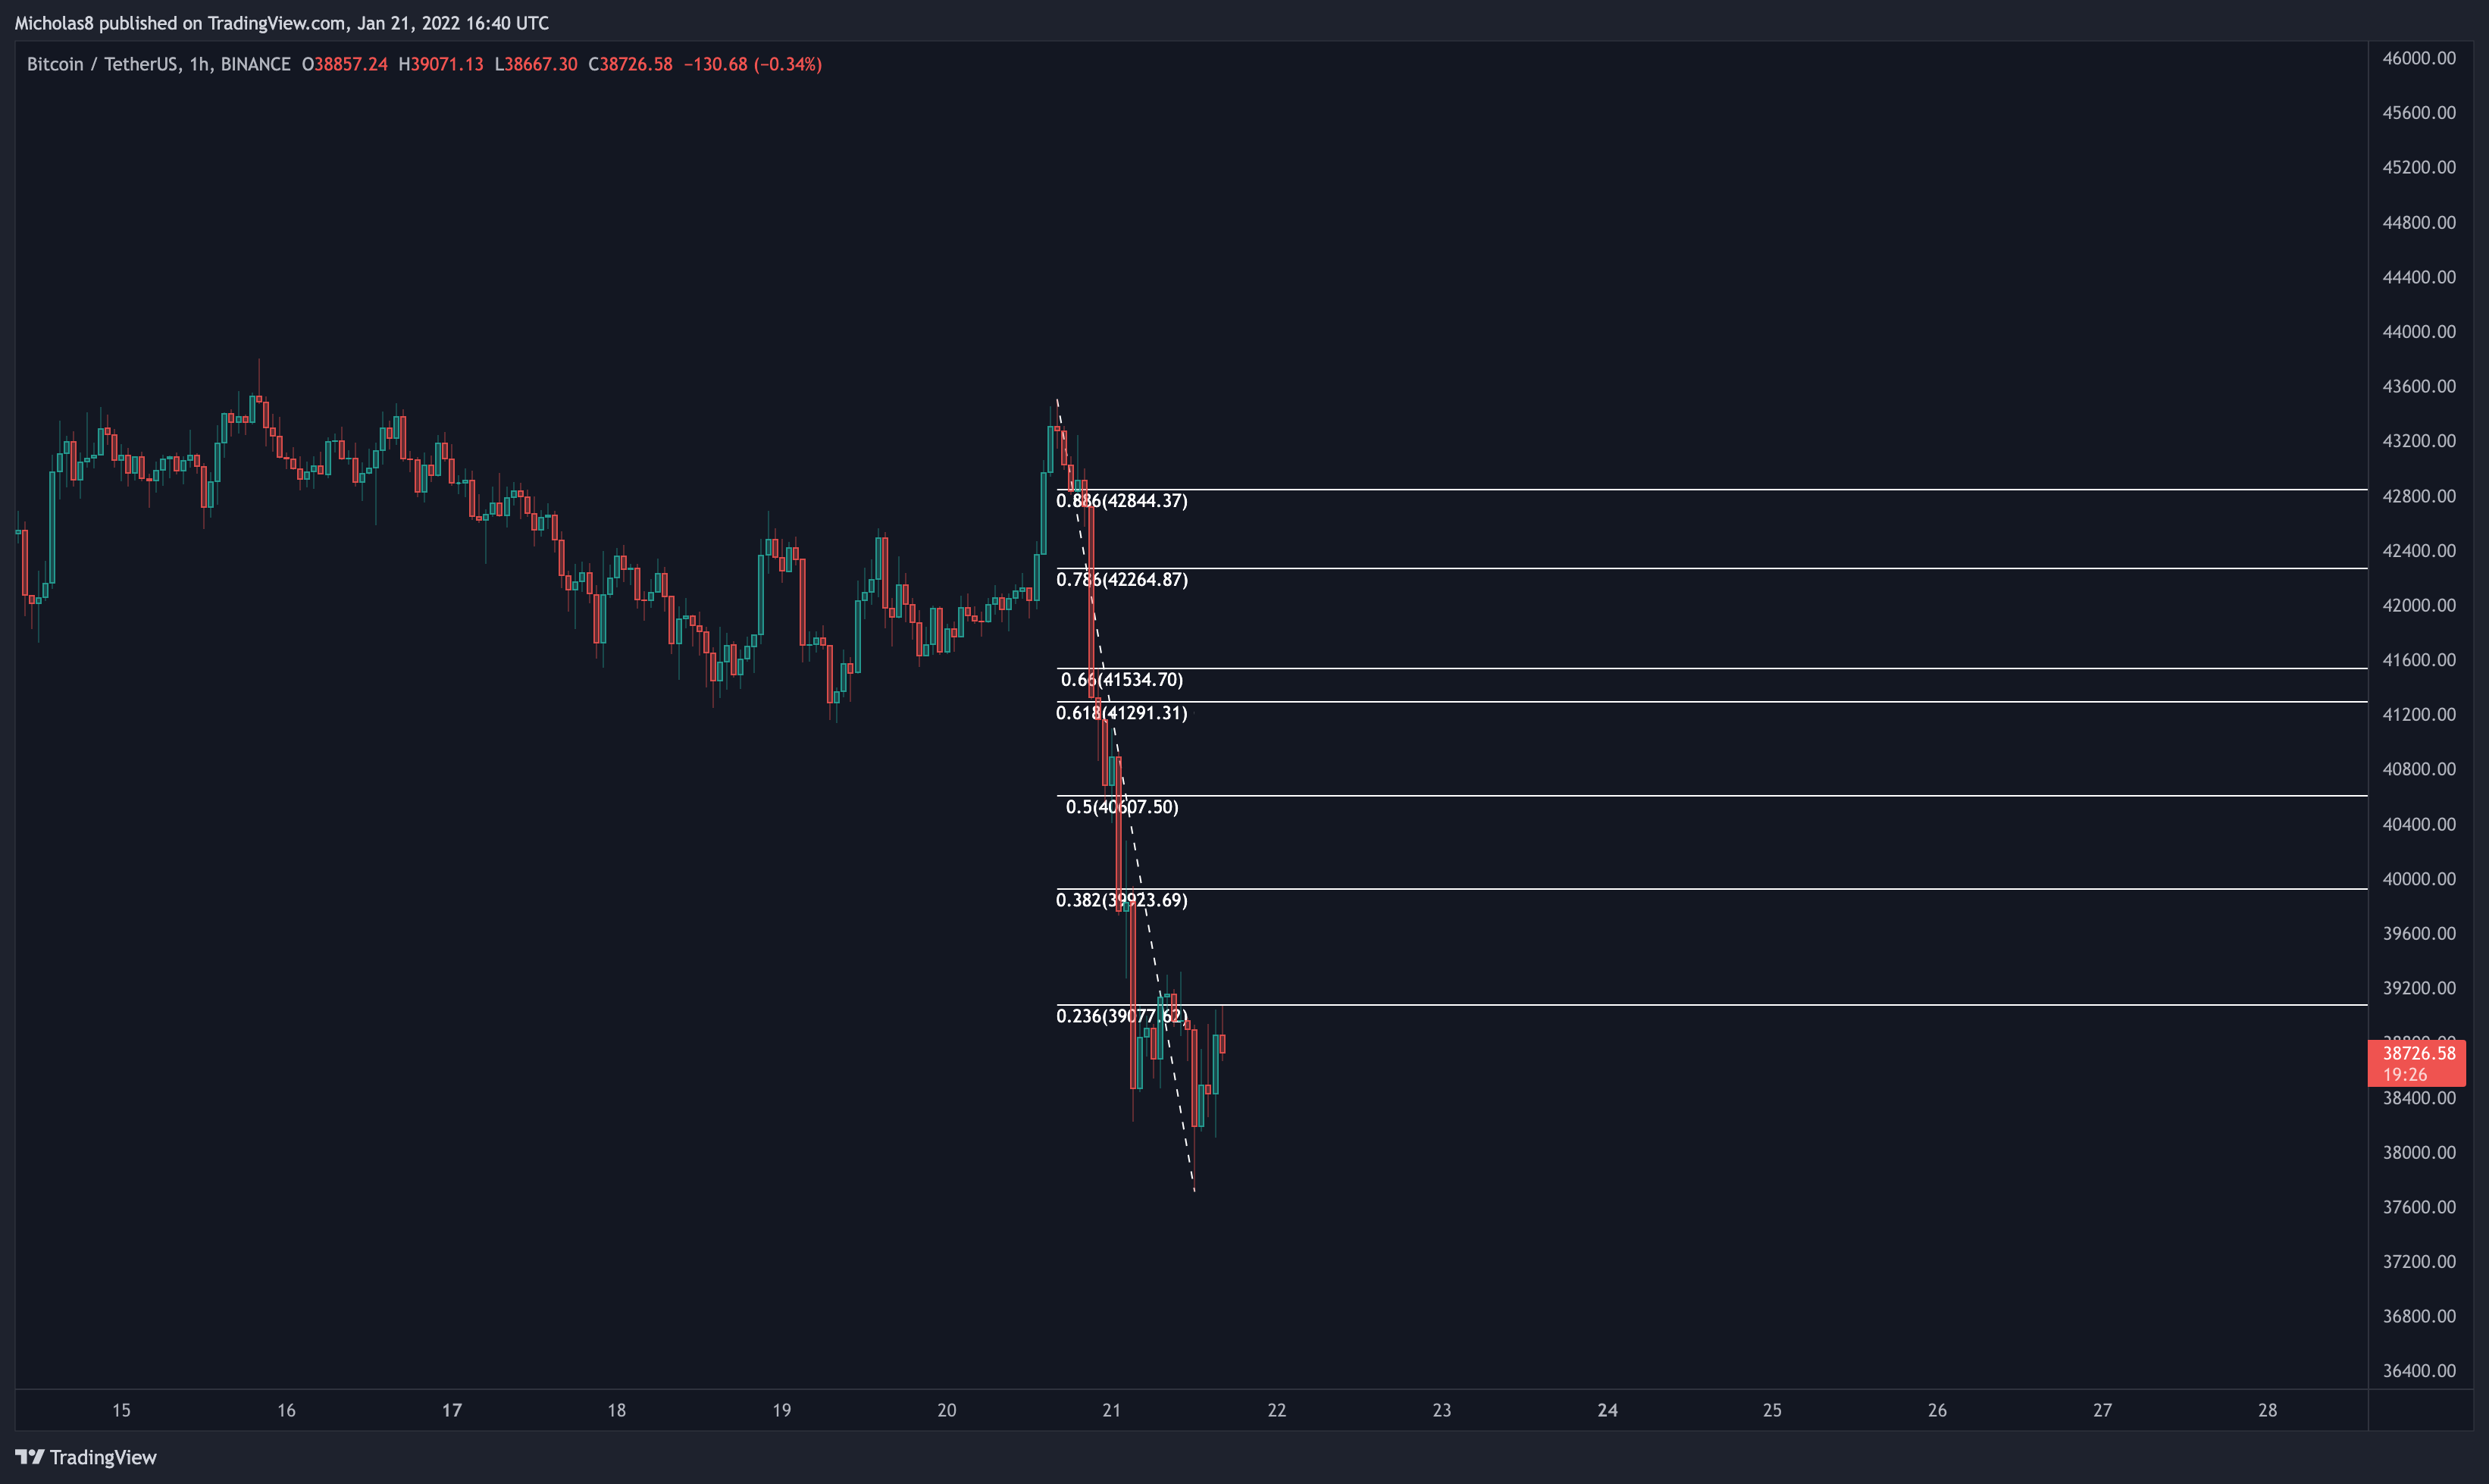
1-hour Timeframe
38220
39070
39300
40520
41160
41725
42560
43505
44500
Fibonacci levels
FINAL THOUGHTS
RECAP FROM LAST NIGHT
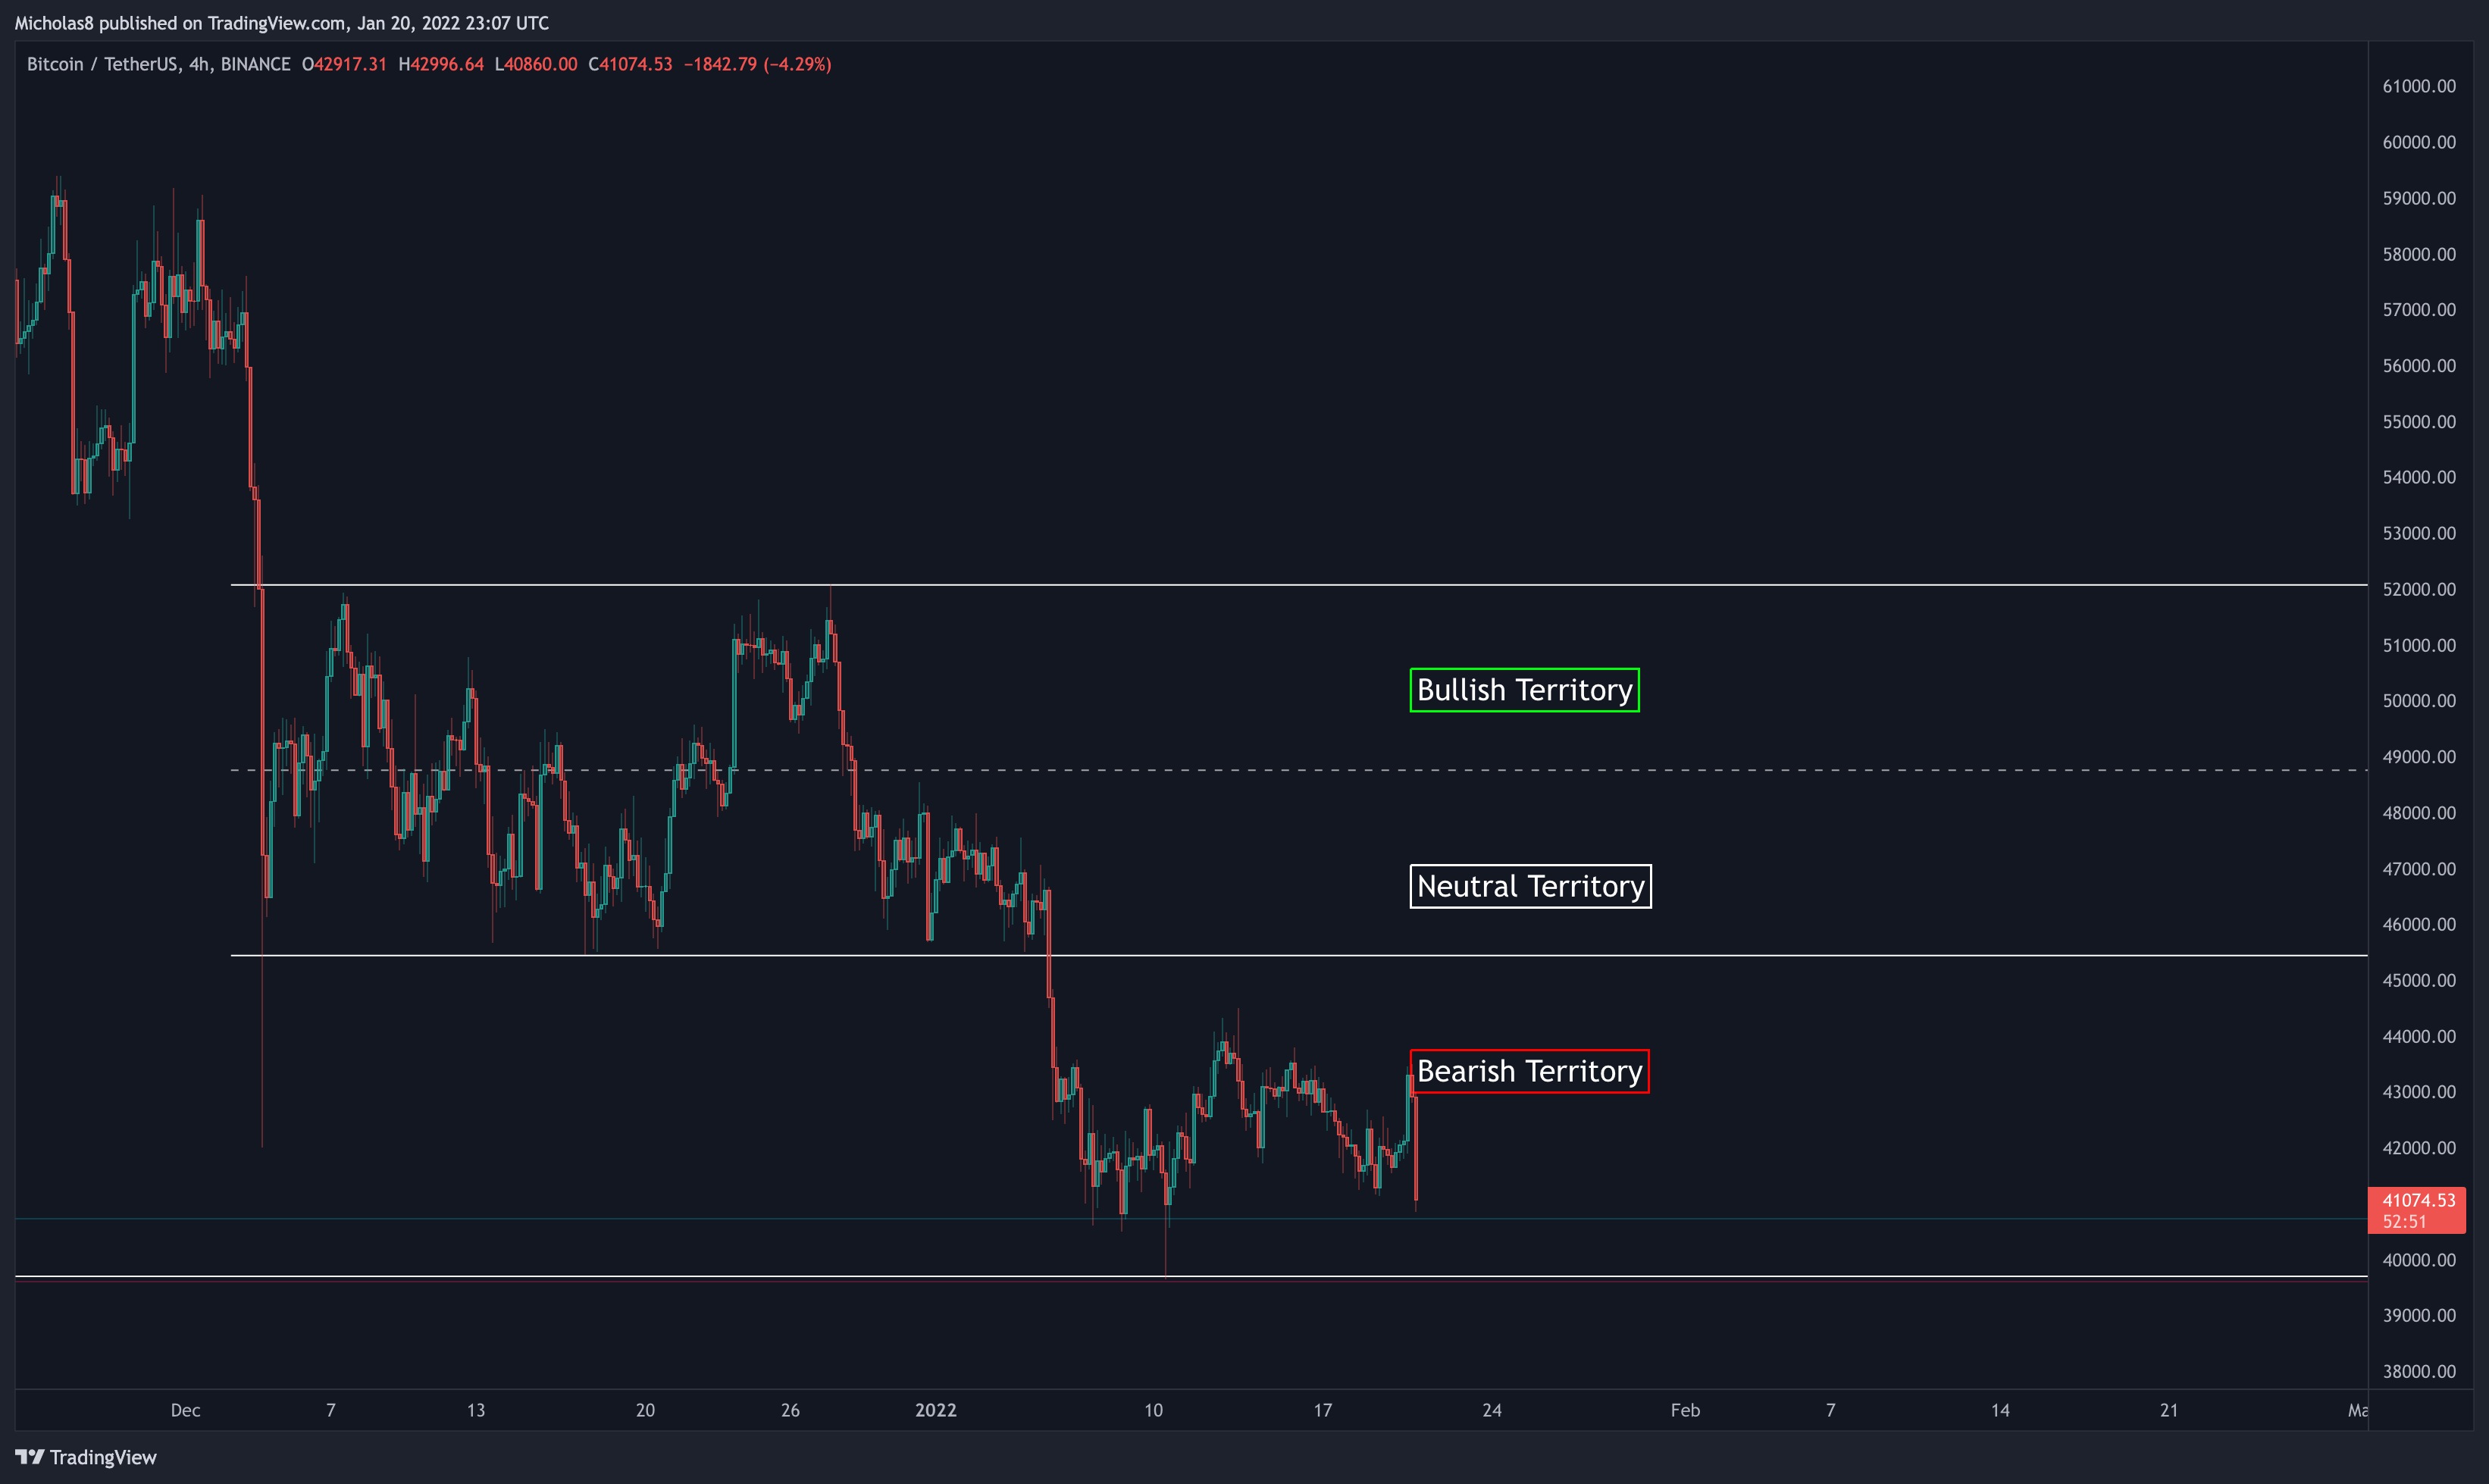
Bitcoin continues to trade within the Bearish Territory.
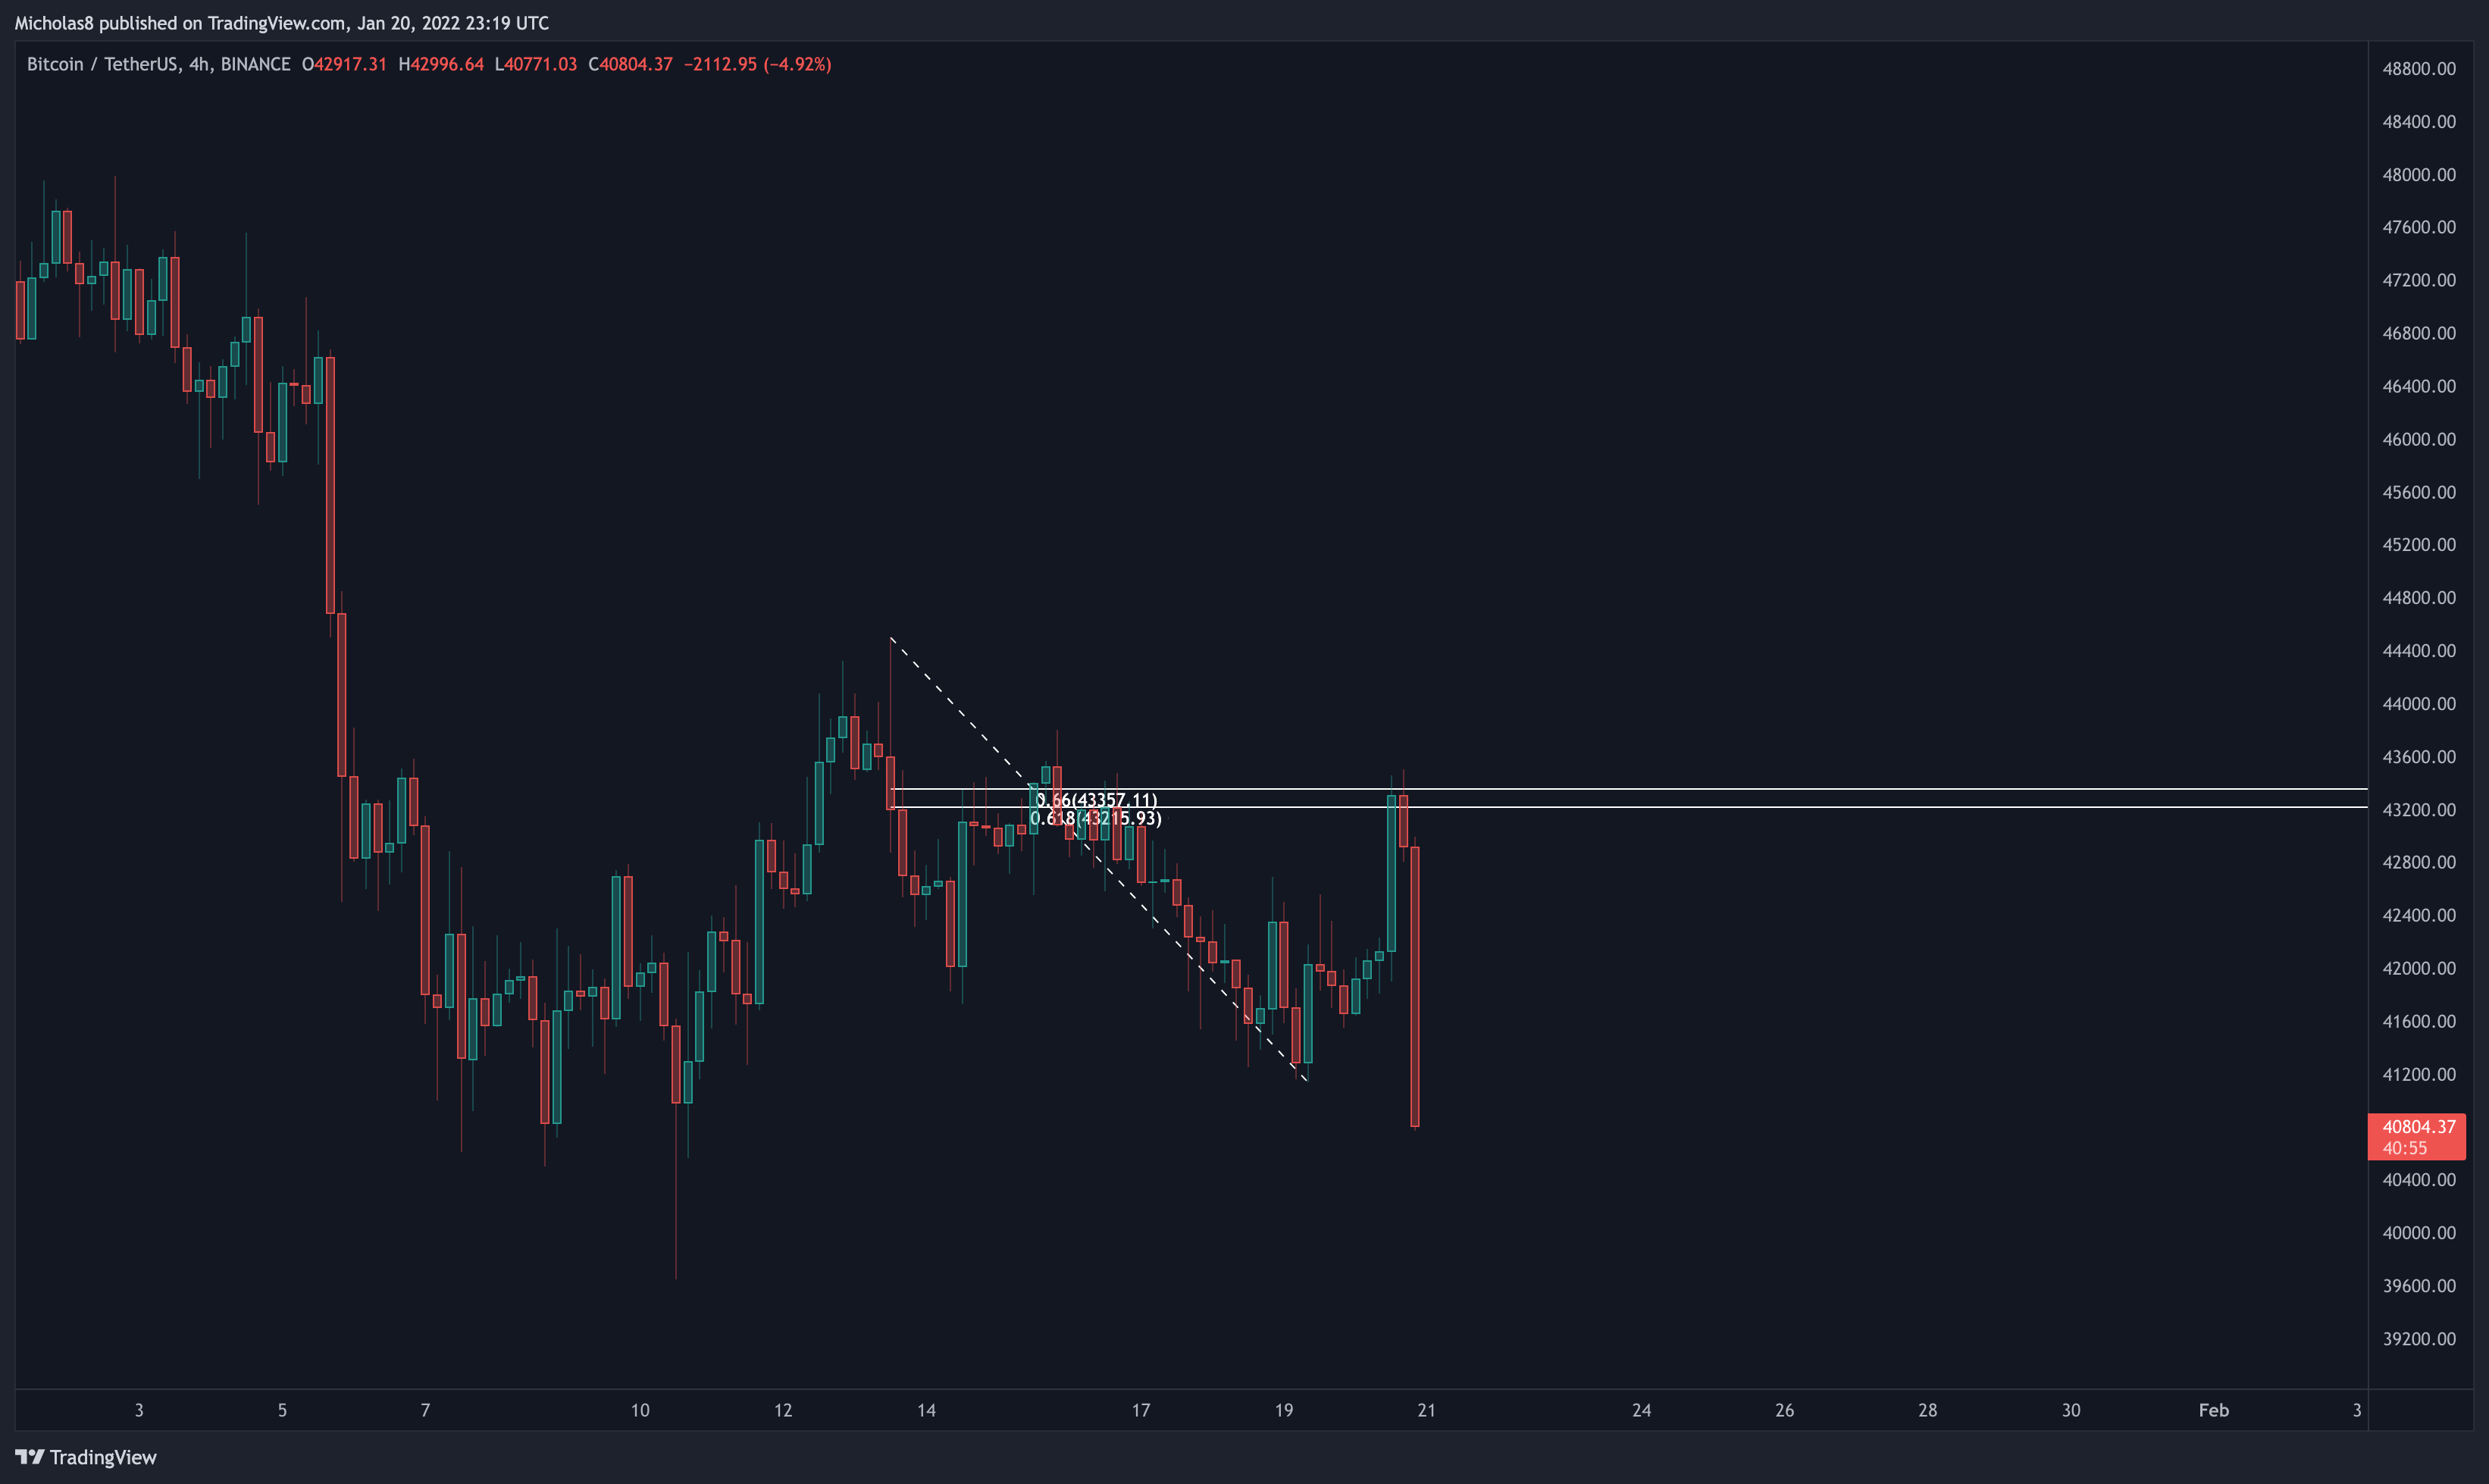
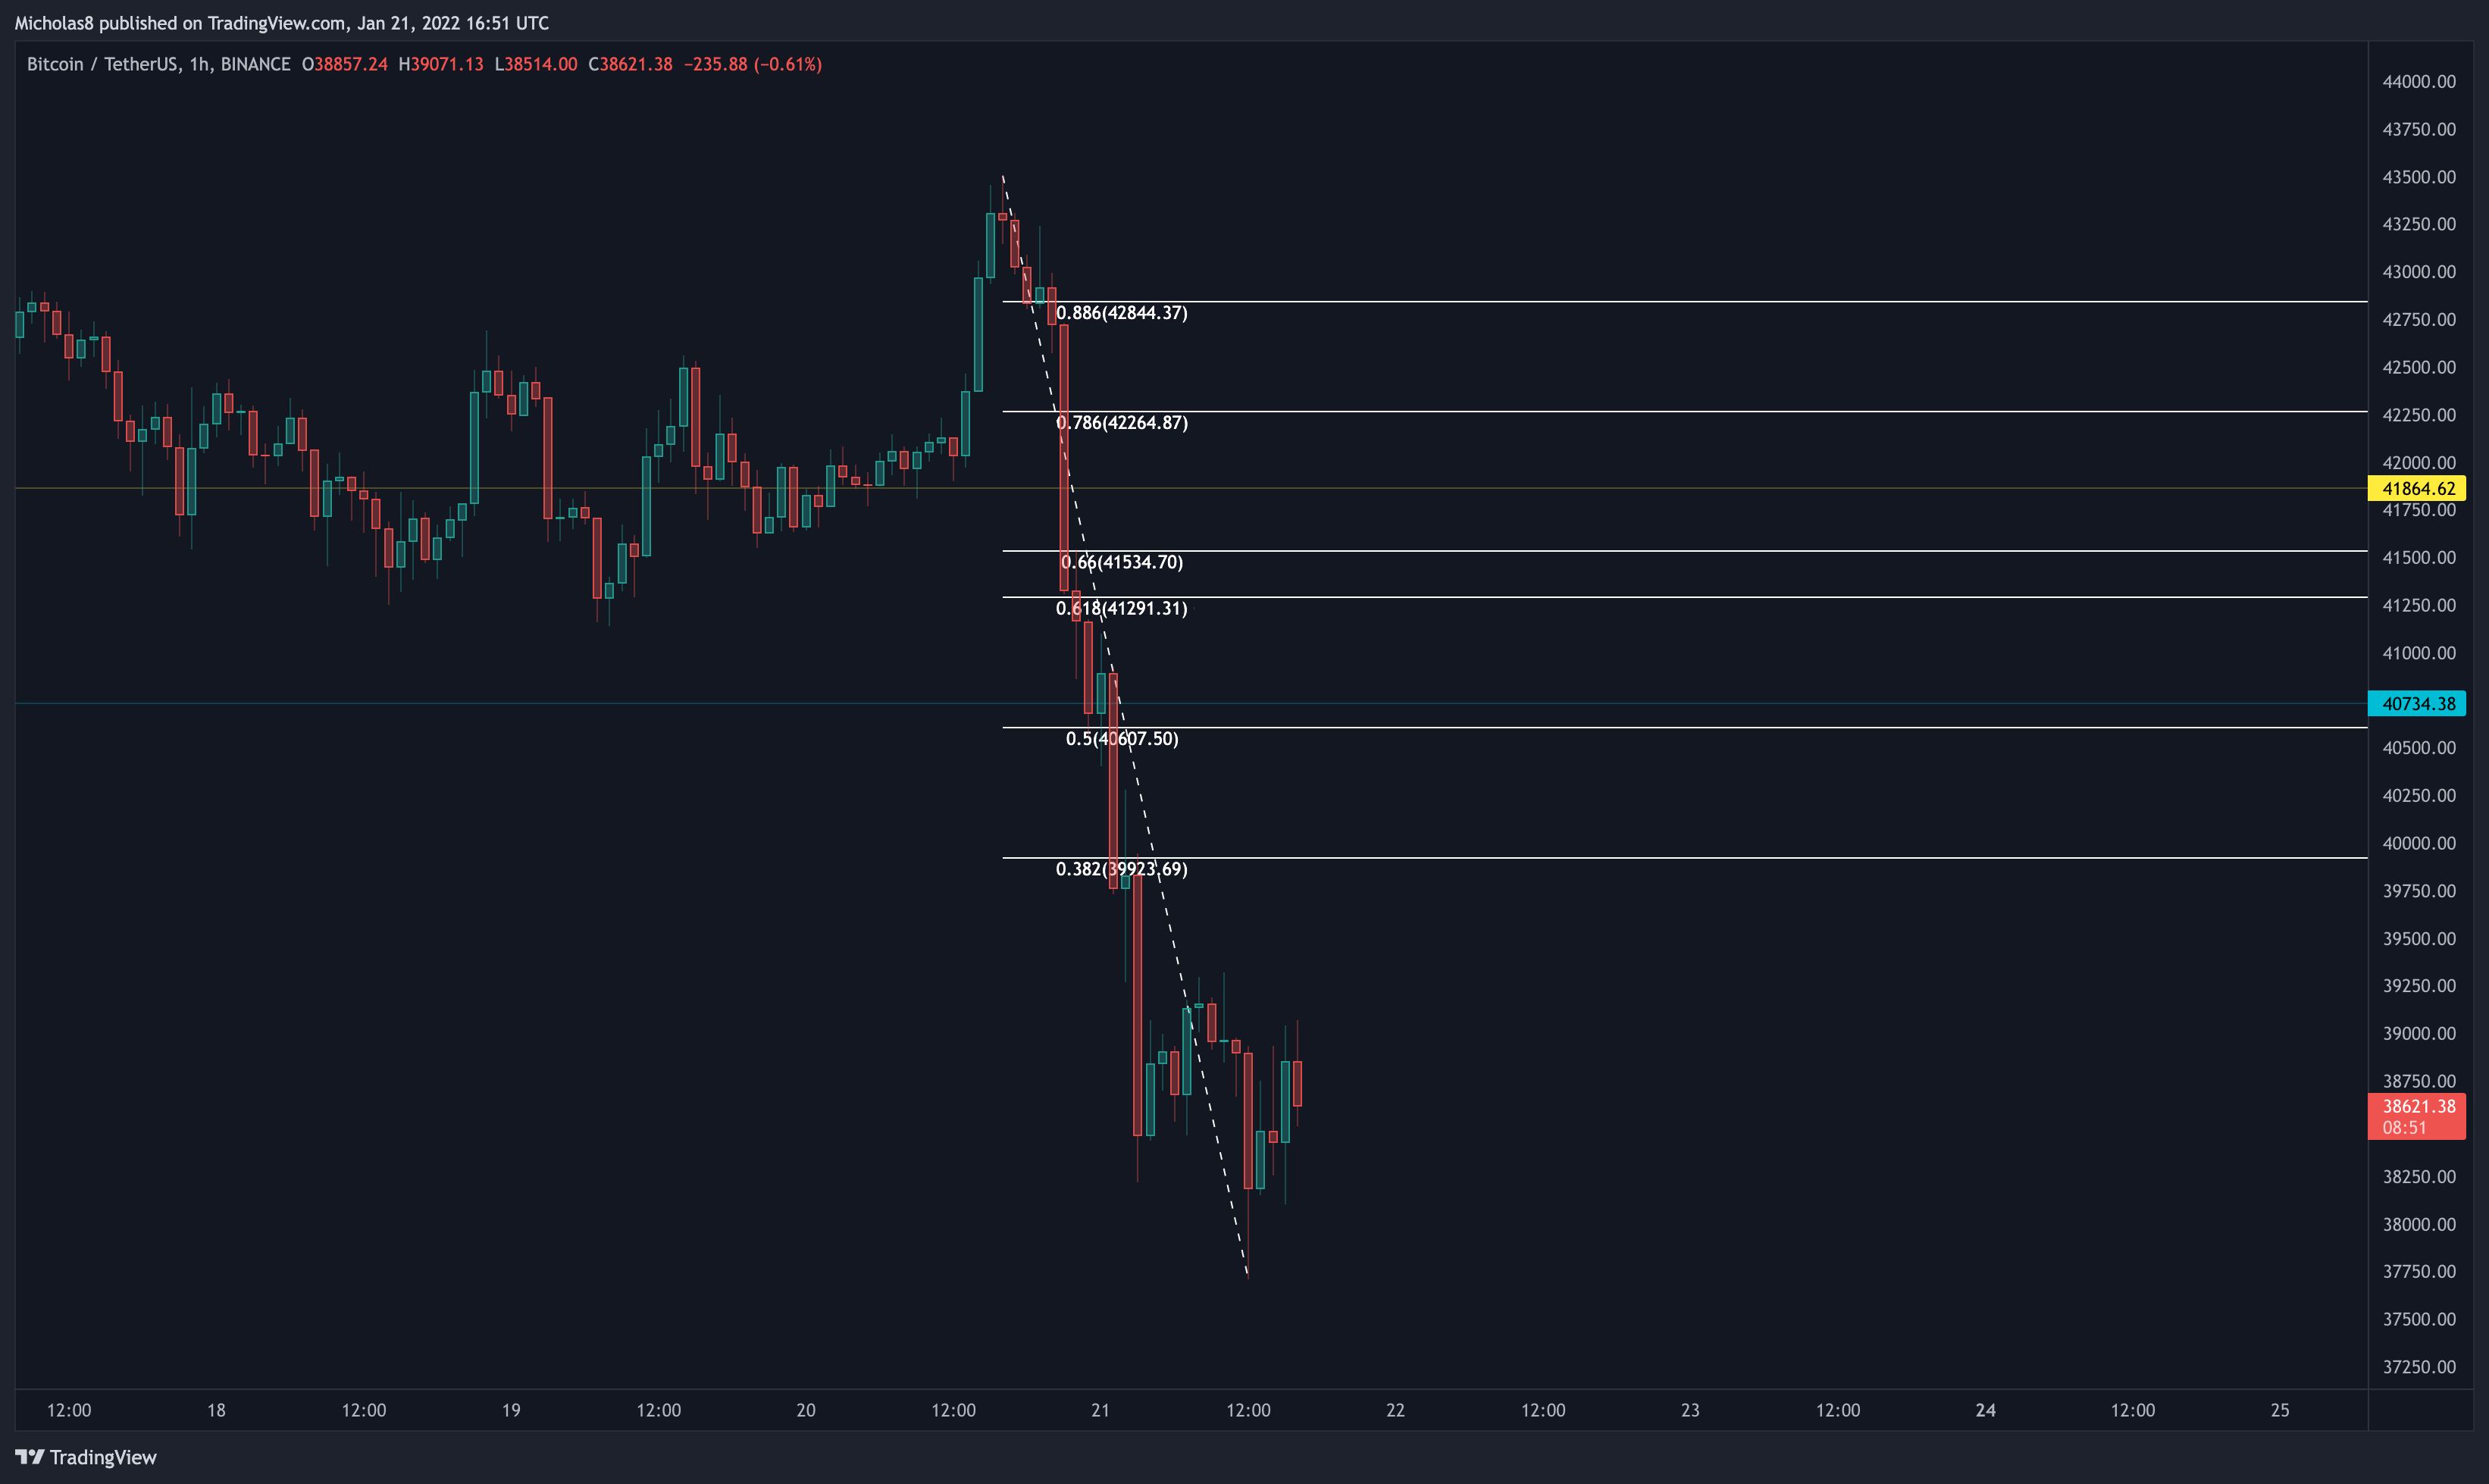
We have been rejected from the Golden Pocket from the report earlier today. Currently, the move is still playing out.
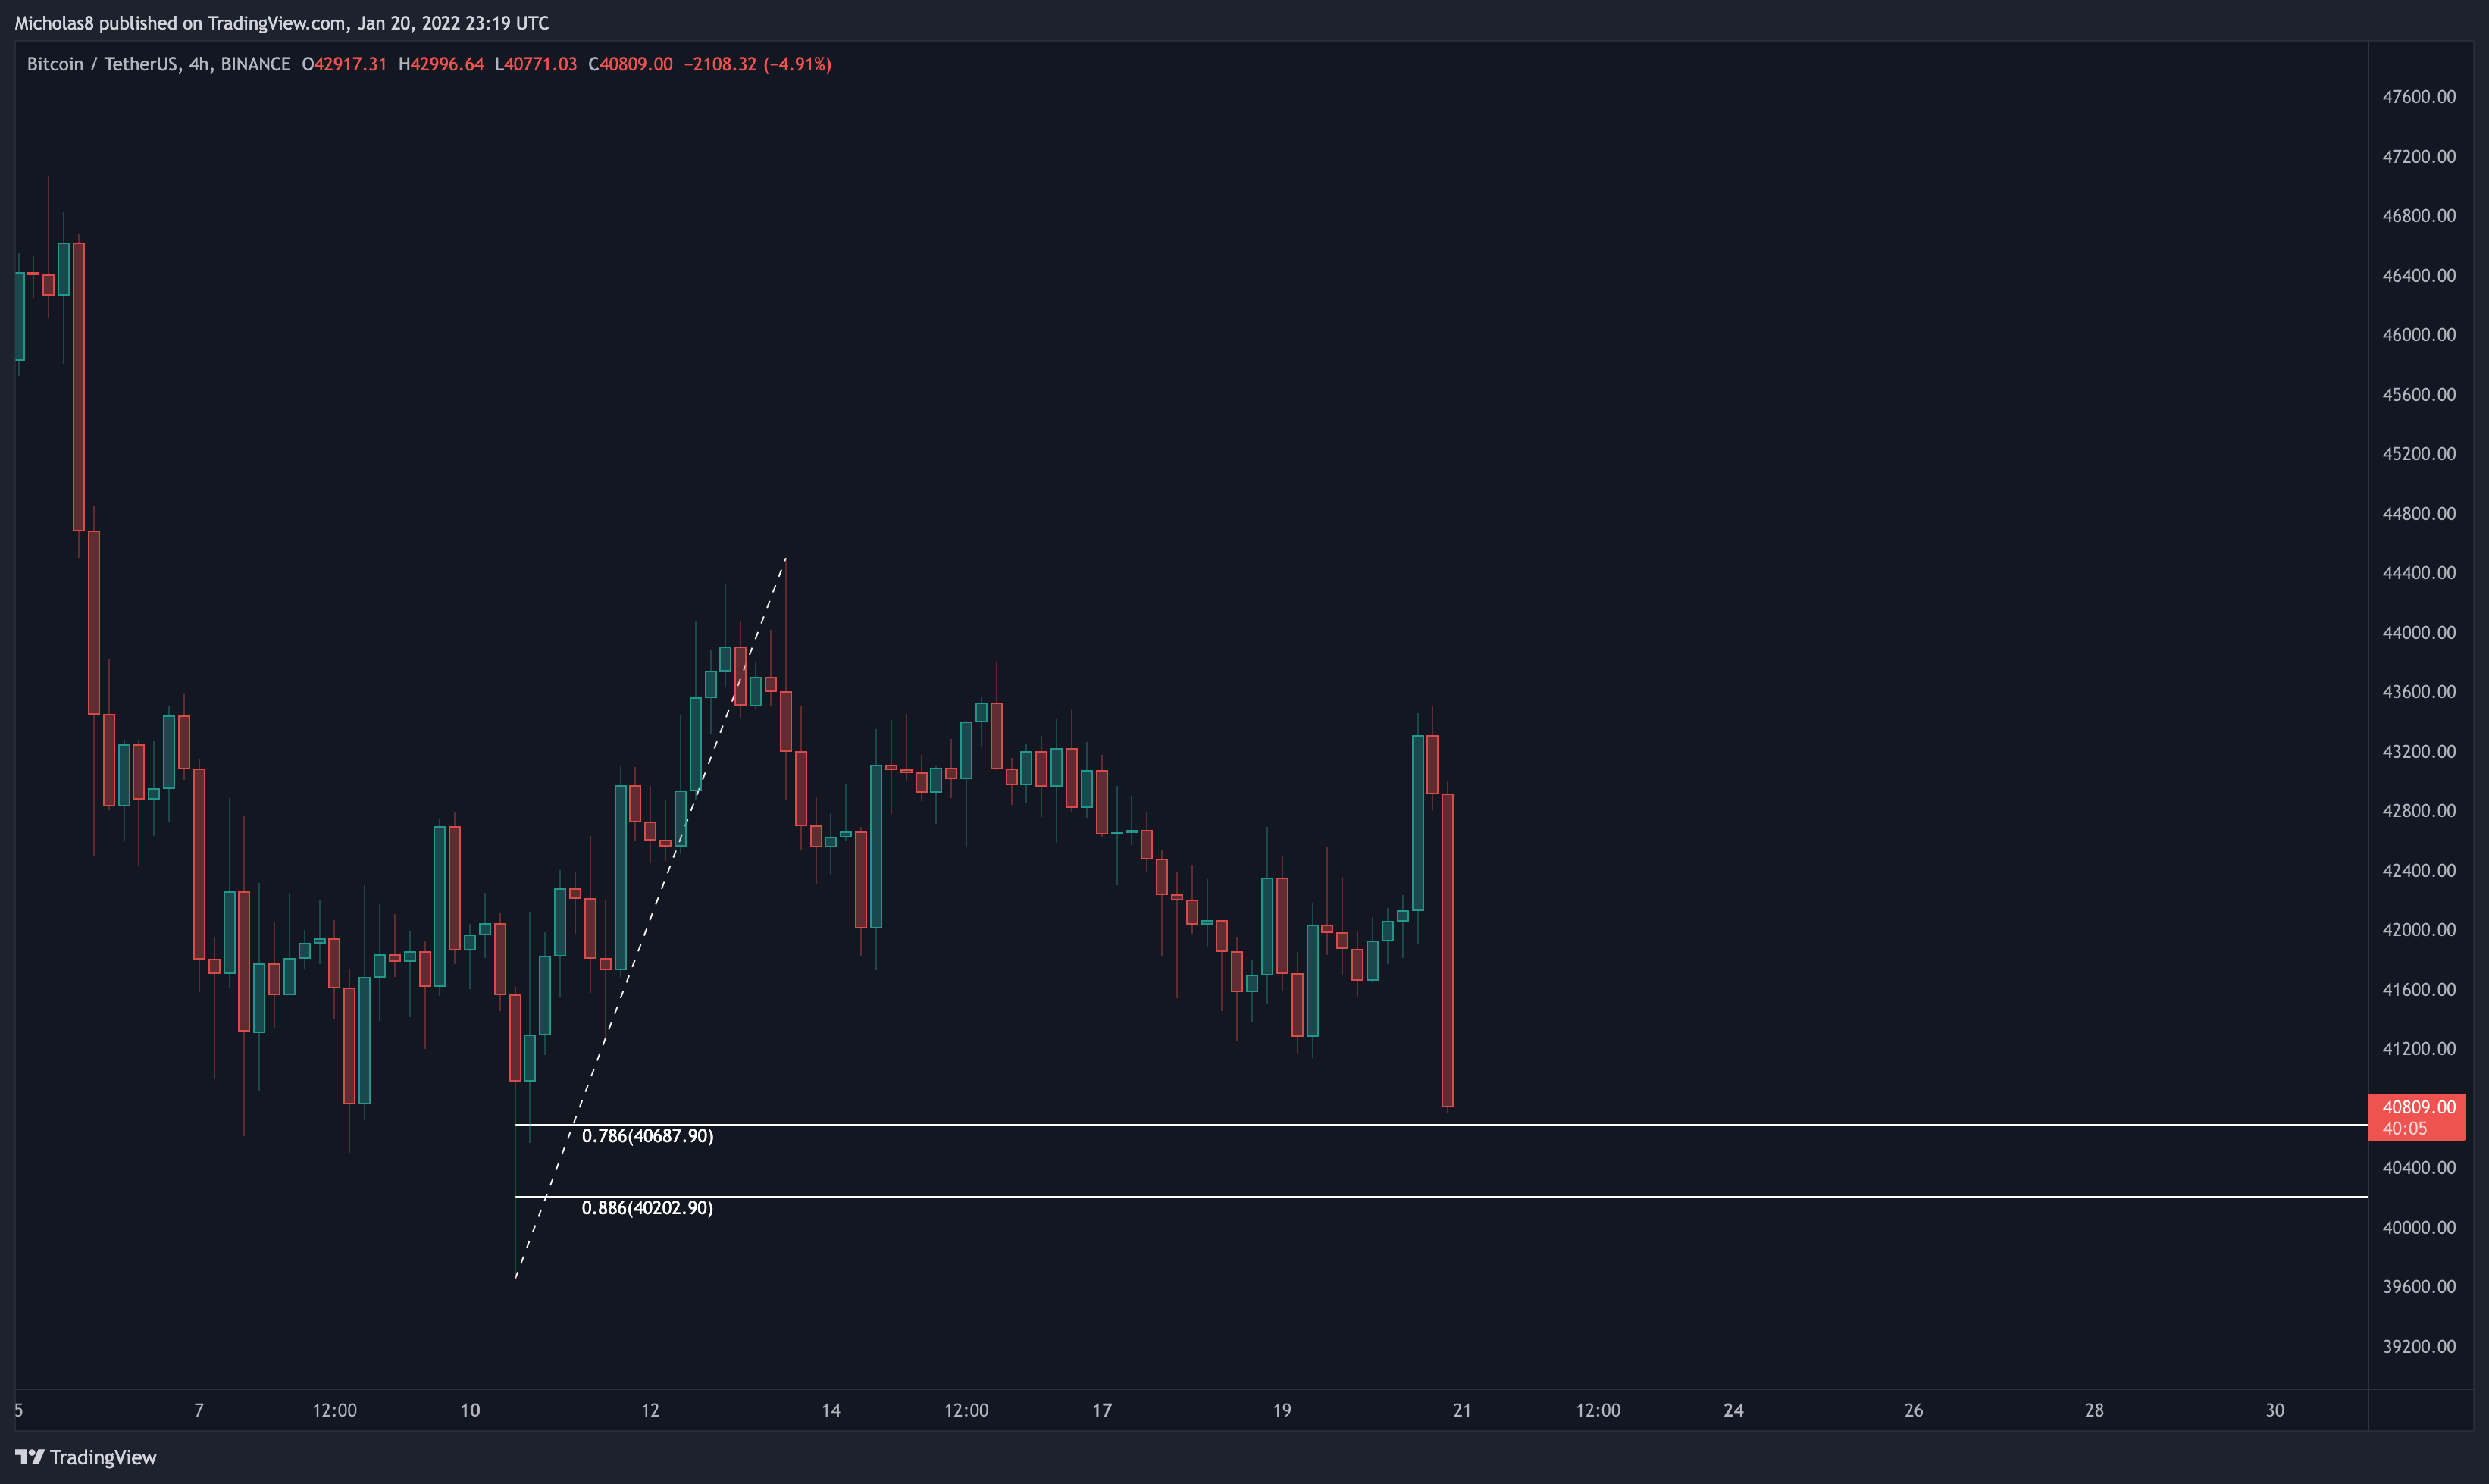
Where can we expect the dumping to end? Well, there are two Fibonacci Levels right below us that may serve as support.
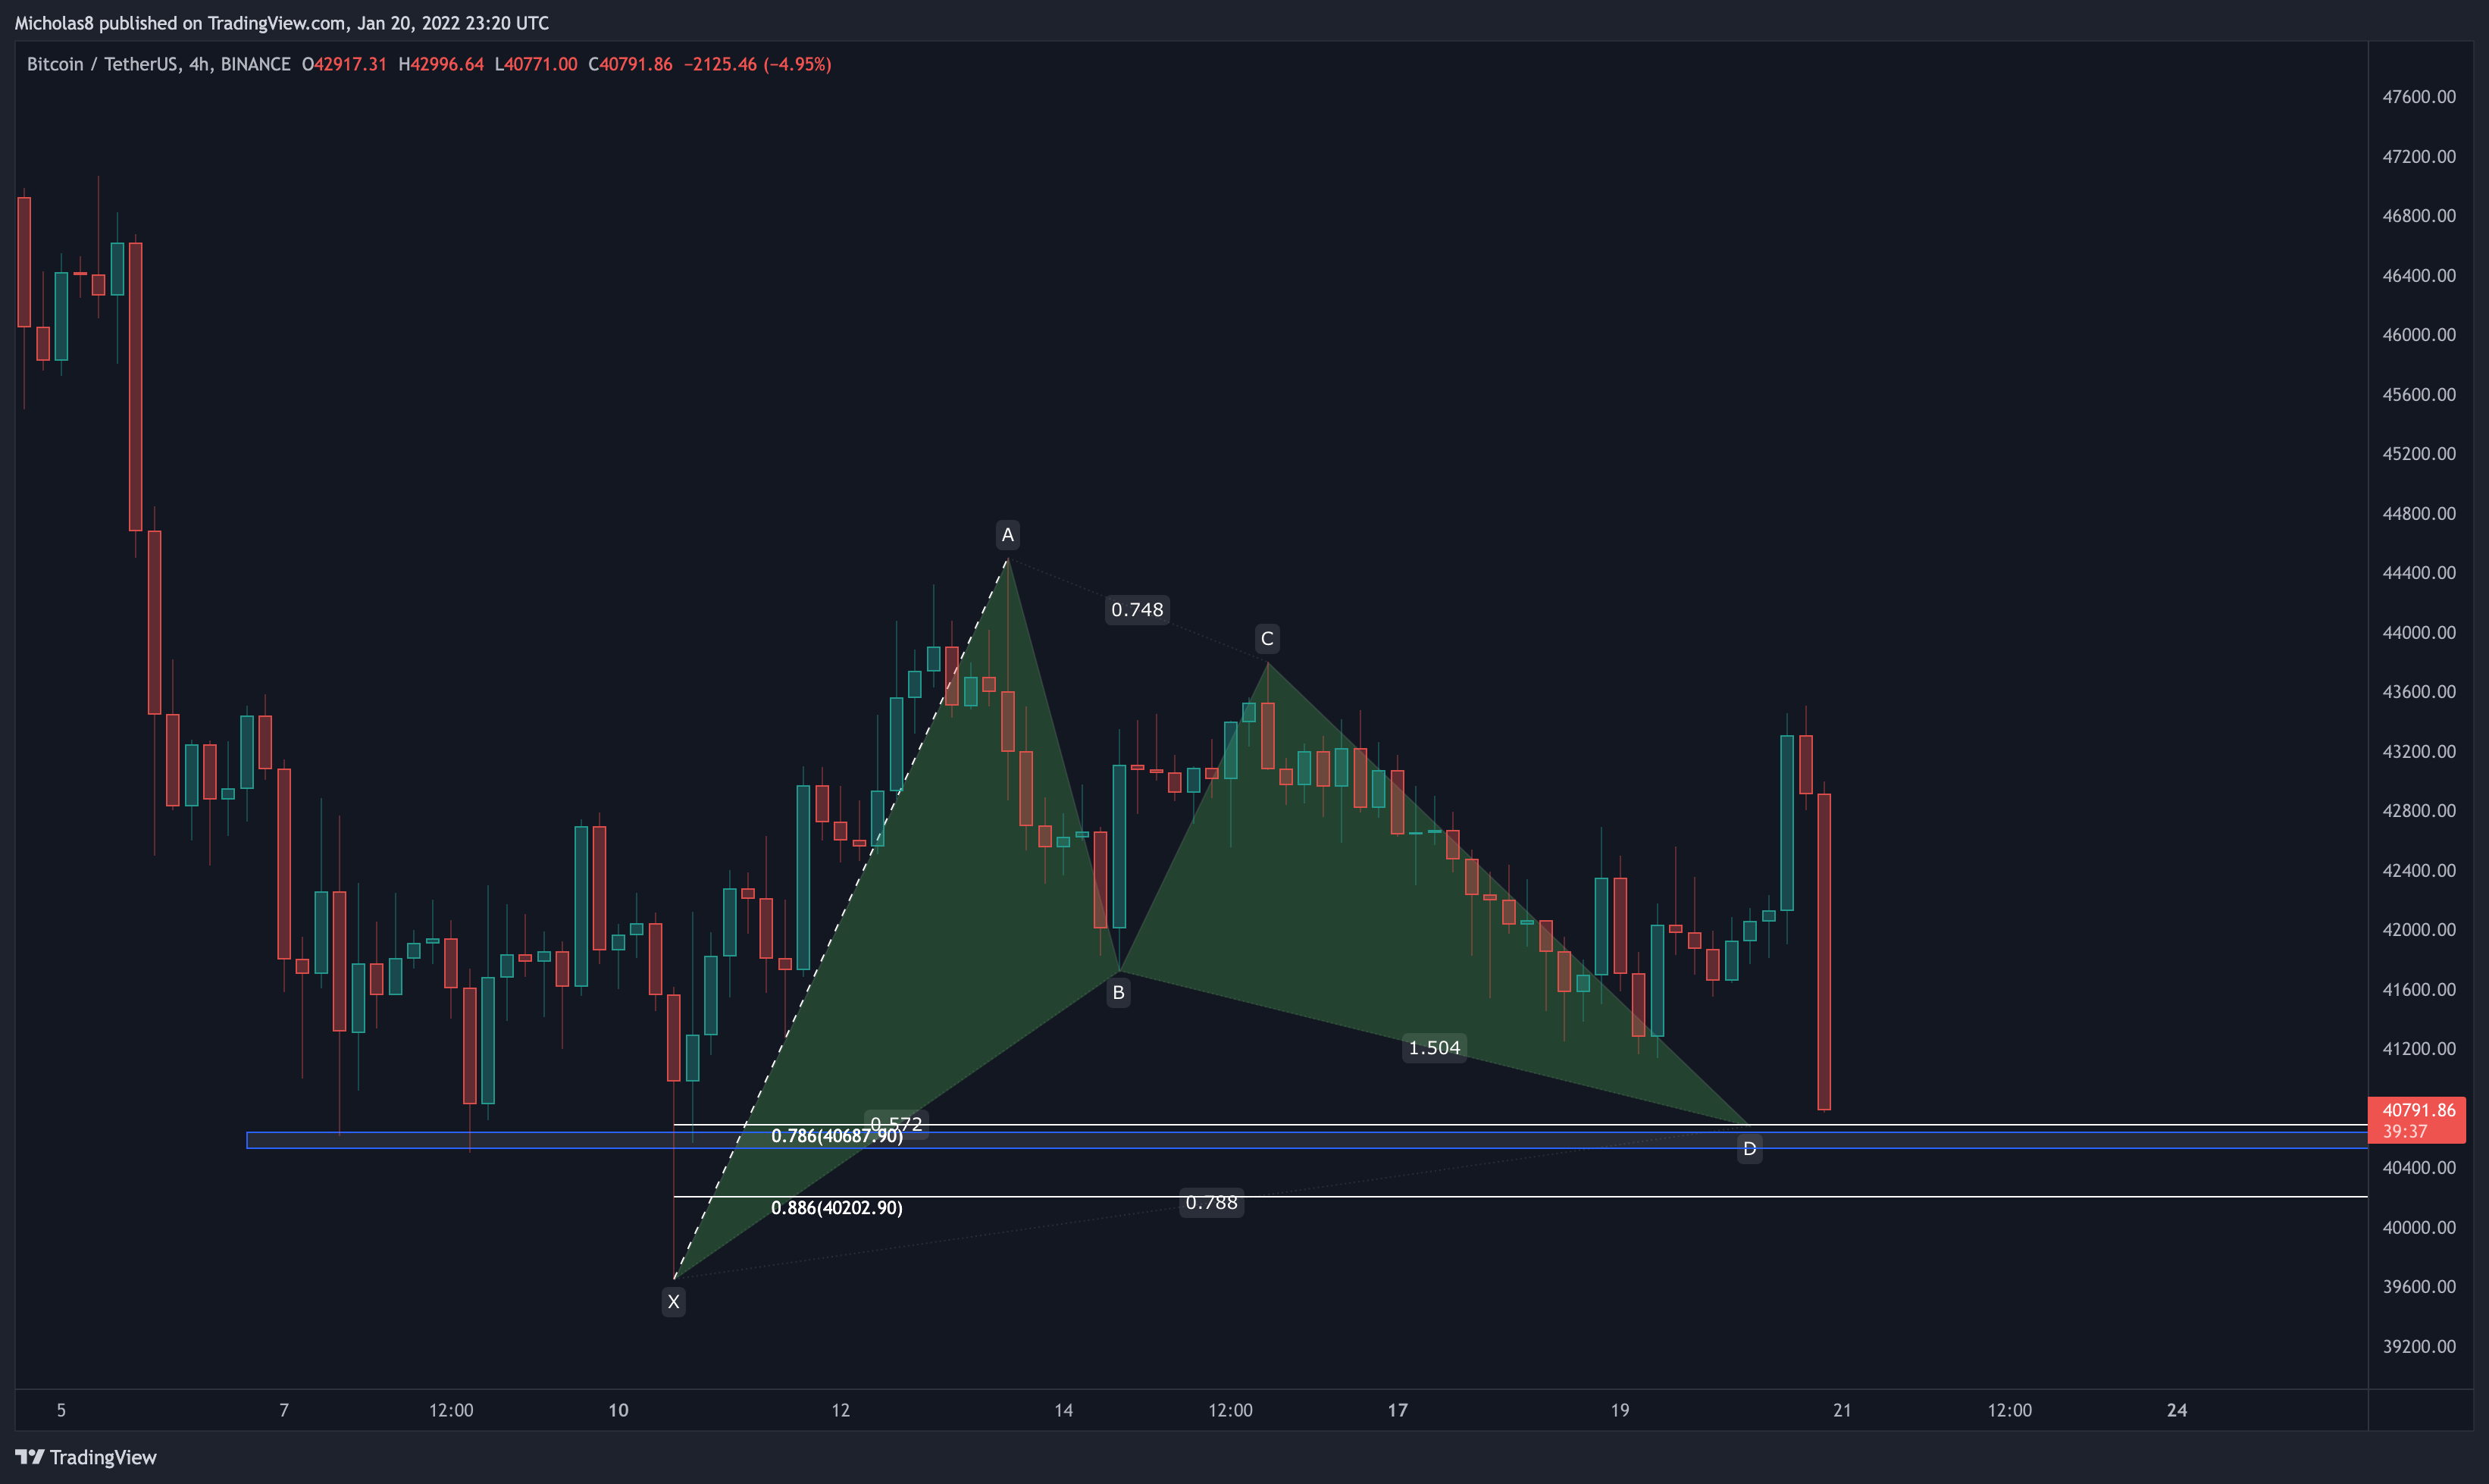
In confluence with the 0.786 Fibonacci Level, we do have this Bullish Gartley with its PCZ (Pattern Completion Zone at Point D) at roughly 40.5k.
If, however, that fails to hold, then we can look towards 40k which is psychological support, and is just below the 0.886 Fibonacci Level.
And if that level fails to hold, we can either look for an SFP of the 39.6k low, or keep an eye out for divergences down at our lower targets (see chart above).
All in all, Bitcoin has been rejected from the Golden Pocket identified earlier today, and is now attempting to find support at lower levels. At this point, since the move is still playing out, we'll need to wait to see where exactly Bitcoin bottoms out. But for now, it's important for us to be aware of the bullish divergences which may aid in solidifying a bottom sooner rather than later. And, if it doesn't, and we continue down, we are aware of the possible levels of support below us.
Thank you for your continued support, and I hope you have a great rest of your week!
Cheers!
THIS MORNING
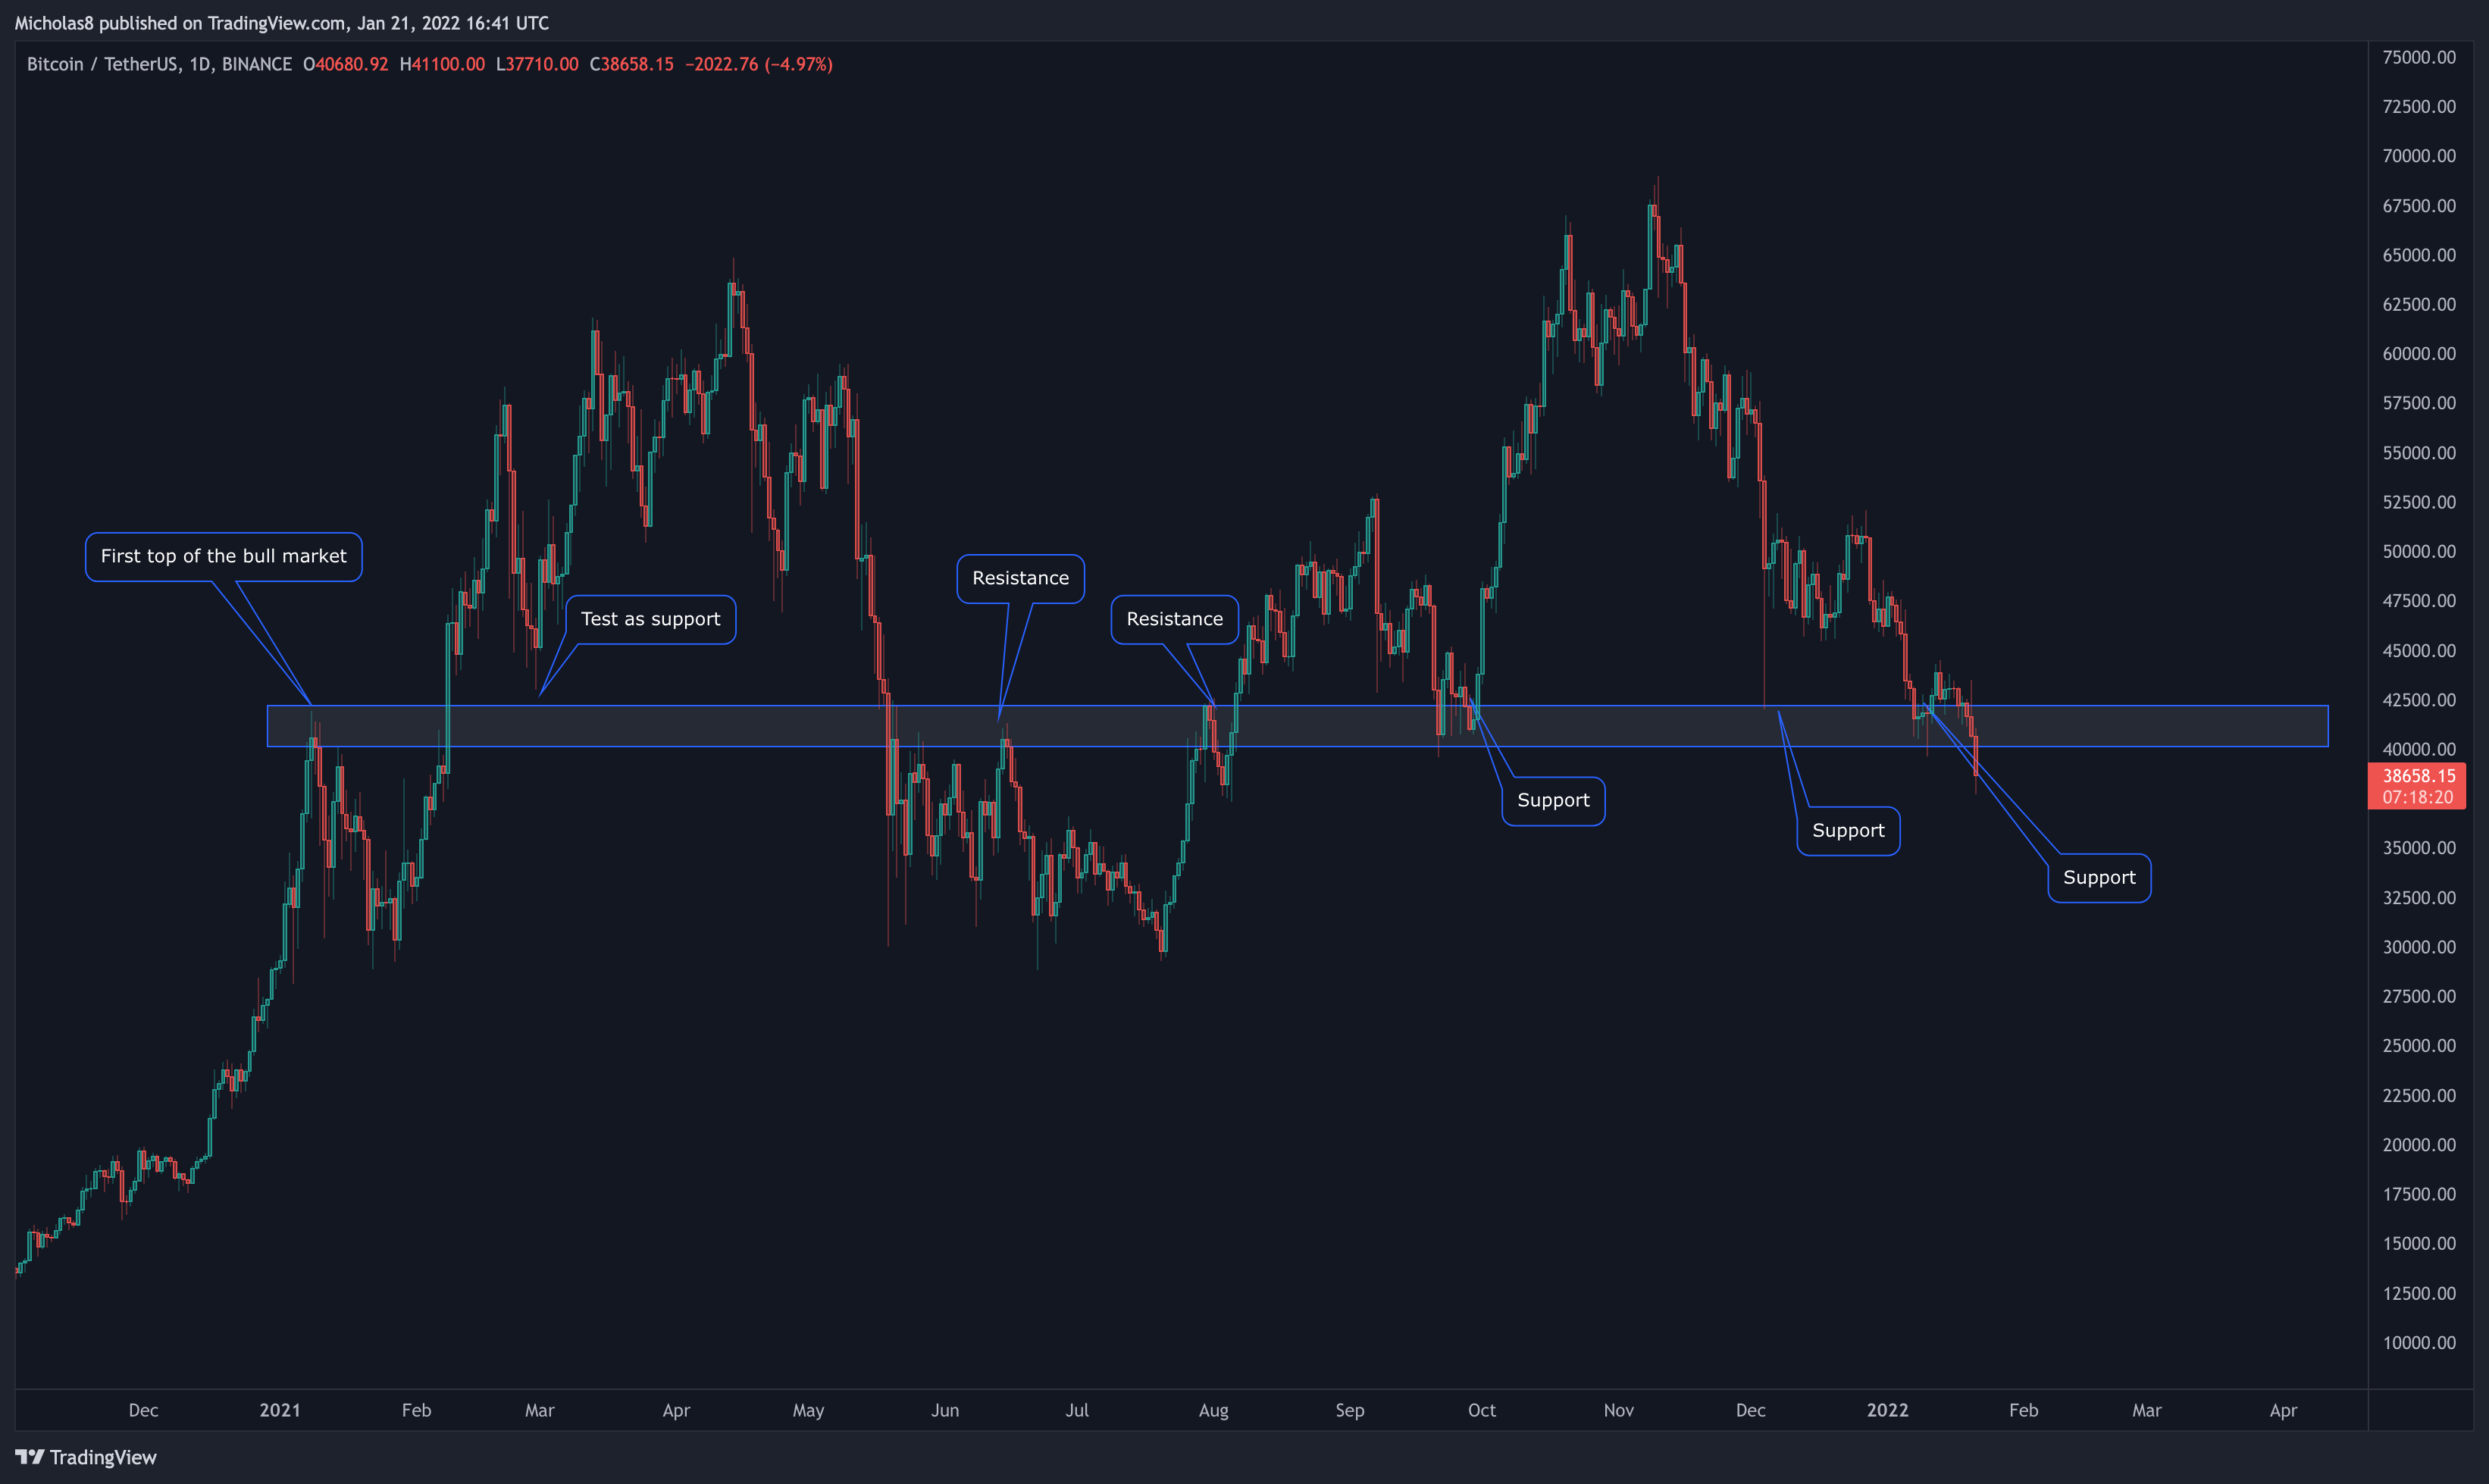
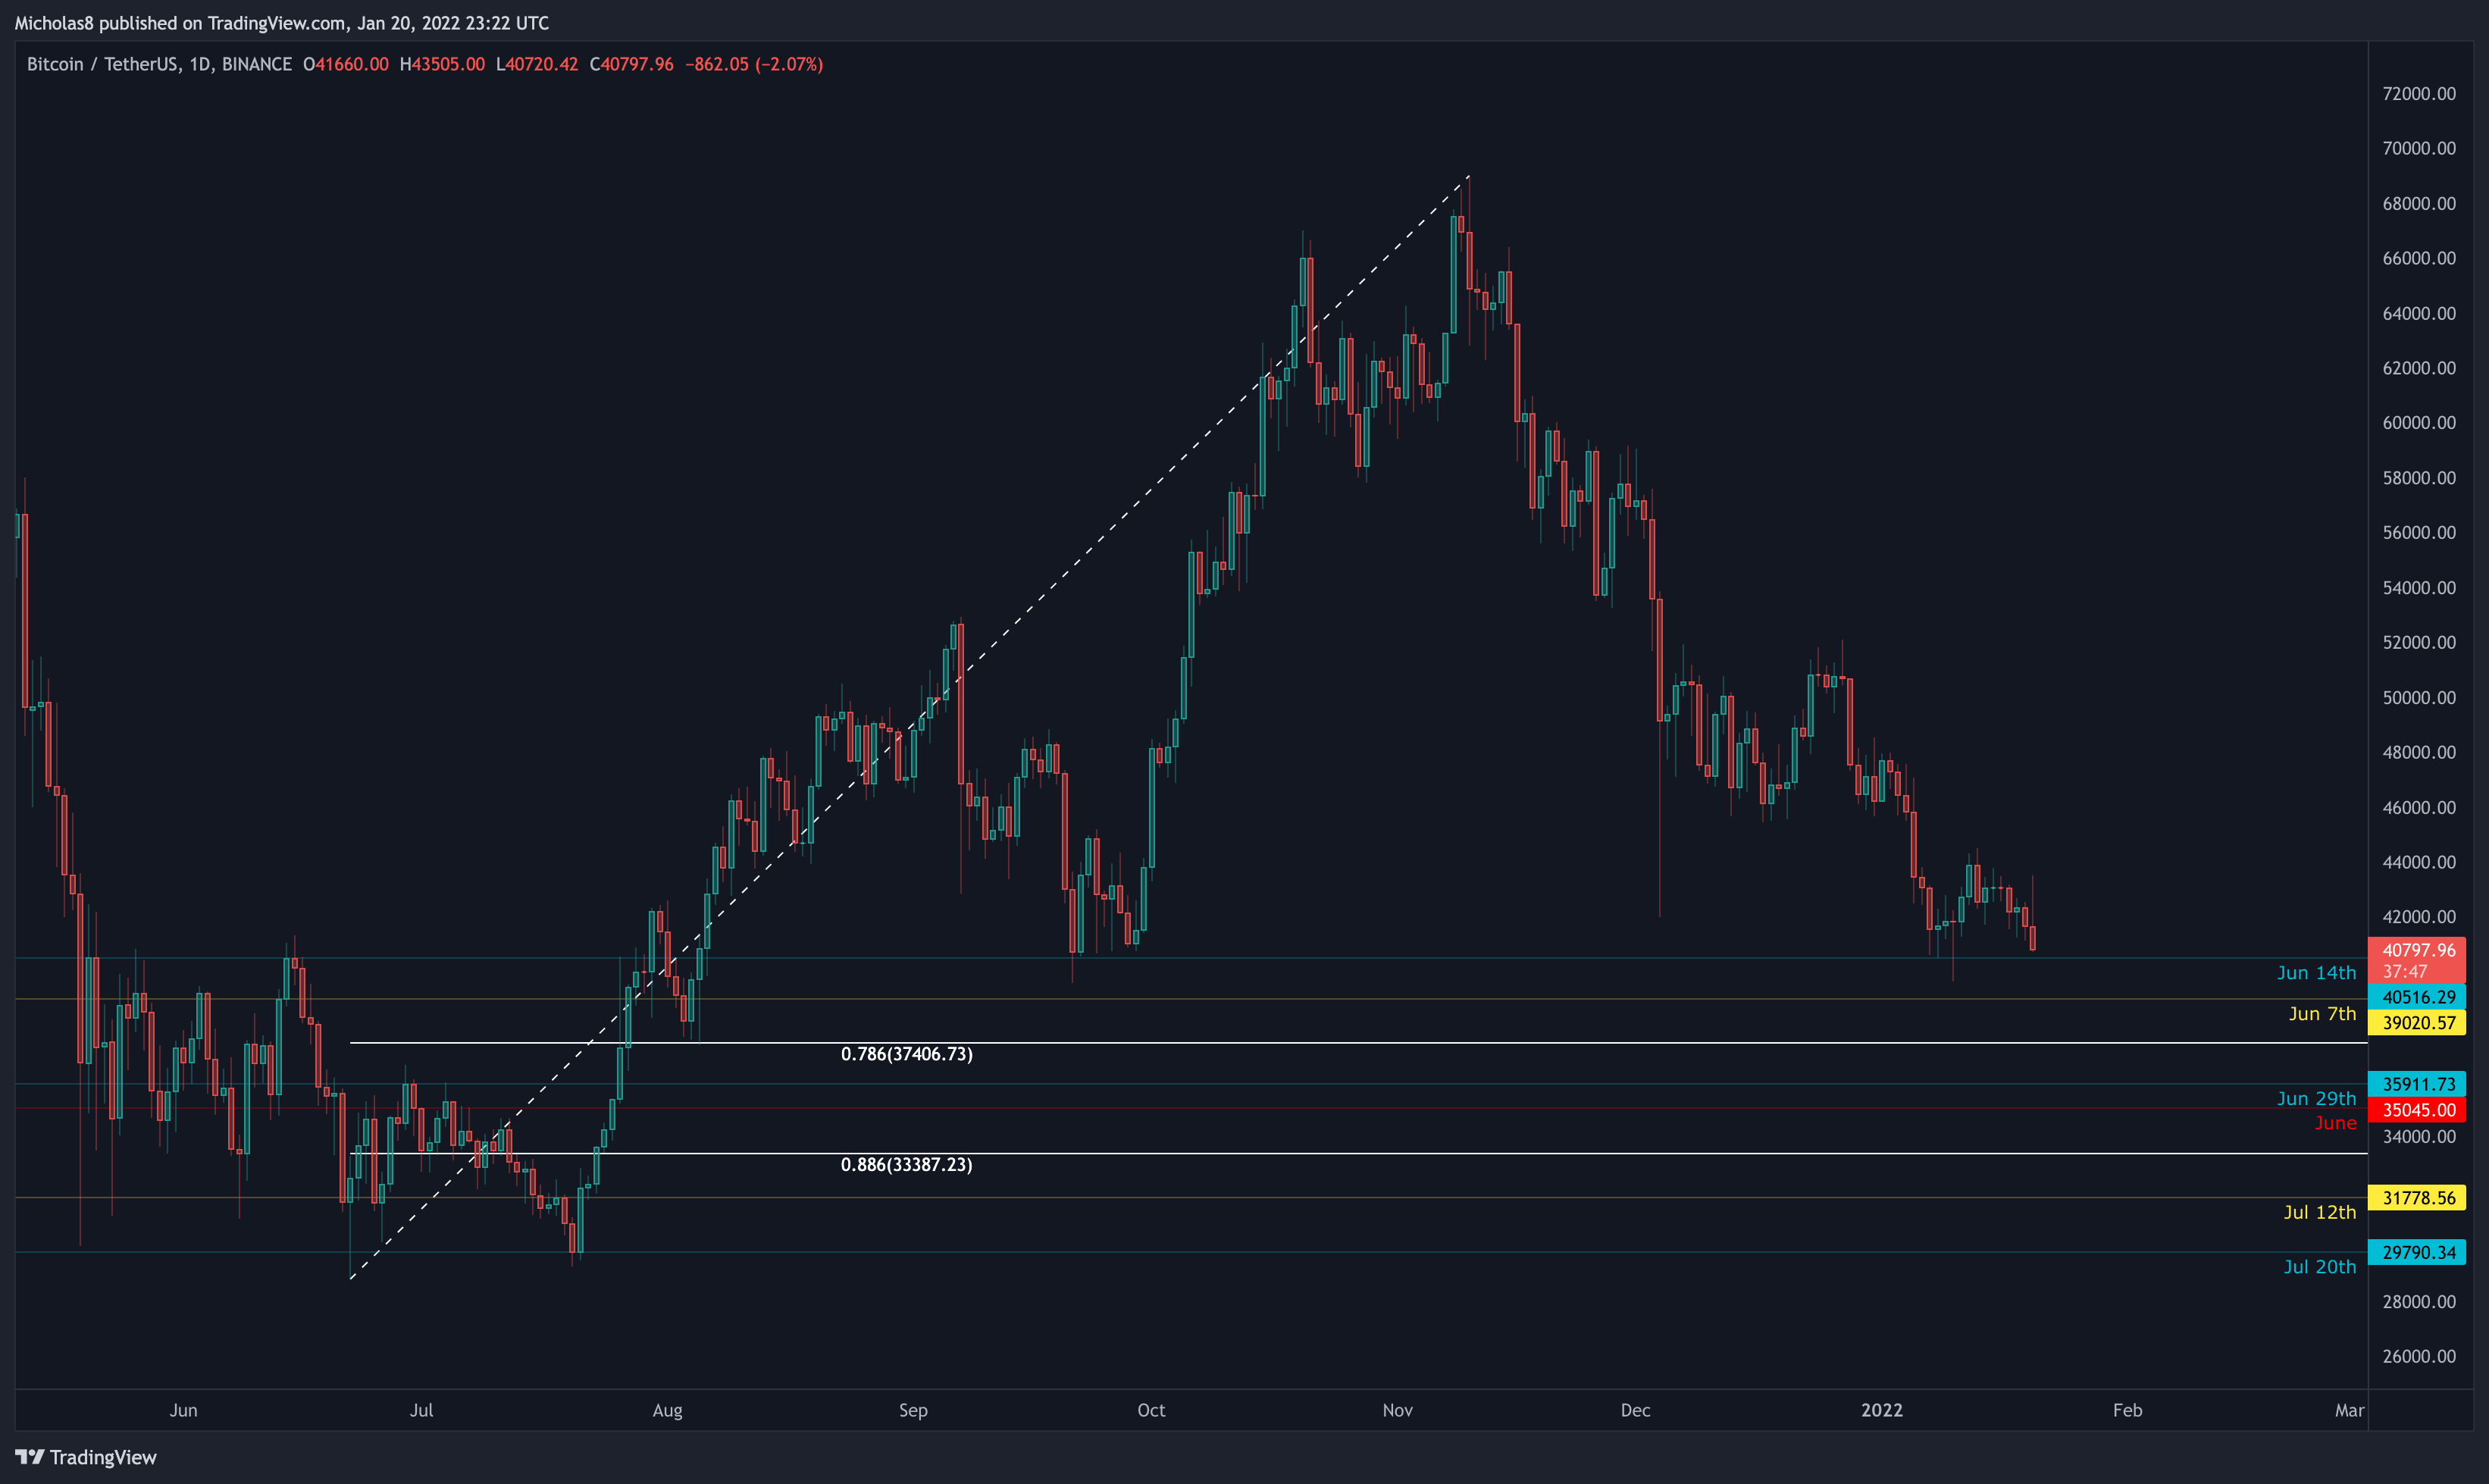
Bitcoin is in an extremely unfortunate situation right now. The 40-42k support level that we looked at a few weeks back is now in jeopardy. It's possible that we may be losing this as support. And as we've previously analyzed, when we look left, we can see that this level has time and time again been the deciding level of bull vs bear. When this level is held as support, it's happy days ahead. But, when it's lost as support, and turns into resistance, we see a significant amount of downside PA to follow. Unfortunately, there's a very strong possibility that this happens.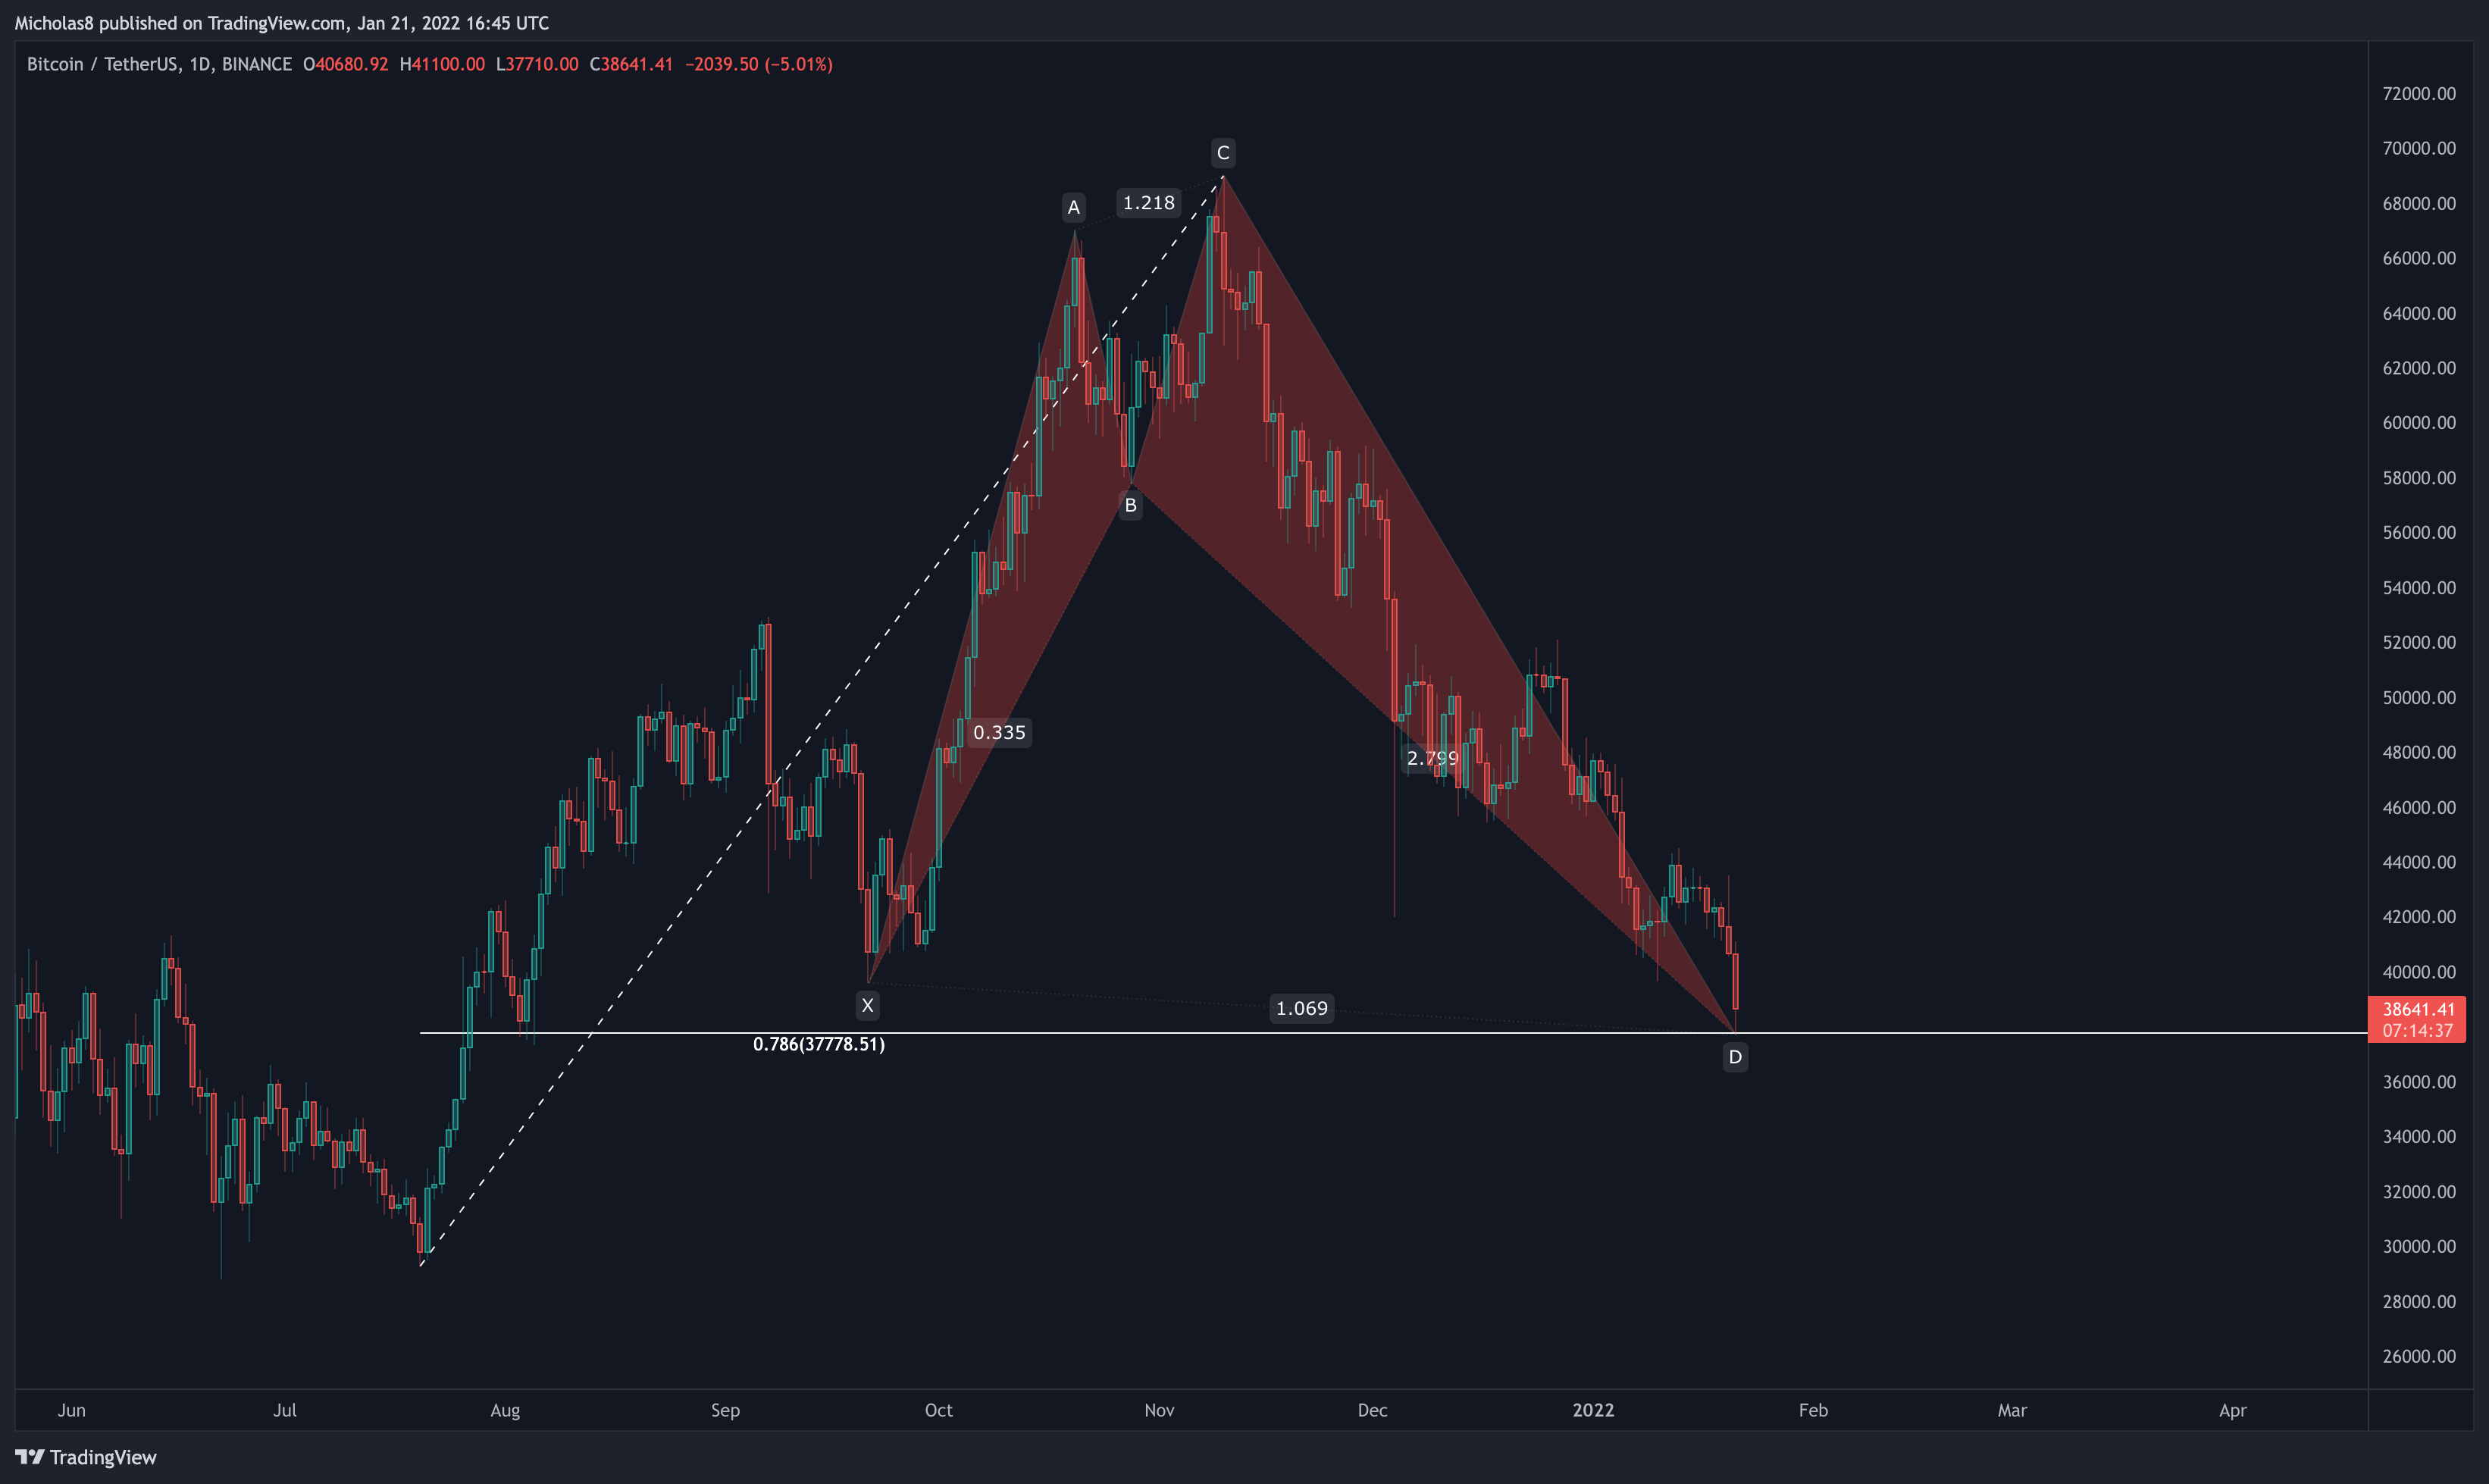
This may look a bit familiar, and that's because it is. This is a Bullish Shark – the one that was used to call the 42k bottom on December 3rd. Bullish sharks can extend down to the 1.13 for it's PCZ. So anywhere around the 1.13 for the Fibonacci Level between B-D is valid.
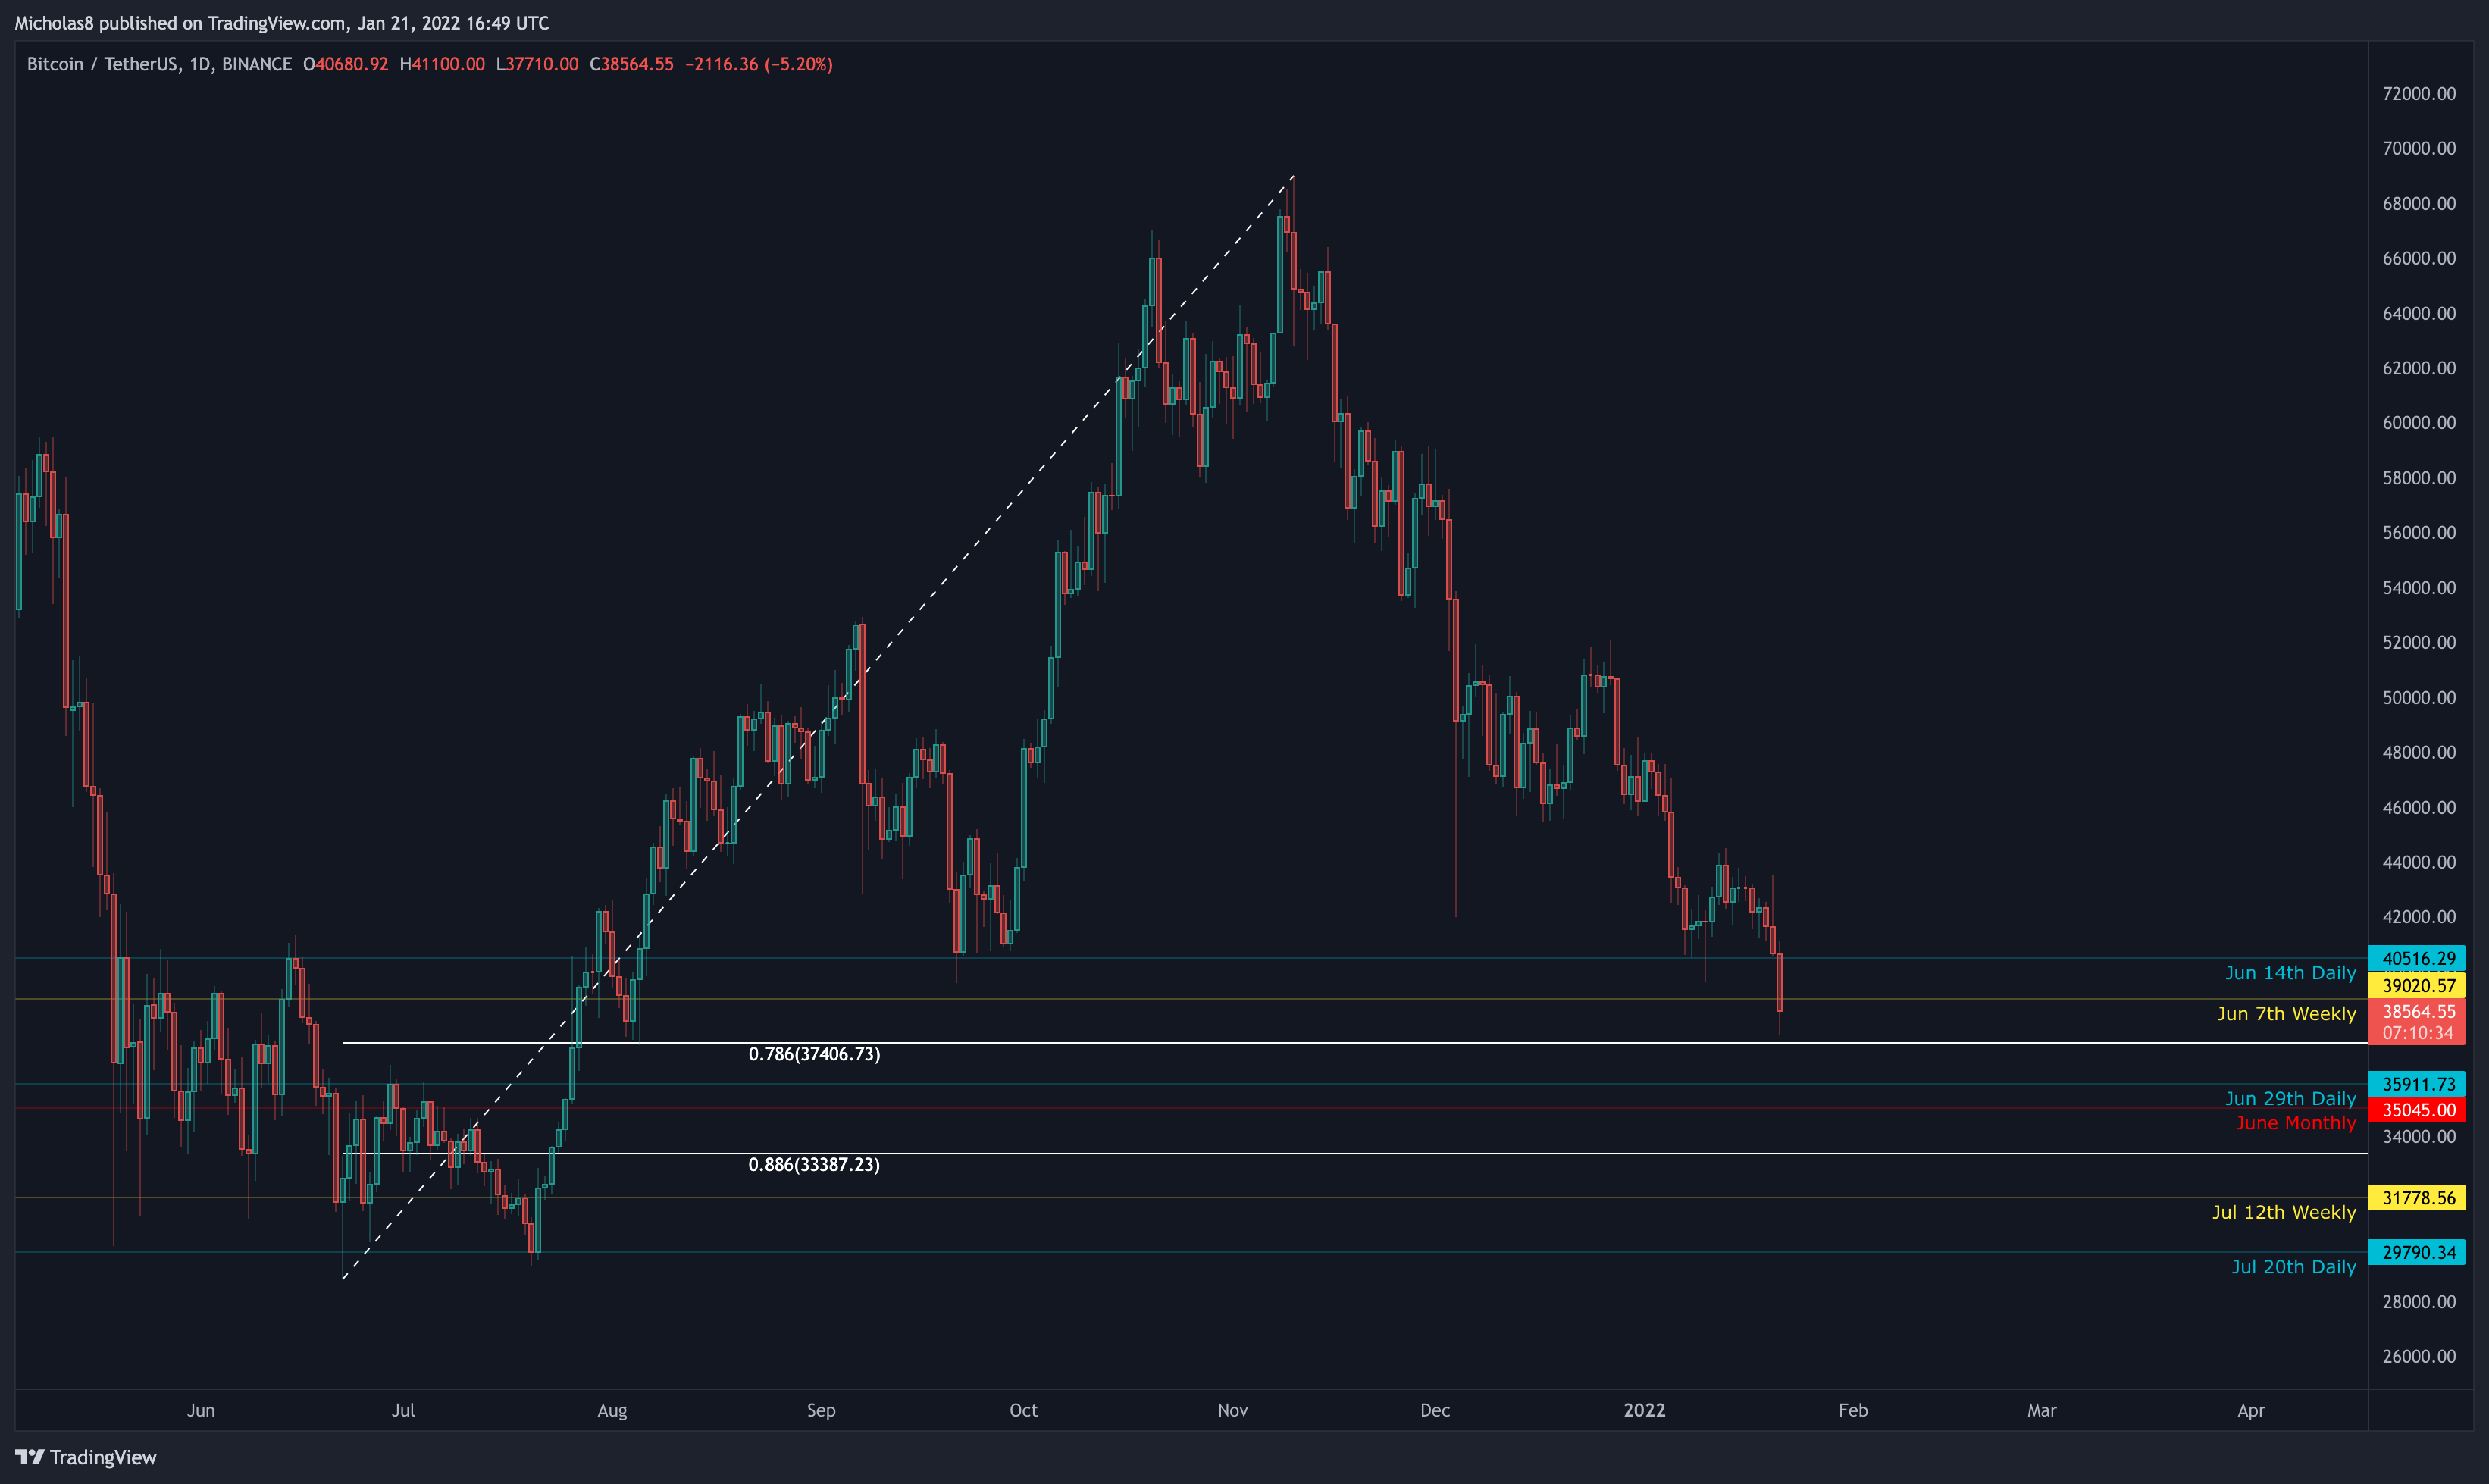
What strengthens the argument for finding that exact, precise level? Confluence. The 0.786 Fibonacci Level right now could be our level of confluence. We're currently forming new 1H/4H/1D bullish divergences as well. These are the types of confluence that we look for when analyzing for potential bottoms. With that said, it's possible that we have found a local bottom.
But, of course, there's always more to the story. With every rise we've had since the dumping began, we've formed new hidden bearish divergences. Until that comes to a stop, the trend is your friend until the end – there's still a high likelihood for downside PA to follow.
And if we do see continued downside PA, these levels remain the same until further notice. Typically, levels don't ever change until we start to trade within their ranges.
 For the bullish scenario, if we see a rise in the coming hours/days, these are the levels I have my eye on.
All in all, Bitcoin remains in a bearish position. We are starting to form new bullish divergences again, but, it's consistently being met by hidden bearish divergences. Until that trend ends, we can expect continued downside PA and/or sideways consolidation until we solidify the bottom.
Thank you for your continued support and I hope you have a great rest of your week!
Keep an eye out for tonight's daily market report in about 8 hours.
Stay safe. Trade safe.
Cheers!