
I’ve said this many times; It’s always darkest before the dawn. But I’m saying it again.
The homebuilder stocks are at the mercy of interest rates. A sustained move below 7% on the average 30-year mortgage would go a long way to remedy the situation. We may be in the early stages of such a move.
The latest new home sales data from the U.S. Census Bureau joined the previously released existing home sales data from the National Association of Realtors by missing estimates. According to the press release, 634,000 single family homes were sold in the month of April, vs. estimates of 677,000.
The numbers signal a 4.7% decrease from the March numbers and a 7.7% drop from the April 2023 numbers.
Meanwhile, the latest S&P Global PMI numbers surged after last month’s decline. The bond market was not happy with yields surging but remaining below the key 4.5% mark for the U.S. Ten Year Note (TNX).
All of which brings me to the most recent average mortgage rates which quietly fell to 6.94% this week, below the magic 7% number, and as the chart below shows, also below a critical long term decision point in the mortgage market.
Is the Frenzy About to Start?
Regular readers know that I’ve been expecting a move below 7% in mortgage rates, which in turn could rev up the action in the housing market. I base this set of expectations on what I call the market timing aspect of home buying, which has been evident of late. You can get the details here.
Here’s a quick summary: home buyers are waiting for a dip in mortgage rates as evidenced by the increase in home sales in late 2023 when rates dropped. The process quickly reverses as rates rise, as evidenced by the tepid numbers in both existing and new home sales in March and April
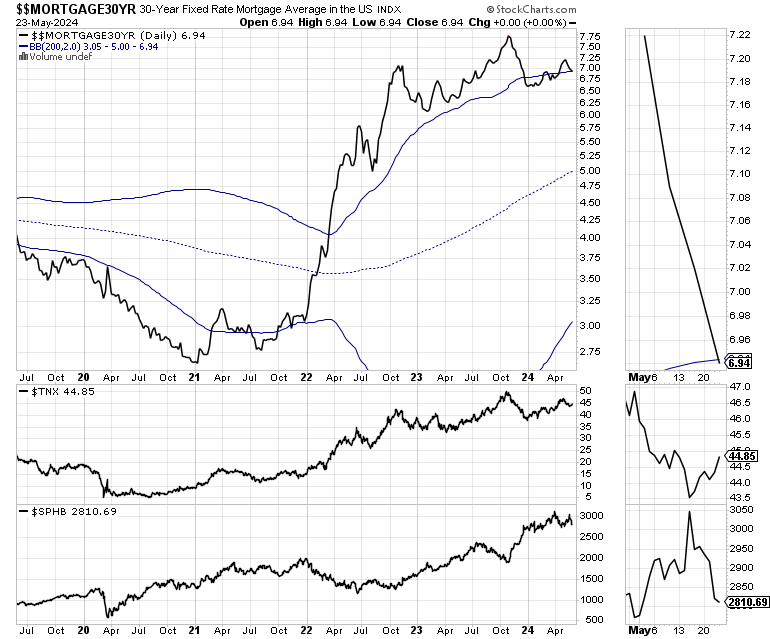
The 30-year mortgage chart above shows that we are at a crucial point. That’s because rates just moved below a key long term barrier, moving inside the upper Bollinger Band (upper blue band-BB) for the 200-day moving average. The upper BB is two standard deviations above the 200-day moving average, a reliable indicator of normal price behavior for the long term. Moves related to this type of set up are usually very meaningful.
That means that mortgage rates are on the verge of returning to a normal distribution, reversing the abnormal distribution they’ve been in since October 2023, when they rose above this important line.
Another way to look at this is that mortgage rates have been in an abnormal pattern for too long and they are now due for a long term change in trend. In other words, when this type of an event takes place, it’s often a bullish reversal sign.
So, the big question is whether this dip below 7% will bring in more buyers. The answer is that the longer it lasts, the more likely will the odds of an improvement in sales be.
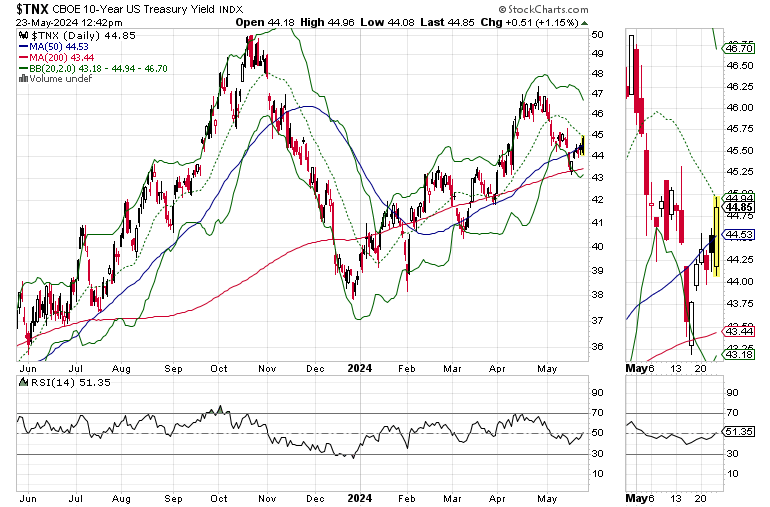
I documented how well this process involving the 200-day moving average and its relationship to the Bollinger Bands works in a recent post highlighting how the recent drop in TNX was triggered when it fell inside its upper Bollinger Band. You can find it here.
Why is all this important? Because TNX is the benchmark for the 30-year mortgage. Currently, TNX is testing the 4.5% yield. Thus, if TNX can stay below 4.5%, you can expect a continuation of the fall in mortgage rates.
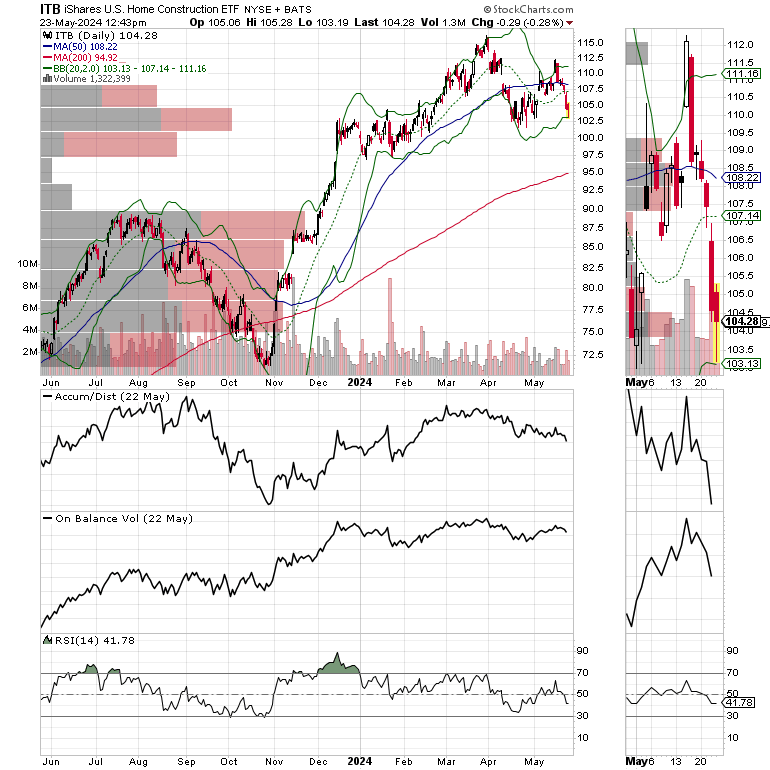
Where it all comes together is in the action for homebuilder stocks, which trade mostly on the action in TNX and mortgages. The iShares U.S. Home Construction ETF (ITB) is currently testing a key support level near $102. A sustained break below that level would be a negative.
Yet, even as the dark clouds gather, there is some hope as there is a huge shelf of support provided by a group of VBP bars which range to $100. Moreover, there is the 200-day moving average just below the VBP bar cluster, as the RSI is growing closer to hitting an oversold level of 30.
What it means is that even though homebuilder stocks are struggling, they are also oversold and entering what should be a reliable support area.
Bottom Line
Interest rates are central to mortgage rates and the trend in homebuilder stocks. The U.S. Ten Year Note yield (TNX) is the centerpiece of the complex.
Mortgage rates have just crossed below an important support level. A continued fall in mortgages would be bullish.
Homebuilder stocks may be nearing the end of a correction. Their fate depends on TNX and mortgage rates.
Thanks to everyone for your ongoing support. I really appreciate it.
Thanks to all the current Buy Me a Coffee members and supporters. Special shout out to new members who now have access to the Sector Selector ETF Service, which is included, at no extra charge with your Buy Me a Coffee membership.
I also appreciate single coffees, which you can buy me here.
For intermediate and long term trend trades take a Free Two Week Trial to Joe Duarte in the Money Options.com.
If you’re an active trader, check out the Smart Money Passport.
You’re the music. I’m just the band.