

 It's been a while since the last major update, but I'm back today with one. This update makes the model account for height in its projections. When I first made this model in high school, I decided not to include height as a factor since my belief was that skill would prevail, and thus, height isn't something my model should look at, and instead, only focus on the stats.
My belief is still that the effects of height get overblown in the minds of most NHL decision makers, but I do think that height plays a crucial role in getting the necessary opportunities to develop as a prospect. For example, let's say an NHL team has two prospects producing similarly in the AHL. One is a shorter forward who is skilled but maybe can't play a physical checking role as well. The other prospect is a taller forward who has the skill to be a star but also has the size and physicality to jump into the NHL in a lesser role and eventually work his way up the lineup. I'd be willing to bet the latter gets the call-up before the former.
The first step in making this change was seeing if height was actually a significant source of error in my model. If it were, I would expect to see the model overperforming on one height group and underperforming on the other. If height were truly unimportant, the model should perform similarly across all height groups.
For this, I used every player to play in the CHL from the 2010-11 to the 2017-2018 season and compared their draft year odds to what they actually became. I decided to use every CHL player to best fight against the selection bias that would show up by using drafted players or something similar. It's not a perfect solution, but I believe it gives me a solid group of players to test this out on. I grouped players by position and height, and here were the results for both 1st Line/Pair and NHLer odds.
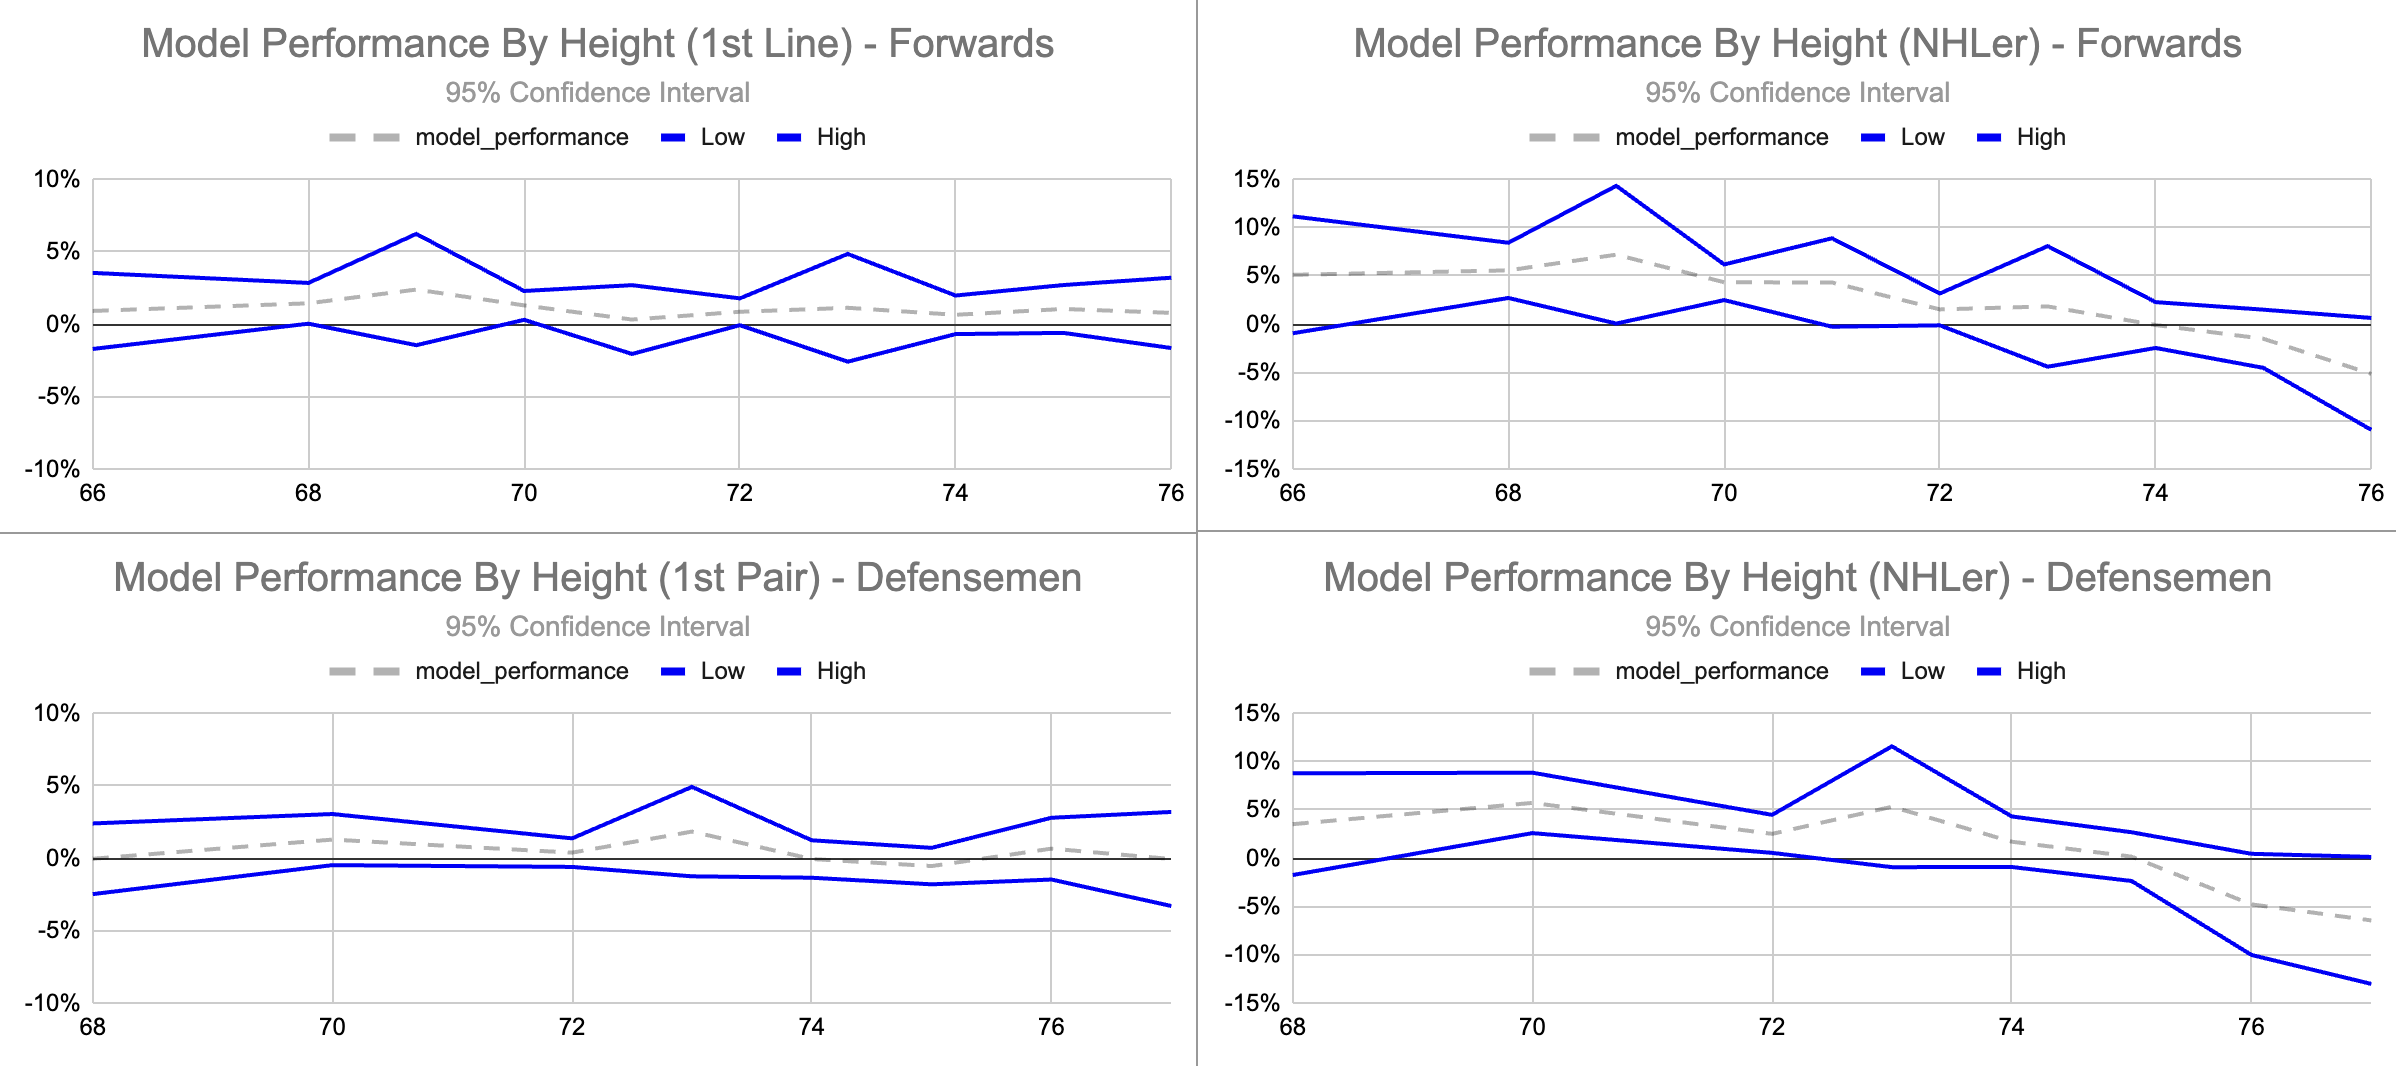 The blue lines on all these charts represent a 95% confidence interval, which is needed when working with probabilities and outcomes, in addition to having different sample sizes for all the height groups. The y-axis represents the over/under estimate of my model. A positive value means it was too high on those players, and a negative value means the model was too low on them.
For both positions, NHLer odds seem to be affected by height, while 1st Line/Pair odds don't as much. This makes sense to me, as if a player is destined to be a 1st Liner, then their skill will carry them to a successful career. On the other hand, to make the NHL as a lesser skilled player, priority is usually given to players who fit in lower down the lineup, typically taller players.
So now it's clear that height should be factored in somehow to my projections. The way I implemented this is rather simple: I created a height penalty in the comp making process. The larger the difference between a player and the comp's height is, the more severe the penalty. This results in a prospect's comps being made of only players with similar heights.
This becomes a little trickier when considering one thing everyone goes through: puberty! A prospect at age 16 will not be playing in the NHL at the height they currently are. Alexis Joseph, a 2027 Draft Eligible, was put into my database at 6'3" in 2024. He is 6'5" today. Viggo Björk was listed at 5'8", where he's 5'10" today. There are many more examples, but you get the point.
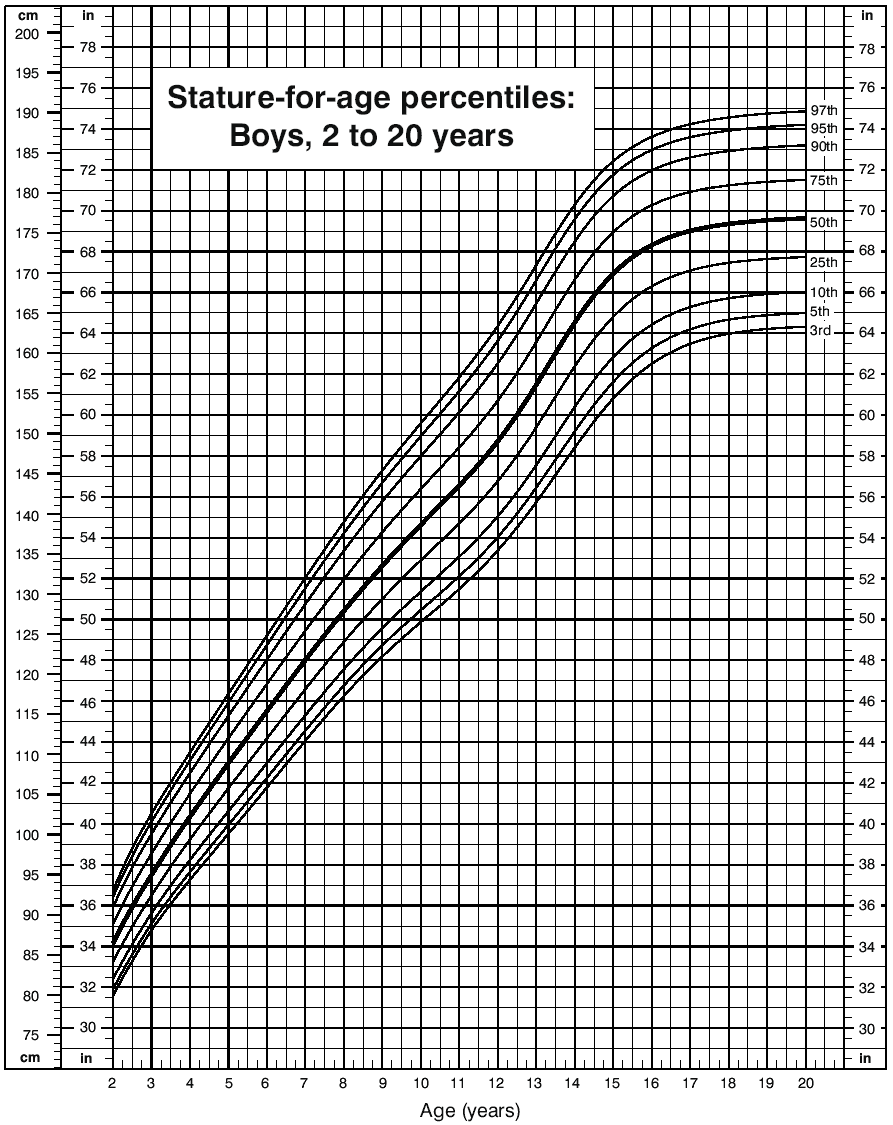
To account for this, I am a) updating a player's information once a year and b) predicting how tall they will be at 20, which is when men fully stop growing. This makes it so prospects get compared to players at their NHL heights, not teenager heights. I used this chart to construct the formula that predicts final height.
 Now it's time to actually implement these changes. Do they actually improve the model? The answer is yes, they do, but not by as much as I expected. First of all, here are the new charts for NHLer odds and model performance by height group.
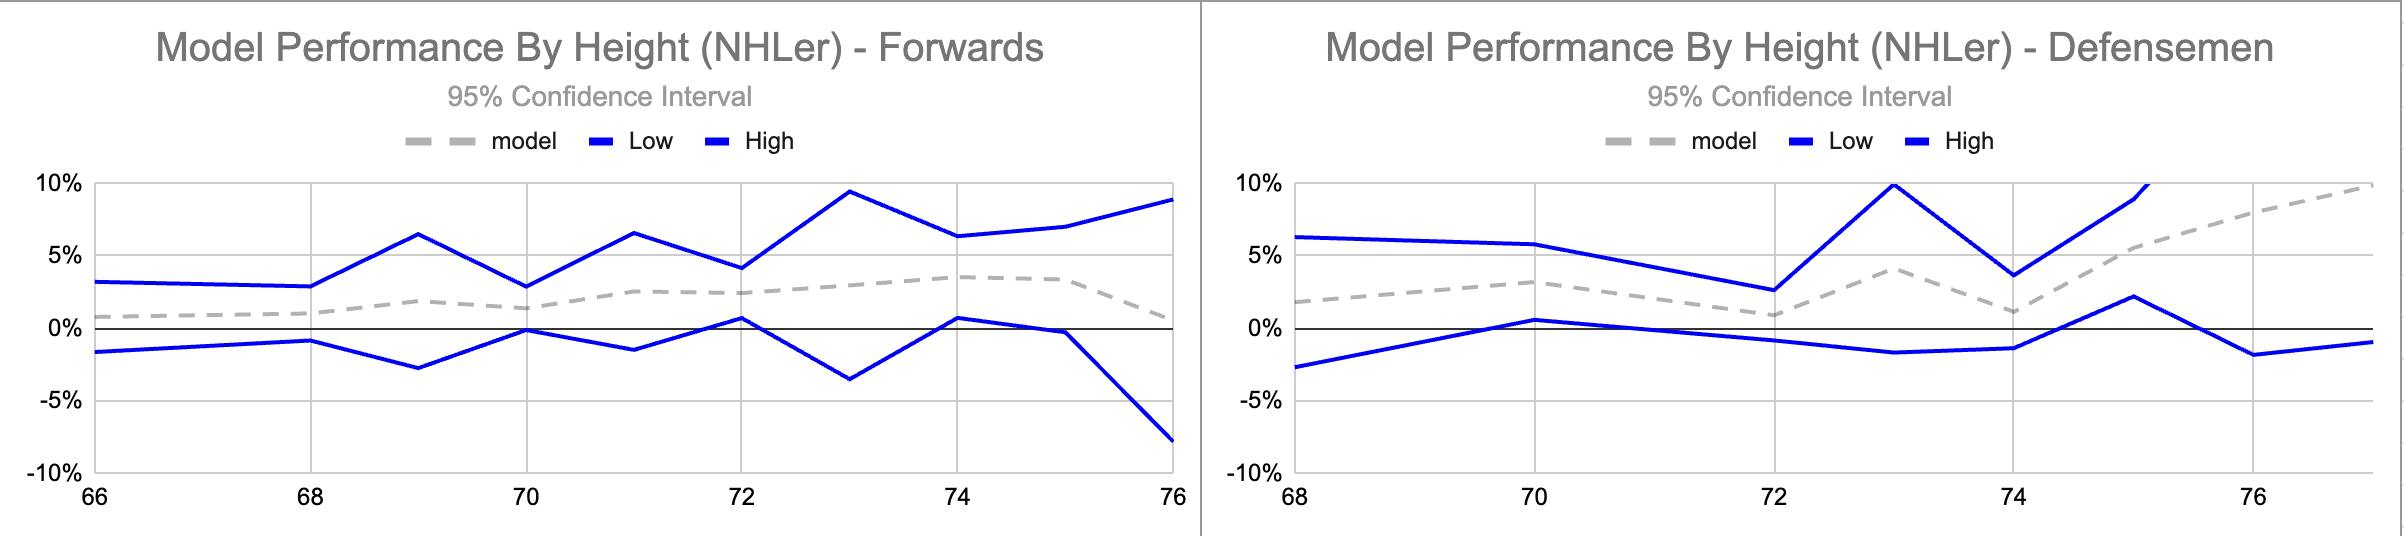 You can fit a straight line into the confidence interval range for both forwards and defensemen, meaning that height is no longer a severe source of model error. If you look at tall defensemen, it looks like the model is way overestimating those prospects, but the sample size is so small there (~50 players) that it gets severely skewed by a few players missing the NHL. That's what the confidence interval is for!
The final check is to see if the change improved my draft rankings, which my historical draft boards are great for seeing. To do this, I used point shares from Hockey Reference to rank the draft class today and compared that ranking to my model's rankings. From this, I could see the difference between a player's point shares and the point shares of the player that should've been ranked there. By comparing the error before and after the update, we can see if there is an improvement. Here are the results.
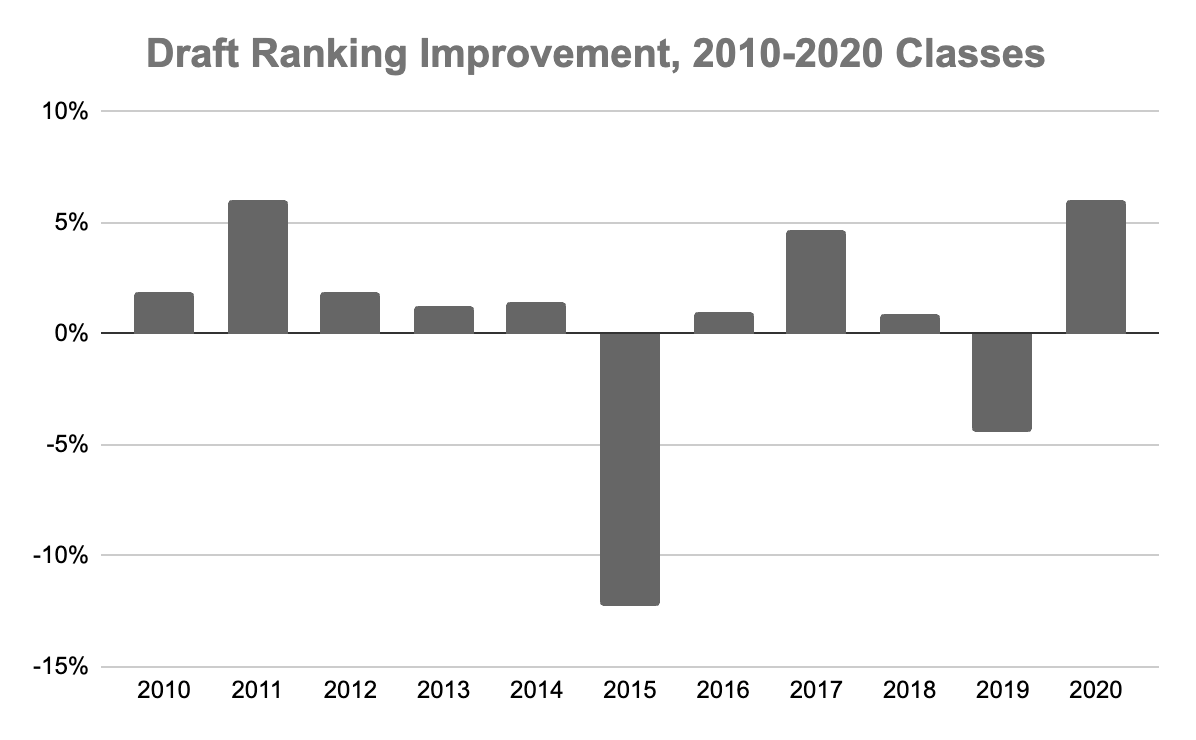 Outside of two outlier draft classes here (2015 and 2019), each ranking had a consistent improvement. The 2015 class got worse because of two major changes at the top: Eichel at 100% 1st Line odds passing McDavid with 99%, and a 6'3" Dylan Strome passing Mitch Marner, Kyle Connor, and Matthew Barzal. This is the only part I am not too thrilled with in this update, but other than that, everything else looks good. I do imagine I'll have to make some minor tweaks with how I've implemented height, but it is here to stay.
I also want to note that this update doesn't just reduce smaller players' odds and call it a day. It instead makes more accurate projections based on the potential NHL roles they are likely to play in the NHL. For example, Cole Hutson is still ranked #2 in my 2024 Draft Day rankings, and Lane is now #6 in 2022, but their odds now better resemble a boom-or-bust profile with higher 1st pair odds than any other category.
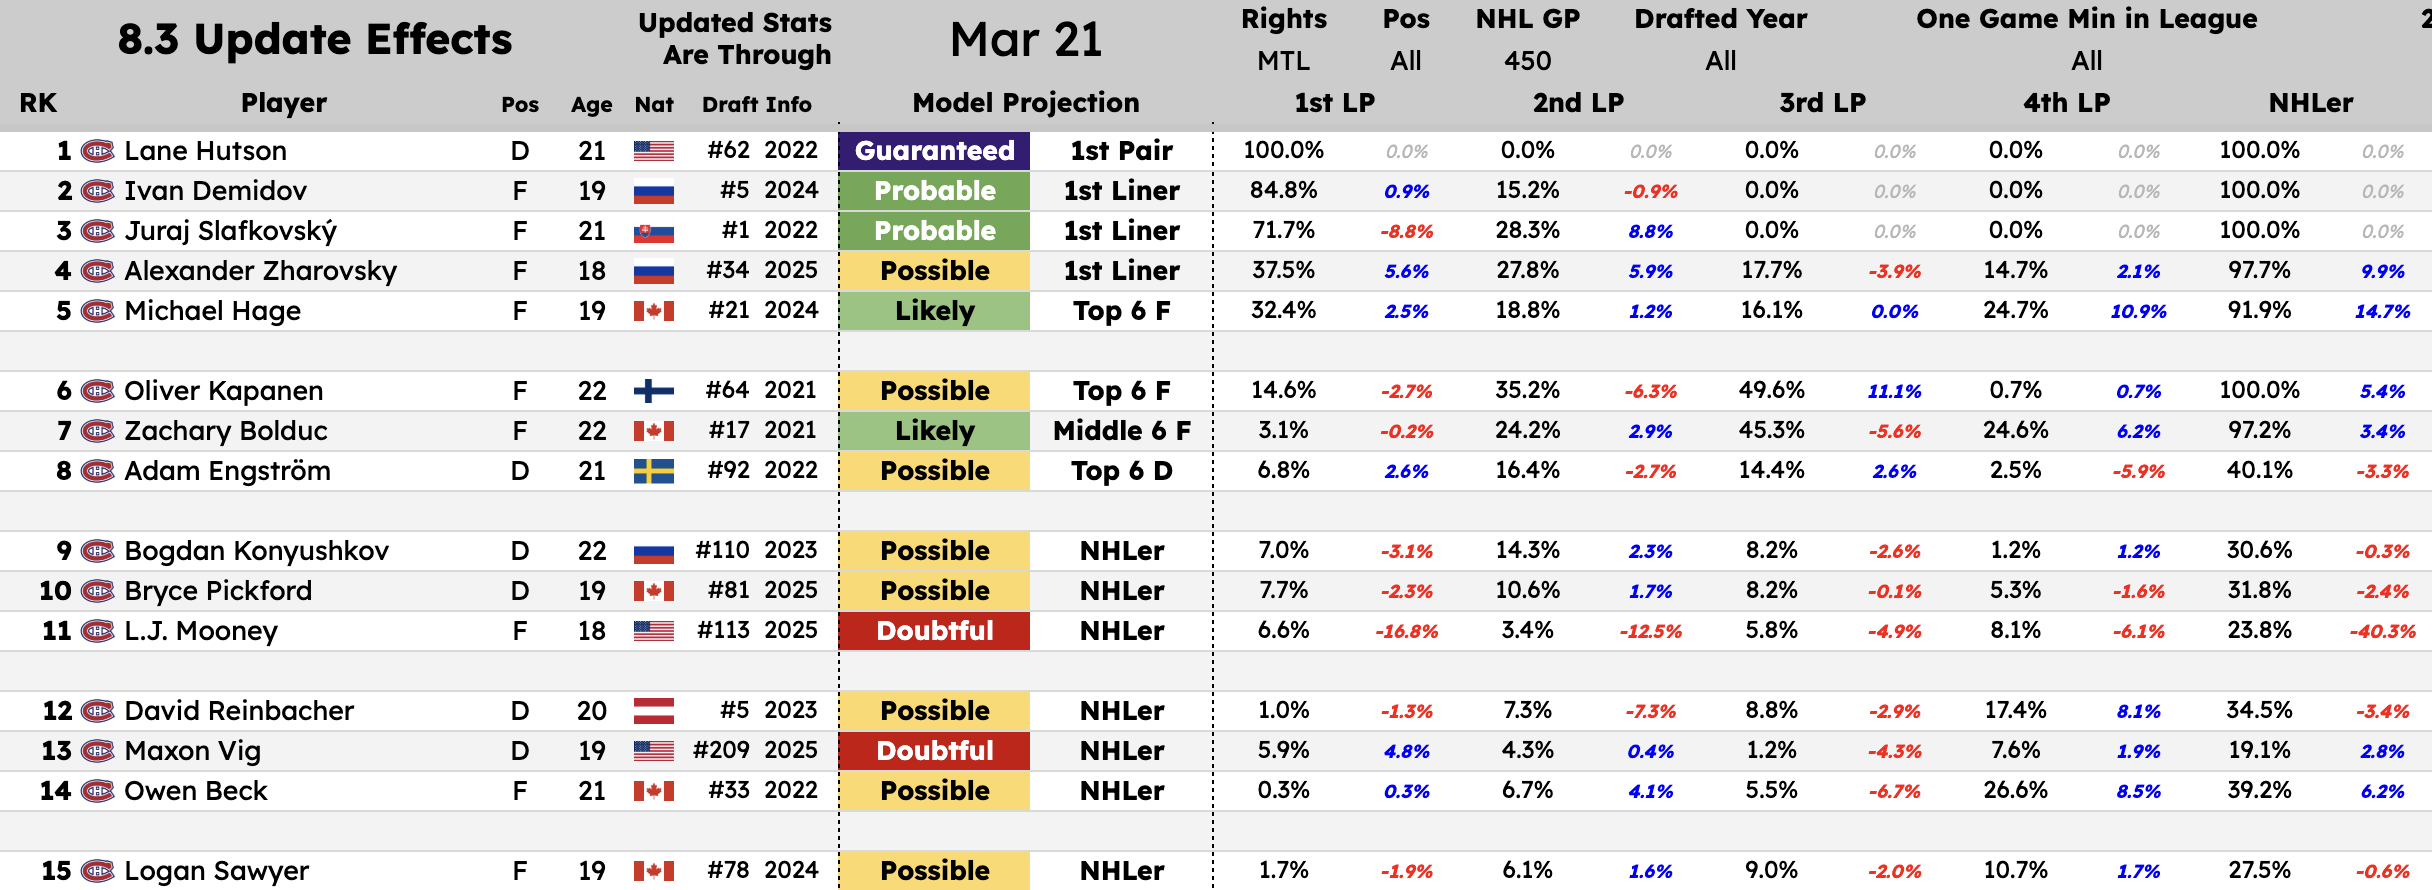
I've already updated everything that needs to be updated. The cards are showing the new odds, the 2026 Draft Board is updated, and so are the In-Season Player Rankings & Historical Draft Rankings ($5 members). If you want to see the effects of this change on a player, I've created a sheet on the In-Season Player Rankings for this (screenshot below) that mirrors the main rankings but shows the difference between current and old odds.
 That's it! Thanks to everyone who supports my stuff; it greatly helps make updates like this possible! If you have any questions, please feel free to reach out and ask!