

Welcome to Watch The Stats! If you've just joined with a membership, check out the post below that matches your membership tier and request access to the Google Drive folder!
Projected Star Members ($5/month): buymeacoffee.com/watchthestats/links-all-perks
Projected NHLer Members ($3/month): buymeacoffee.com/watchthestats/link-skater-cards
The rest of this post is to give anybody interested a look at what's available with a membership. Here are some things to keep in mind with all of these perks:
Stats & Odds update once a week. During the season, I update everything once a week, usually sometime Sunday morning (West Coast time)
It is better to use a laptop over a mobile device for every perk. Each tool is designed for a laptop screen and also loads much faster and is easier to use that way. Everything will still work on a mobile device, but it will be slower and not as easy to use as a laptop.
If you would like to see a prospect in my database that isn't, let me know via email or Twitter DM, and I'll add them to be created the next time I update stats and odds.
Projection Cards (All Members)
 Prospect Projection cards are available to everyone, regardless of membership tier. Every other perk is only for Projected Star Members ($5/month).
The cards include: a bio, a current projection breakdown, previous years’ projections, and D-1 to D+5 production. Starting with the bio, it includes draft information, the prospect’s age in terms of years after their first draft-eligible season, nationality, the year that they were first draft-eligible, position, height, and career NHL stats.
The current projection breakdown showcases the five possibilities that I model and their respective odds. Using these categories, a meaningful projection can be made. Some examples of these projections are: Likely Top 6 F, Unlikely NHLer, Possible Middle 6 F, Certain 1st Pair, and much, much more! The chart right under shows how a player’s odds have changed over time, specifically from their D-1 (age 16 season) to their D+5 (age 22 season).
The production section shows the prospect’s production for every season in the league where they played the most games. The blue bars are the NHLe equivalency for that stint. Keep in mind that if a prospect played in multiple leagues in a season, not all will be displayed, even though all are factored into the calculations.
In-Season Player Rankings & Watchlist ($5 Members)
 The In-Season Player Rankings are the best way to keep up with up-to-date odds for every single prospect in the database. The rankings page has filters up top that allow you to customize the rankings. The image above is filtered to show every prospect with fewer than 100 NHL games. But maybe you want to see only your team's favorite prospects. Maybe of those you only want to see those in the NCAA. And maybe of those, you only want to see forwards that play for a certain school. All of that, and more, is possible with the in-season player rankings.
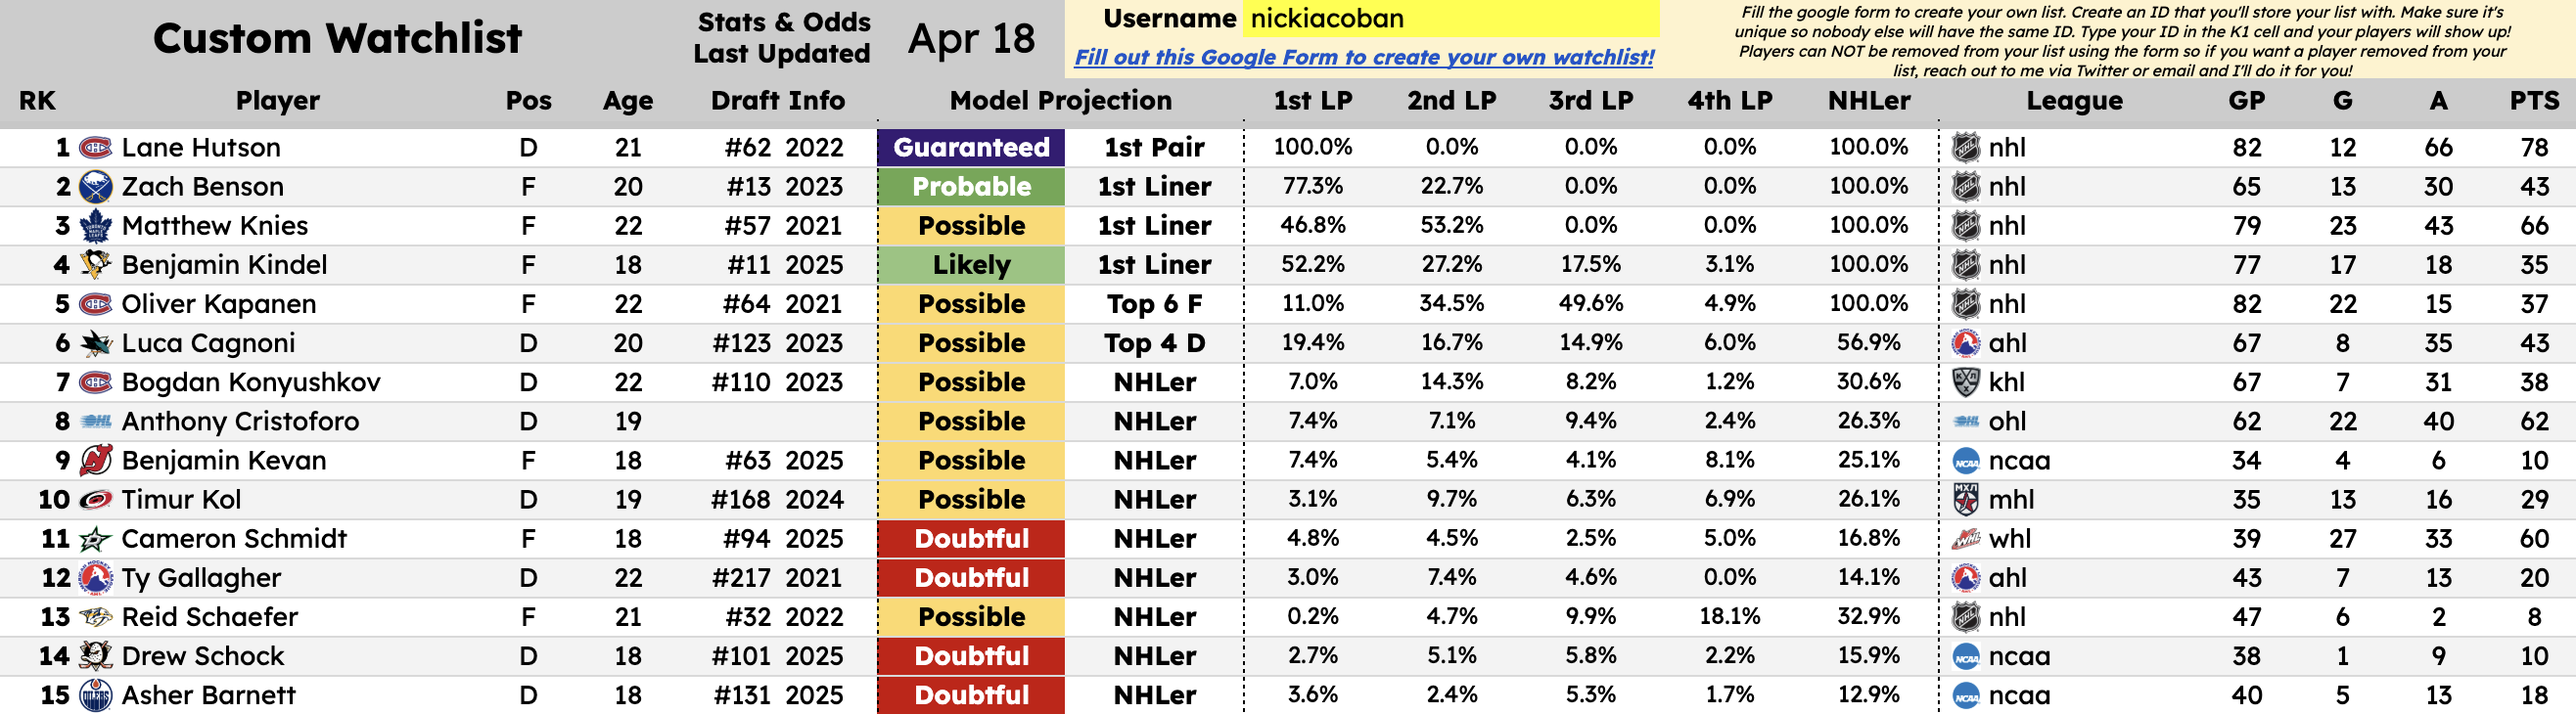
 This perk offers more than just rankings, however. You also can create your own custom watchlist to follow any prospects in the database you want with one simple view. This is perfect for tracking your dynasty team's prospect pool, or just tracking prospects that you want to keep an eye on. Prospects for this don't have to be drafted to the NHL; they just have to be in my database. You can create your list by simply filling out a Google form with a unique username and all the prospects you want on your list. More instructions for this process are on the sheet itself (including the form link).
 The final page on this sheet is for the Team Prospect Pool Cards. These give another look at each team's prospect pool and U23 core. The rankings on the right side are sorted by U23 pools, with a breakdown for position. Prospect pool rankings are also shown.
 2026 Draft Board ($5 Members)
This perk is the most interactive way to track the 2026 Draft class. It starts with a customizable draft board, where you can adjust the weighting between consensus scout opinion and model projections. The arrows on the left represent the rise or fall since the last ranking using the same weighting that is currently set. You also see model outputs, raw stats for this season, and scout rankings.
 Additionally, you can see a much more detailed view of each prospect using the Draft Eligible Card. These give you the same information that the draft board gives you, but also show you a prospect's ranking over the entire season and the summer before. These are connected to the main draft board, so the rankings on the card depend on the weighting that the main board is set to.
 Last but not least is the Mock Draft Creator and Draft Lottery Simulator. This starts with the lottery simulator. Select Yes or No in the highlighted cell if you want the draft order to use the saved lottery results or not. You can click the red checkbox to simulate the lottery and see what the post-lottery order would look like. Once you simulate and are ready to push that sim to the draft board, input your winners in the space under the draft order using the original draft slot of the winners. Once that's done, you can make your mock draft! Make it as long as you want since all seven rounds are available and usable!
 As you create your mock draft, don't worry about remembering who's available and who's not. The available players page takes care of that for you! This, once again, is dependent on the weighting that the main draft board is set to.
 Historical Draft Boards ($5 Members)
Ever wondered how I would have ranked previous draft classes using the most up-to-date model? The Historical Draft Board gives you that ability. Similar to the normal draft board, you can customize the main draft board for every draft class since 2003. Change the weightings or just sort by draft order instead of my rankings.
 This sheet also allows viewing many of the post-draft-day graphics I post, which include: most efficient teams, team efficiency timelines, steals, reaches, and best undrafted players.
 There is also a draft class strength visualizer, which is based on average 1st Line/Pair odds for all drafted players. This is filterable by certain pick ranges such as top five, lottery, 1st round, Entire Class, and more.
 The final tool is called If The Model Was A GM...... This allows you to see how a team would have drafted if it used my draft rankings for that season. Use this by changing the choice ticker to the top choice who is still available (if you haven't picked him earlier). This is what Boston's draft class in 2015 would have looked like using a 75% Model - 25% Scout split. I'd say picking up Kyle Connor, Matthew Barzal, Kirill Kaprizov, and Jack Roslovic is a lot better than what they actually did...
 NHLe Values ($5 Members)
This is the best way to view my models' NHLe conversions. I don't display the NHLe values as traditional 0-1 values, however. That isn't the most accurate way to view NHLe since it assumes that league scoring rates remain constant. Check out the second part of this post for more information on this: https://buymeacoffee.com/watchthestats/wts-8-2-fixed-nhle-2026-values
Essentially, the way to interpret my values is how many points an average scorer in that league would score in 82 NHL games. For the NHL in 2026, the average NHLer would score 37.50 points, and thus, that is the NHL's avgPTS.
The first tool on this sheet is a league history card, which shows you a detailed view of whatever league you want.
 You can also compare up to four leagues together using the timeline tool to settle age-old debates, such as the CHL league strength debate or the European pro league debate.
 NHLe Career Cards ($5 Members)
This is the best way to view a player's production over the course of their career. The logos in the player's bio show the team he's played for over the course of his career. Teams with more games spent show up first in this list.
The bar chart represents each season's NHLe using all regular season data from that year. The red line graph represents what the player's career NHL point pace was at that point in time. For example, after the 2018 season, Brent Burns had a career NHL pace of 0.62, compared to the 0.598 he's at now.
The logos at the bottom show where the player spent the most time playing that season, with era-accurate NHL logos. The icon above the logo represents the production level for that season. A crown represents a franchise pace, one star for 1st Line/Pair, two stars for 2nd Line/Pair, and so on.
