

Main Elliott Wave count of JPY currency basket against 16 other currencies (EUR, USD, GBP, CHF, JPY, CAD, AUD, NZD, CNH, DKK, MXN, NOK, PLN, SEK, SGD, ZAR, TRY).
Monthly Chart
The Japanese Yen has come a long way since the January 2009 high and is now approaching the end of a long correction that makes up a cycle B wave in this Elliott wave count. The sticking question everyone, me included, seeking the answer to is if it has found support and a bottom already?
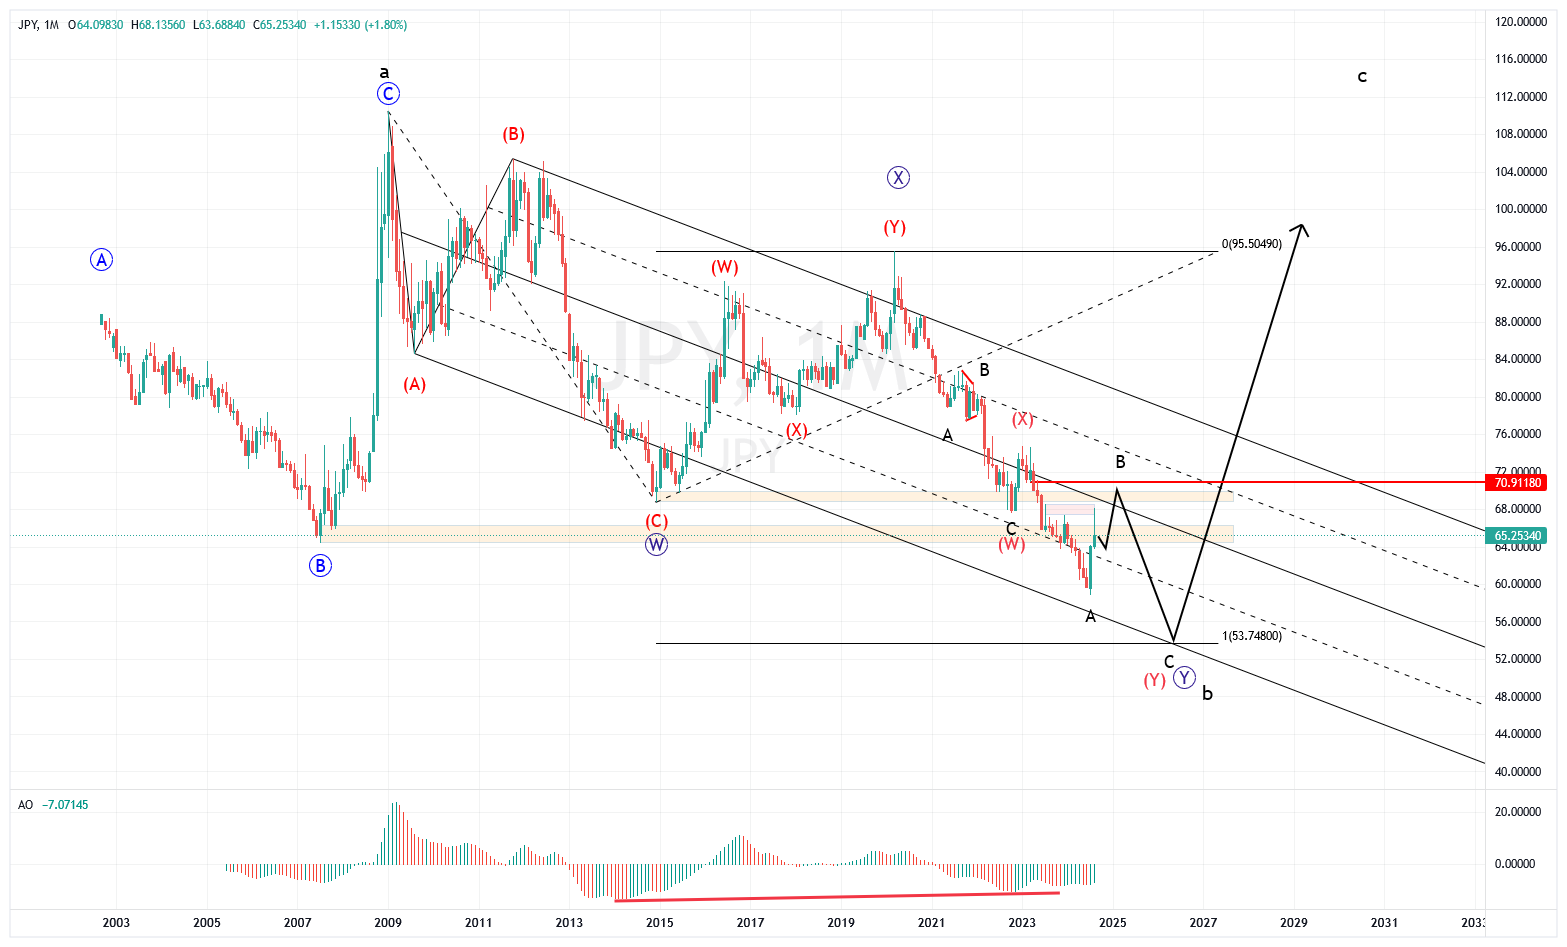
We saw a very strong performance by JPY during July, engulfing the 3 previous months’ bearish price action. Then August started in the same way, overtaking all highs going back to and including last August but that triggered a strong rejection. That is where we are right now but what happened?
Well, I am sure you have heard about “the carry trade unwind” and that is in a way correct, but at the same time, it is just a symptom of the “illness” and does not really say anything about the cause. Indeed, the cause goes back much further than 2009 where the data feed for this chart ends and while I cannot claim to know everything about it, but I am sure, it includes the acronym BOJ.
Returning to today, the BOJ is no doubt still a part of the problem/illness and we can argue as much as we want about massive debt, intervention and QE with all its consequences. At the end of the day, what really matters and what do not lie is the price chart. Thus, it is of course important to wait for the month to close before reaching a final verdict but we may already get a hint from the Weekly chart.
Weekly Chart
After experimenting with various combinations of 3s and 5s for the last wave down, the only solution that really makes sense to me is to count it as a 3x3, or (W)(X)(Y) as the Y-wave of a larger WXY. This means, despite weekly rejection we just have seen price is likely to come higher once again, before a final move down to a new and final low.
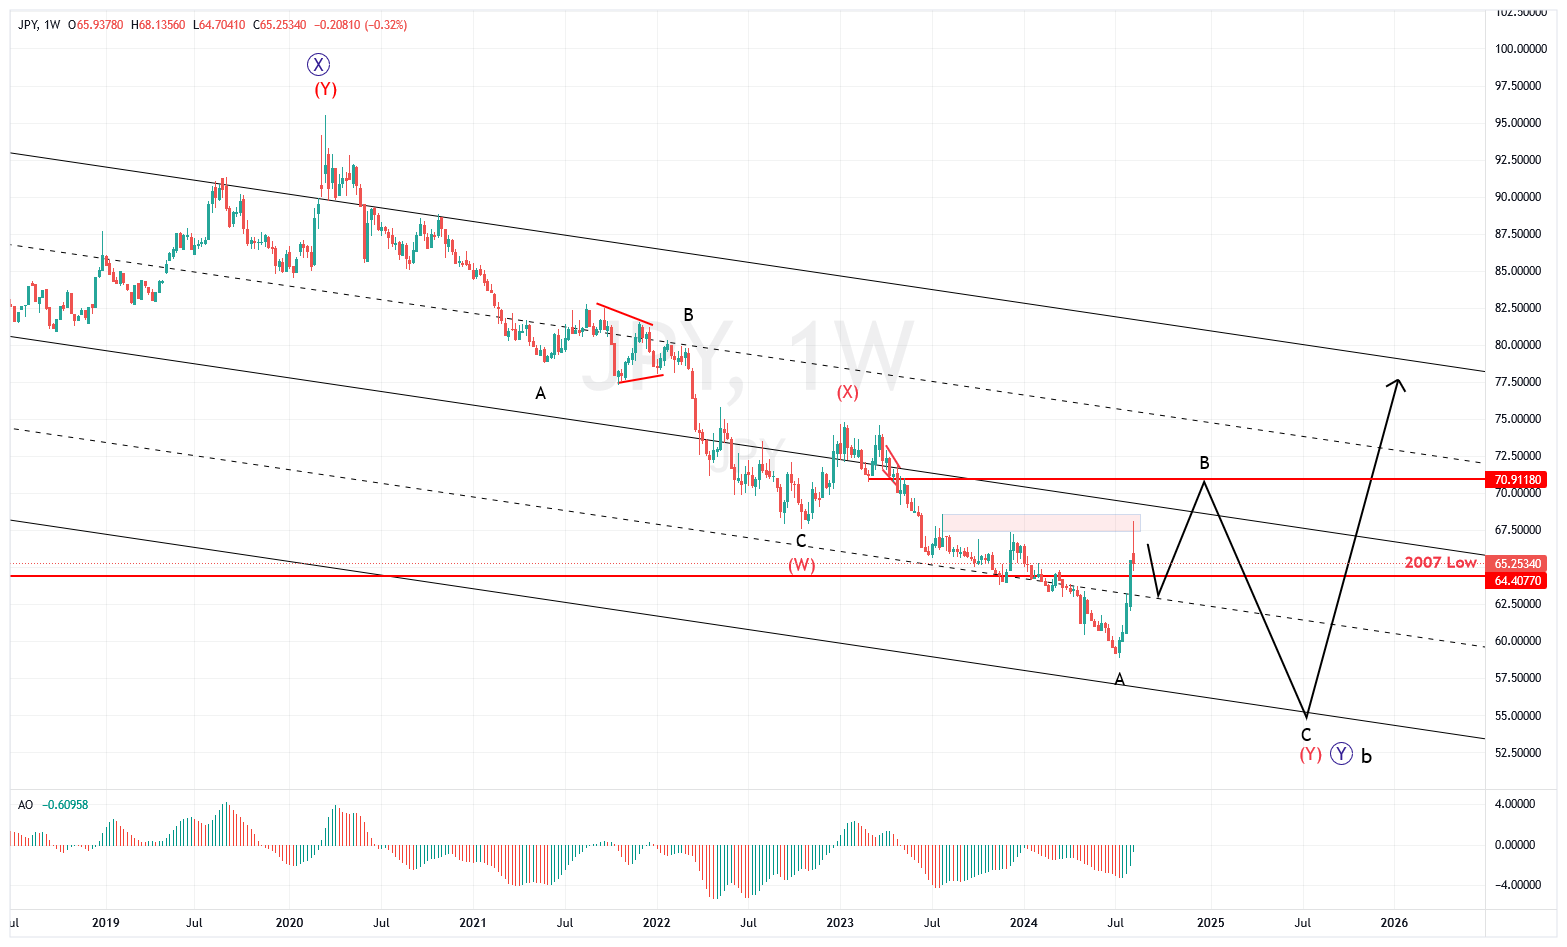
Just to make it clear, this is what the chart suggests to me, not what I think will happen due to what BOJ will or won’t do etc. They will probably try all kind of tricks but the market will try to front run it and then we have the safe haven play on top of that. In the end, this is what I think will happen in any case. What’s more uncertain though is the time factor.
Daily Chart
For completeness, we can track this in more detail on the Daily chart, which shows that the rejection came already last Monday when BOJ sent signals that they may have overplayed their hand and gone too far. At the same time, the geopolitical tension also calmed down as doubts started to spread whether Iran/Hezbollah really would retaliate or not, or that it would be a weak/symbolic reaction only.
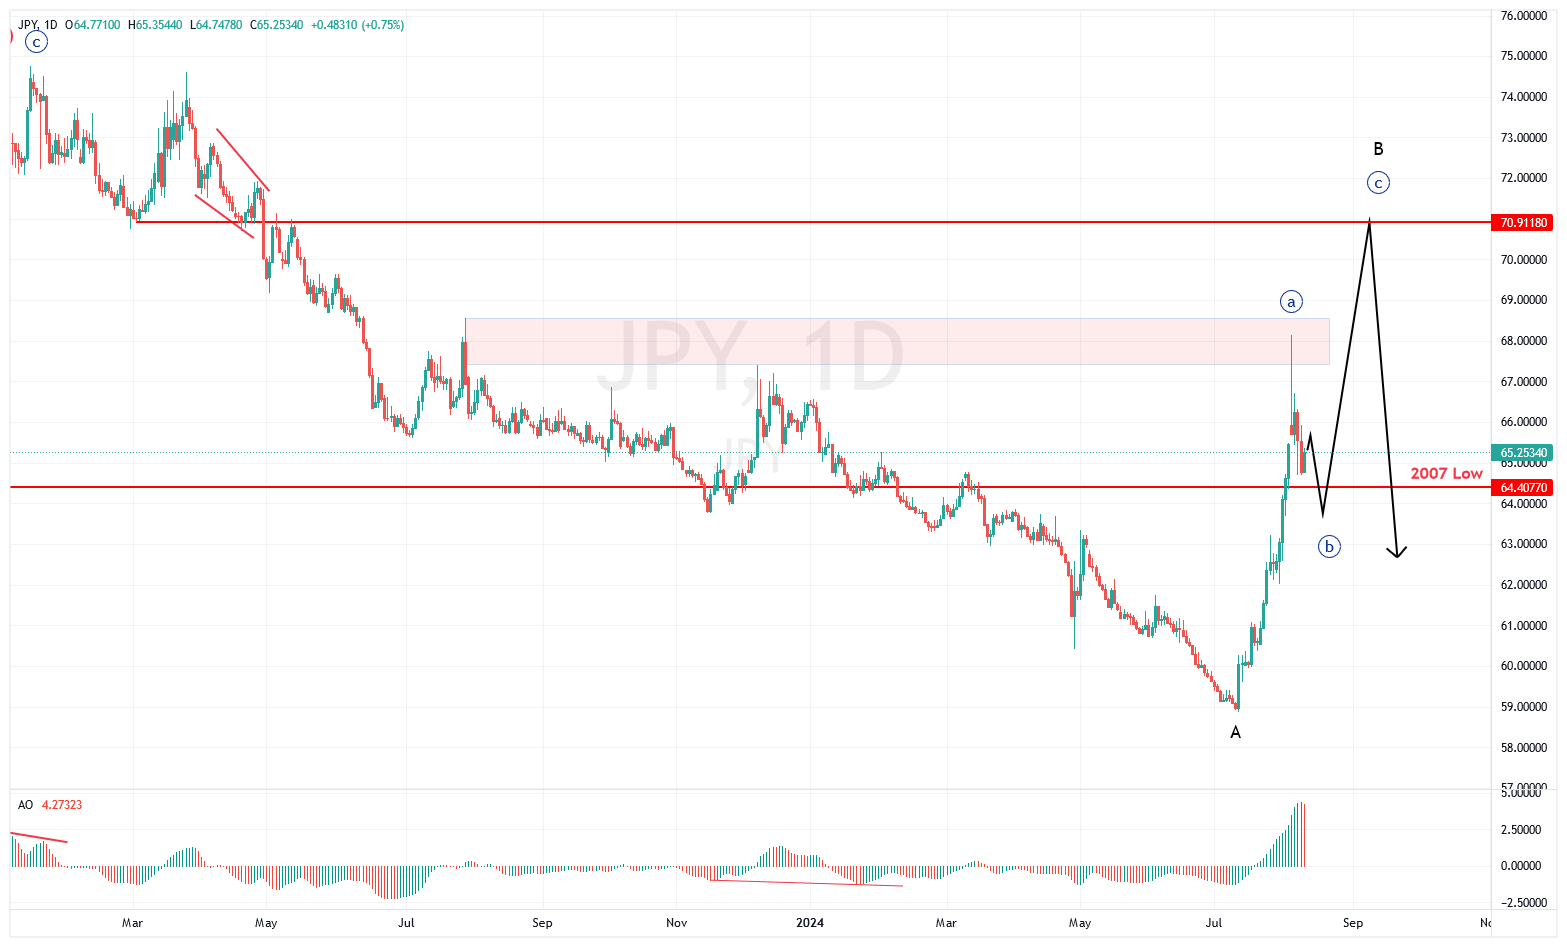
On the technical side, though, this is really a strong support/resistance area around the 2007 low and I expect it to be tested again. This will almost certainly be followed by another push higher into another strong resistance area and supply zone. If it breaks through there, well then, the bottom may be in after all, but at this point in time, I do not think that is the case.
Conclusion
I like to wait for this monthly candle to close before taking any action getting involved with the Yen, unless there are clear signs there is more downside to follow. Last Monday we saw a rejection, on Friday a recovery – what will this Monday bring? If we get a retest of 2007 low and it hold, it can be a signal that next stage of the “unwind” is to play out and we can follow. However, in such case do not forget to secure your profits (with a stop) as the turnaround can be both swift and brutal.