

Main Elliott Wave count of CAD currency basket against 16 other currencies (EUR, USD, GBP, CHF, JPY, CAD, AUD, NZD, CNH, DKK, MXN, NOK, PLN, SEK, SGD, ZAR, TRY).
Monthly Chart
The Loonie, as the Canadian Dollar often is nicknamed, made a high in November 2007, which was quickly left behind as the GFC. It then panned out a large 3 waves swing during 8 years ending with a major low in Jan 2016. The following recovery ended in Sep 2022 exactly at 61.8% of the big swing high to low. This recovery, again, came in 3 waves only and as the following price action has overlapped with the structure on the other side this is technically still an ongoing correction.
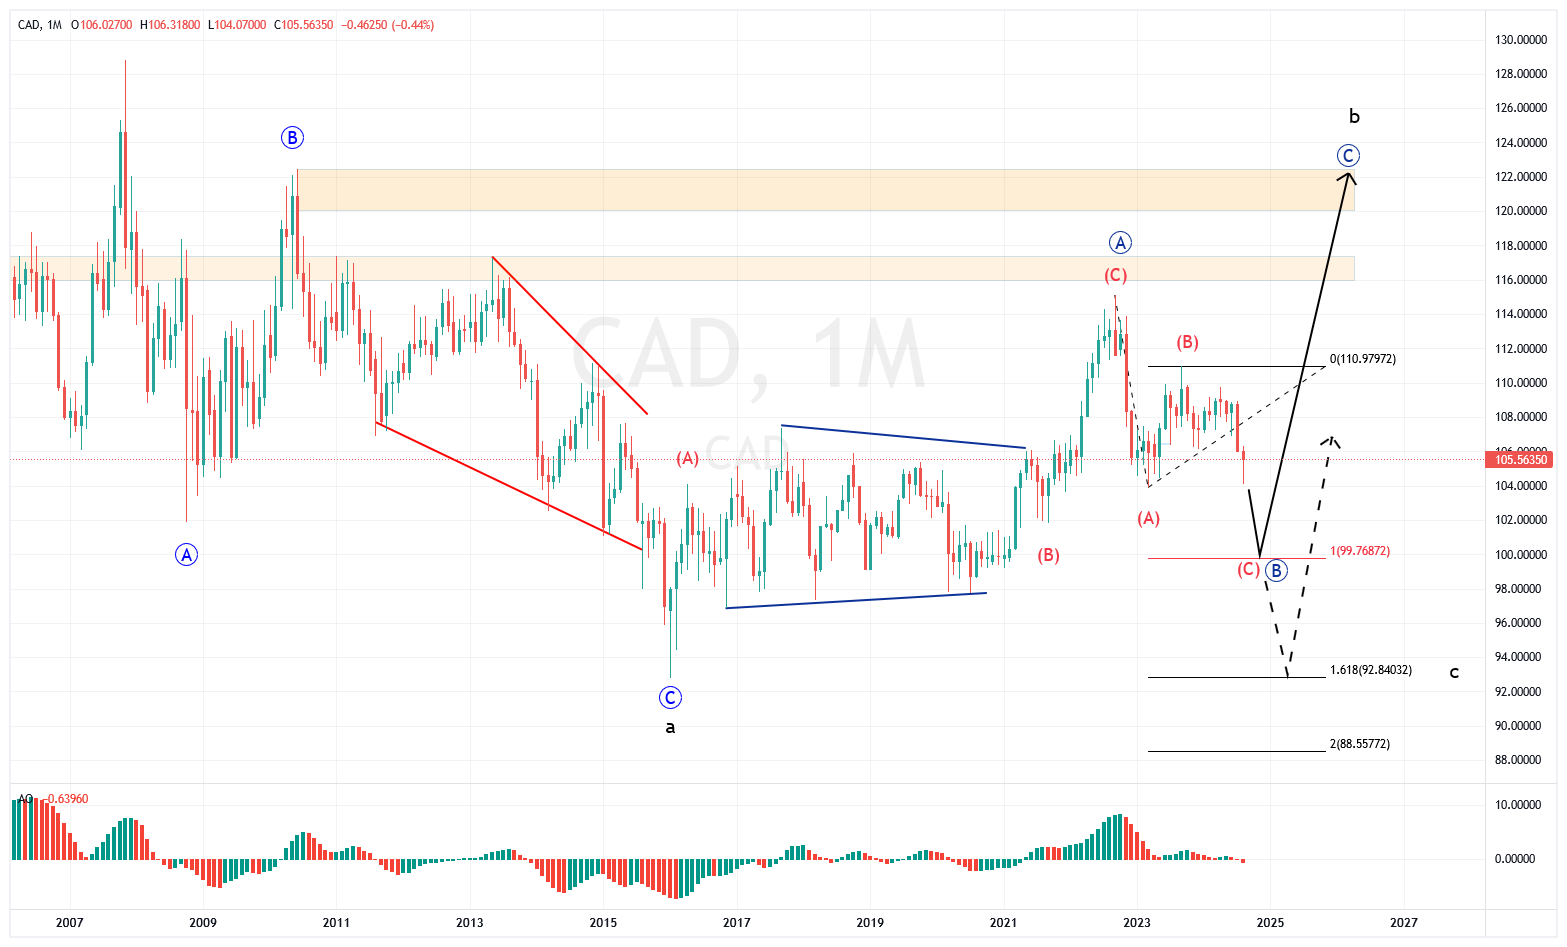
The expectation for near term price action is for price to continue lower and complete wave (C) of a larger degree wave B, before the Sep 2022 high will be challenged. The depth of this C-wave can only be speculated about but an approximate wave C=A seems to be a reasonable starting point.
The CAD is very sensitive to the global business cycle and its well-being due to its correlation with Oil. So if it looks to be correcting lower still that may as well be a tell for the black stuff. Although, it should be said that the correlations isn’t perfectly 1:1 and not always there but at large the two tends to follow each other.
The monthly candle for August is currently in strong recovery mode, after having lost a few big handles during July and beginning of this month. We need to be careful though as the month isn’t even halfway yet and a lot can still happen before the candle closes. Only a closed monthly candle is tradable and that is also true no matter time frame.
Weekly Chart
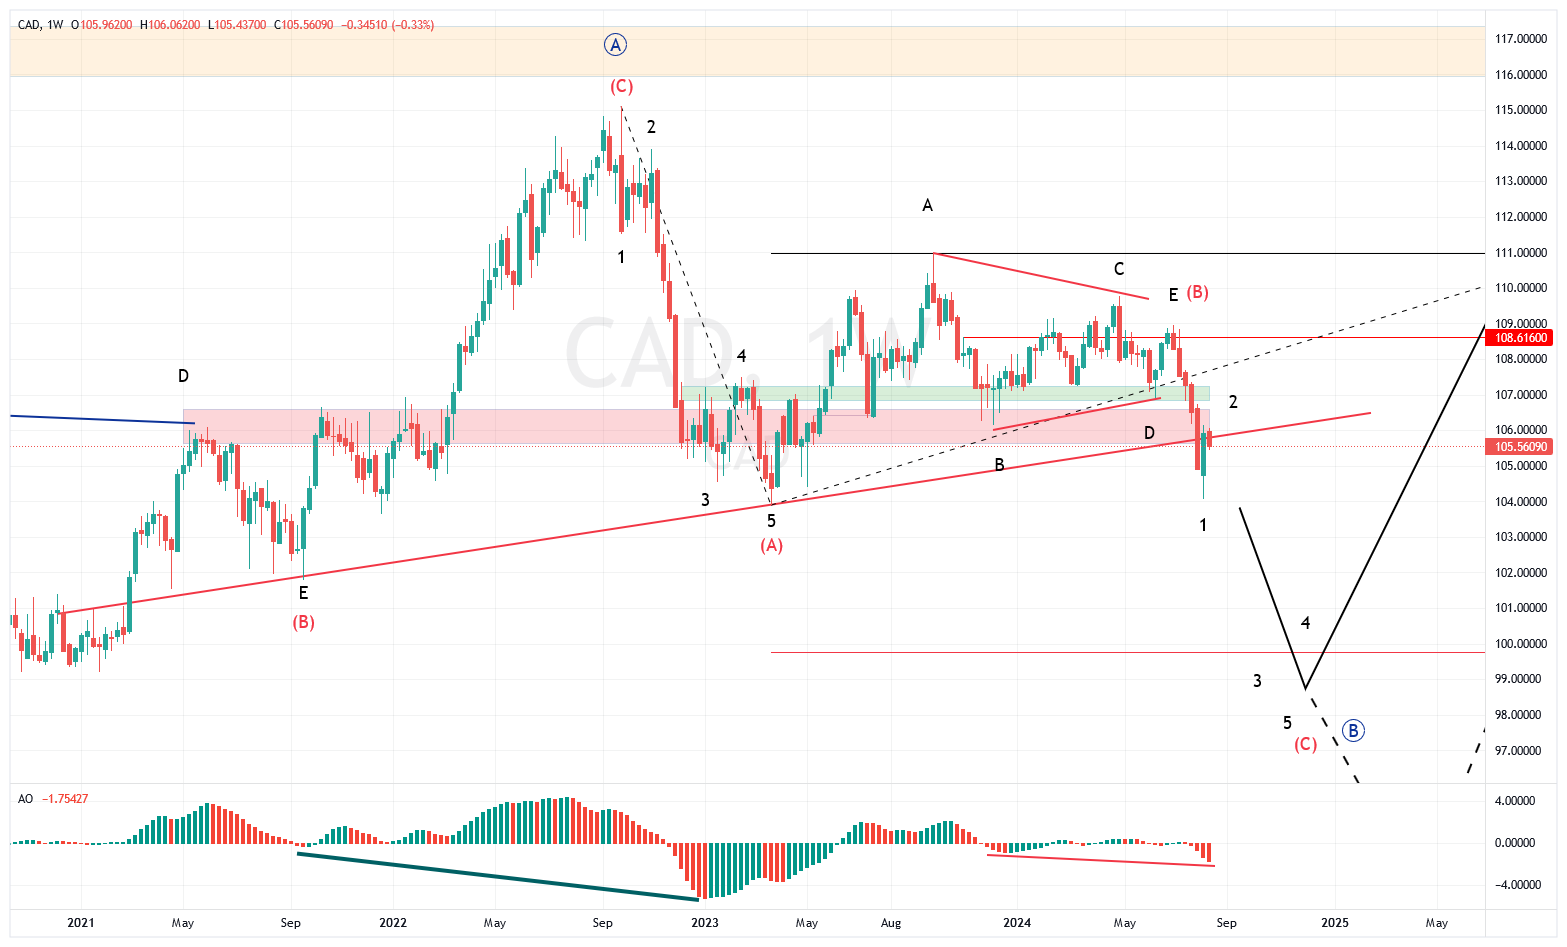
The weekly chart doesn’t reveal that much more. We can easily count 5 waves down from the Sep-22 high but the following sideways structure is a bit messier, which is rather typical for a B-wave, indeed. Wave (B) can indeed also be counted as a triangle but if that is the correct count can only be determined once next wave unfolds.
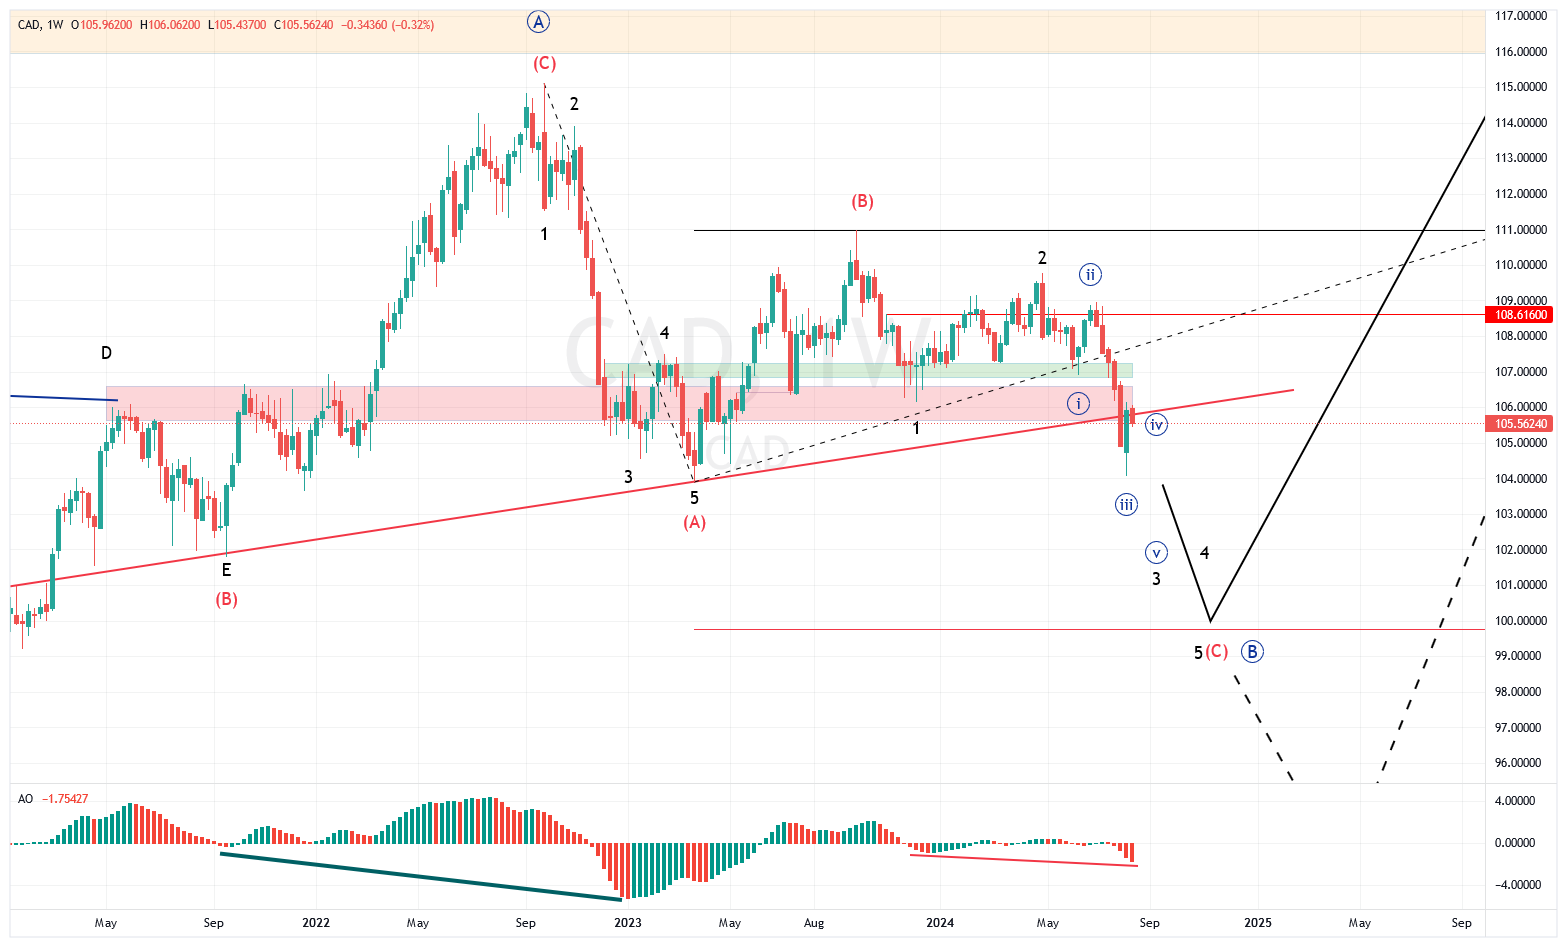
If price were to drop deeper than the current C=A estimate, then I would probably go for the triangle instead but there is no reason nor does it make any sense to push things to the extreme as it would only be speculation anyway.
Conclusion
Oil is currently hold up by the geopolitical situation around Israel/Iran and that pretty much guides CAD as well. Therefore, I would like to see what comes out of that situation as it may change the current expectation. There is also a H&S pattern, which is better seen on Weekly and want to see price put some distance to the neckline, whatever side that may be, before increasing my conviction.