

The world of trading can often feel like a maze. Price moves unpredictably, breaking through support and resistance levels, leaving us wondering how to make sense of it all. Understanding market structure is one of the most powerful ways to decode the chaos and make more informed trading decisions.
But what exactly is market structure? Simply put, market structure refers to the way price moves over time - whether it’s trending up, down, or moving sideways. Understanding these movements and recognizing patterns allows traders to make better decisions and anticipate where price might go next.
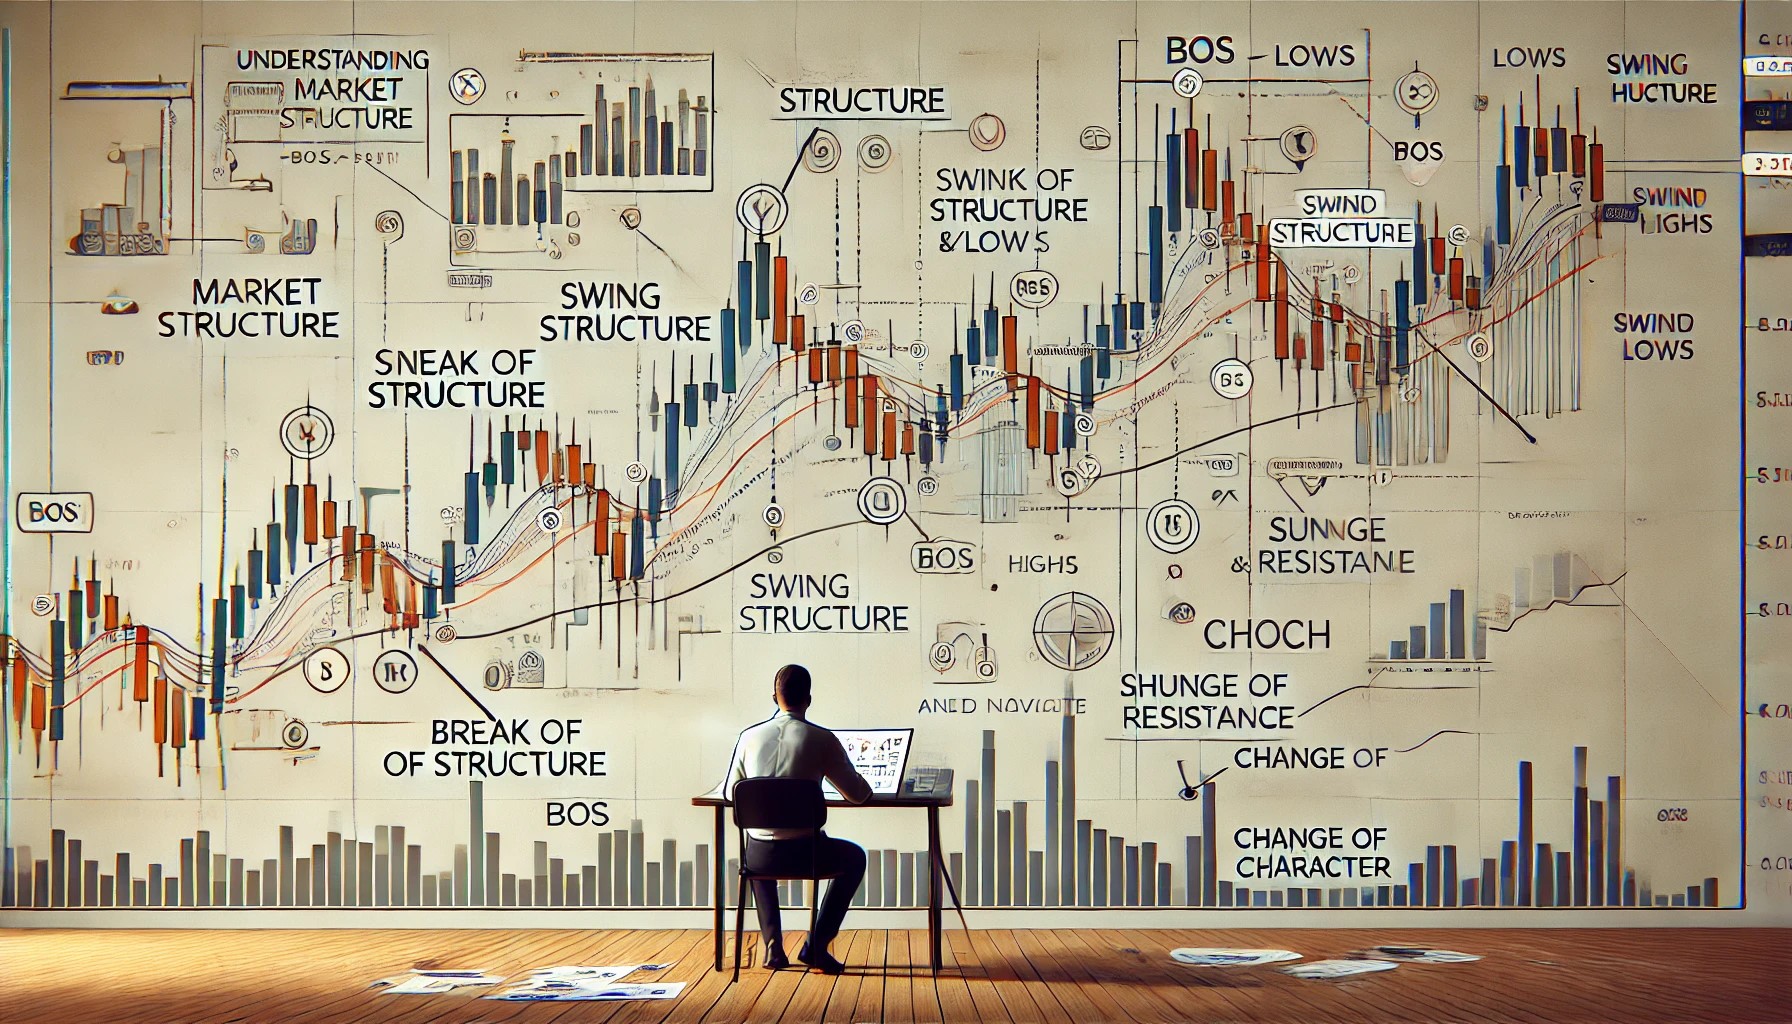
What is Market Structure?
At its core, market structure is the framework for understanding price movements in the market. It encompasses:
Trends: A trend is simply the direction the market is moving. If prices are consistently rising, it's an uptrend. If they are consistently falling, it’s a downtrend. When the market isn’t clearly moving in one direction, it's in a sideways trend, also known as consolidation.
Support & Resistance: Support is where the price tends to stop falling and reverses upward. Resistance is the opposite; it's where the price tends to stop rising and reverses downward. These levels are critical in understanding price action.
Breakouts & Reversals: Breakouts occur when price moves beyond established support or resistance levels, signaling potential trend continuation. Reversals occur when price moves in the opposite direction after testing support or resistance.
Why is Market Structure Crucial for Traders?
Market structure is key because it helps traders make sense of price movements. When you understand whether the market is trending or consolidating, you can choose appropriate strategies. For example, in trending markets, trend-following strategies can work well. In range-bound markets, trading reversals at key support and resistance levels might be more effective.
Recognizing market structure also helps avoid false signals. A reversal in a strong trend is more likely to result in a fake-out, while trading with the trend can be more profitable and less risky.
Key Components of Market Structure
Trends: The simplest form of market structure. By identifying trends, you can align your trades in the direction of the market's momentum.
Support & Resistance: These levels are crucial in identifying potential entry and exit points. If price approaches resistance, it may be a sign to sell, while price near support might suggest a buying opportunity.
Breakouts and Reversals: Understanding when a trend is breaking out or reversing allows you to catch major moves early. Knowing these moments helps with timing entries and exits more effectively.
How to Navigate Market Structure
Tools like Dynamic Support & Resistance and RangeSniper are great aids in identifying market structure. Dynamic Support & Resistance levels help define where key price action is likely to occur. RangeSniper helps identify trends and areas where volatility is compressing, signaling possible breakouts.
It’s important to combine these tools with your understanding of price action. For example, if you see a support level holding strong and RangeSniper shows bullish conditions, it could signal an excellent long trade setup.
Final Thoughts
Mastering market structure is one of the most powerful skills a trader can have. By understanding how the market is moving, you can better predict where it’s likely to go. The more you practice identifying market structure and combining it with tools like Dynamic Support & Resistance, RangeSniper or Trapped Traders, the more confident and effective you’ll become as a trader.
🚨 Risk Disclosures
⚠️ Risk Disclosure
Futures and forex trading involve substantial risk and are not suitable for every investor. An investor could potentially lose all or more than their initial investment. Only risk capital should be used for trading, meaning money that can be lost without jeopardizing one’s financial security or lifestyle. Past performance is not necessarily indicative of future results.
📊 Hypothetical Performance Disclosure
Hypothetical performance results have many inherent limitations. No representation is being made that any account will or is likely to achieve similar profits or losses as those shown. Hypothetical trading does not involve financial risk, and it cannot fully reflect the emotional and psychological factors of real trading.
Additional factors, such as market conditions, liquidity, and execution delays, may adversely affect trading results. It is important to understand that all trading involves risk, and no trading strategy or indicator can guarantee profits.
Trade responsibly!