

Exploring opening ranges across markets, trading sessions, and the price behavior that follows.
By the SharpWick Team
Introduction: Is the First Breakout Really the Most Important Event?
The Opening Range Breakout (ORB) is one of the most familiar concepts in intraday trading.
Define a range near the beginning of a trading session. Identify its high and low. Observe what happens when price moves beyond either boundary.
The conventional approach often reduces this process to a straightforward trading rule:
Buy above the Opening Range High. Sell below the Opening Range Low.
It is simple, intuitive, and easy to visualize.
But simplicity raises an important question.
Does crossing the Opening Range boundary actually provide a persistent trading advantage?
Research on Opening Range strategies has produced mixed results. Some studies have reported favorable outcomes in particular markets and periods, while others have challenged the profitability of mechanical breakout rules once transaction costs are considered.
This suggests that the Opening Range may be more useful as a framework for observing market behavior than as a standalone trading signal.
And it leads to a different question:
What happens after the market leaves the Opening Range?
That question is the starting point for this article.
1. There Is More Than One Market Opening
When traders discuss the Opening Range, they often have a particular market and session in mind.
For U.S. equity-index futures, the opening of the underlying American stock market is a natural reference point.
But futures markets extend far beyond U.S. equity indices.
Energy, precious metals, currencies, interest rates, agricultural products, and international equity indices operate under different market structures and trading schedules.
Many futures contracts trade electronically for much of the day, sometimes with only relatively short maintenance breaks.
Consequently, the term market open is not always as straightforward as it appears.
Depending on the instrument, traders may be referring to:
The beginning of the underlying cash-market session.
The opening of a regional financial market.
The start of a futures contract's regular trading hours.
The resumption of electronic trading after a scheduled break.
A period associated with important scheduled economic information.
These events are not interchangeable.
A cash-market opening can bring participation from a different group of market participants than an electronic-session restart.
An economic announcement can produce a sharp increase in activity without representing the opening of a trading session at all.
For analytical purposes, these distinctions matter.
The Opening Range is therefore not necessarily tied to one universal clock time.
It is a reference structure established around a deliberately selected market event.
Different Markets, Different Reference Events
Consider several broad categories.
U.S. Equity-Index Futures
Contracts linked to major American stock indices can be studied around the opening of the underlying U.S. equity market.
Energy Futures
Crude-oil markets have their own trading schedules, historical session conventions, and sensitivity to energy-related information.
Precious-Metal Futures
Gold and silver markets trade across international sessions. Their activity may be influenced by regional market participation, currency movements, and scheduled economic announcements.
European Equity-Index Futures
European index futures can be examined around the opening of their underlying cash markets, as well as other relevant trading-session transitions.
Asian Equity-Index Futures
Japanese and other Asian index futures provide additional opportunities to study how price behaves around regional market openings.
None of these reference events should automatically be assumed to produce a profitable Opening Range strategy.
Each represents a separate research question.
The important point is that Opening Range analysis is not inherently limited to a single instrument, exchange, or trading session.
2. How Long Should an Opening Range Be?
The choice of market opening is only one part of the problem.
Another is the duration of the range itself.
Opening Ranges can be constructed using different observation windows.
A relatively short range captures the market's immediate response around the selected reference event.
A longer range incorporates more price development before its boundaries are established.
These choices can produce very different structures, even when applied to the same instrument and session.
A shorter range may be crossed more frequently, while a longer range may establish wider boundaries. The actual relationship depends on volatility, market conditions, and the chosen sampling method.
Neither approach is automatically superior.
Range duration affects several characteristics relevant to a trading strategy:
The distance between the upper and lower boundaries.
How frequently price moves beyond those boundaries.
The timing of potential trading opportunities.
The distance between a possible entry and a structural reference level.
The interaction between potential reward, risk, and transaction costs.
A configuration that appears promising in one market may behave differently in another.
Even within the same instrument, changing volatility regimes can alter the practical significance of a given range duration.
This is why the choice of Opening Range length should be treated as a research variable rather than a universal rule.
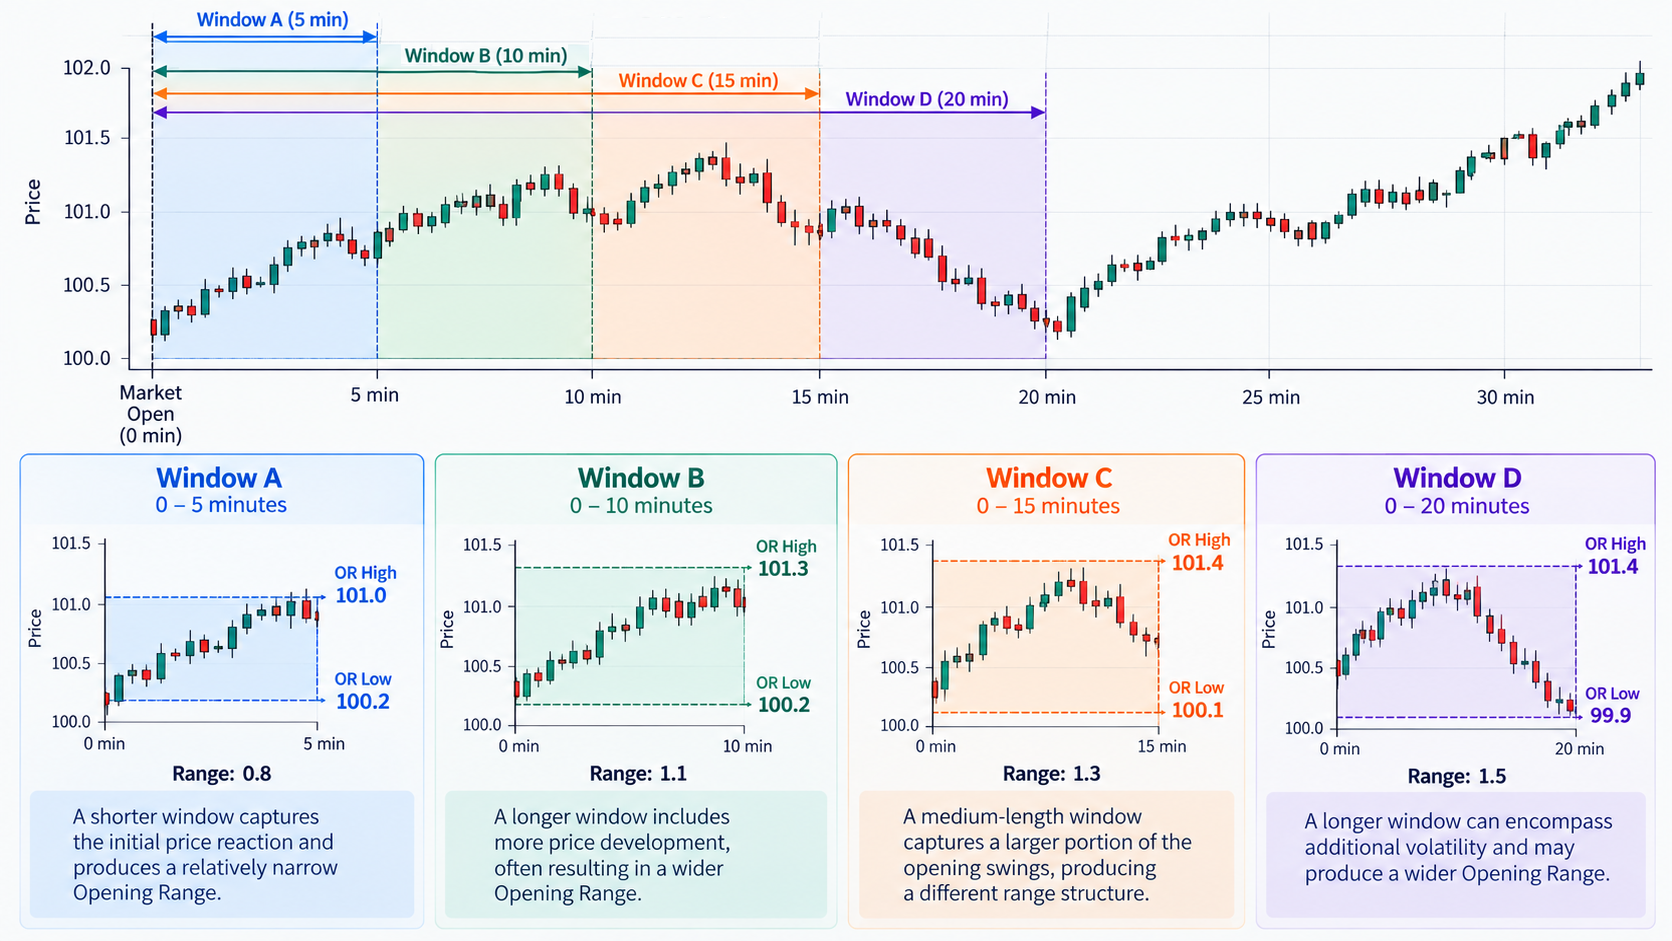 FIGURE 1 - Comparing Opening Range Structures
Conceptual illustrations for educational purposes. Not actual market data or trading signals.
3. The Opening Range as a Reference Structure
Once an Opening Range has been established, it provides two immediately observable reference levels:
Opening Range High (OR High)
Opening Range Low (OR Low)
These boundaries describe where price traded during the selected observation period.
They do not predict where price must travel afterward.
Their value is that they provide a consistent structure against which subsequent market behavior can be observed.
Price may remain inside the range.
It may break beyond one boundary.
It may return after the breakout.
It may repeatedly test a boundary without producing sustained movement.
Or it may eventually travel across the range and break its opposite side.
These sequences are different.
Treating them as distinct market events can provide a richer basis for analysis than simply recording whether a breakout occurred.
The central distinction is between identifying a market event and demonstrating that the event offers a tradable advantage.
The first is relatively straightforward.
The second requires evidence.
4. What Can Happen After the Opening Range?
There are numerous ways in which price can interact with an established Opening Range.
The following scenarios represent broad categories of market behavior, not an exhaustive classification or a set of automatic trading instructions.
Scenario A: Initial Breakout
Price moves beyond the Opening Range High or Low for the first time.
This is the familiar ORB event.
It establishes that the market has traded outside its initial reference structure.
What happens afterward remains uncertain.
Scenario B: Breakout and Continuation
After moving beyond the range, price continues developing in the breakout direction.
Such movement may appear directional and convincing on a chart.
However, identifying a strong continuation retrospectively is not the same as predicting it in advance.
Scenario C: Breakout, Retest, and Continuation
Price moves beyond a boundary, returns toward the original structure, and subsequently resumes movement in the breakout direction.
This sequence introduces additional observations concerning the market's behavior after the first breakout.
It also raises questions about the depth, timing, and character of the return.
Those questions can be investigated statistically without assuming that every retest represents a trading opportunity.
Scenario D: Failed Breakout and Range Re-entry
Price moves beyond a boundary but subsequently returns inside the Opening Range.
A return inside the range may indicate that the initial move did not develop into sustained expansion.
But re-entry alone does not establish that the market will reverse or reach the opposite boundary.
Scenario E: Opposite-Side Breakout
After an initial breakout and subsequent return, price travels across the Opening Range and moves beyond its opposite boundary.
This sequence differs from a conventional first breakout because the market has already interacted with the other side of the structure.
The preceding price path provides additional context.
Scenario F: Range Compression and No Breakout
Sometimes the market remains inside the Opening Range for an extended period.
At other times, price may repeatedly approach the boundaries without producing meaningful expansion.
The absence of a breakout is itself an observable outcome.
For a trading strategy, the decision not to trade can be just as important as identifying a possible entry.
Scenario G: Multiple Boundary Tests
Price may cross or test the same boundary repeatedly.
The first attempt may fail, while a later attempt develops differently.
Alternatively, repeated tests may lead to continued consolidation rather than expansion.
These situations raise questions about whether repeated boundary interactions contain useful information.
The answers cannot be determined reliably from a handful of attractive chart examples.
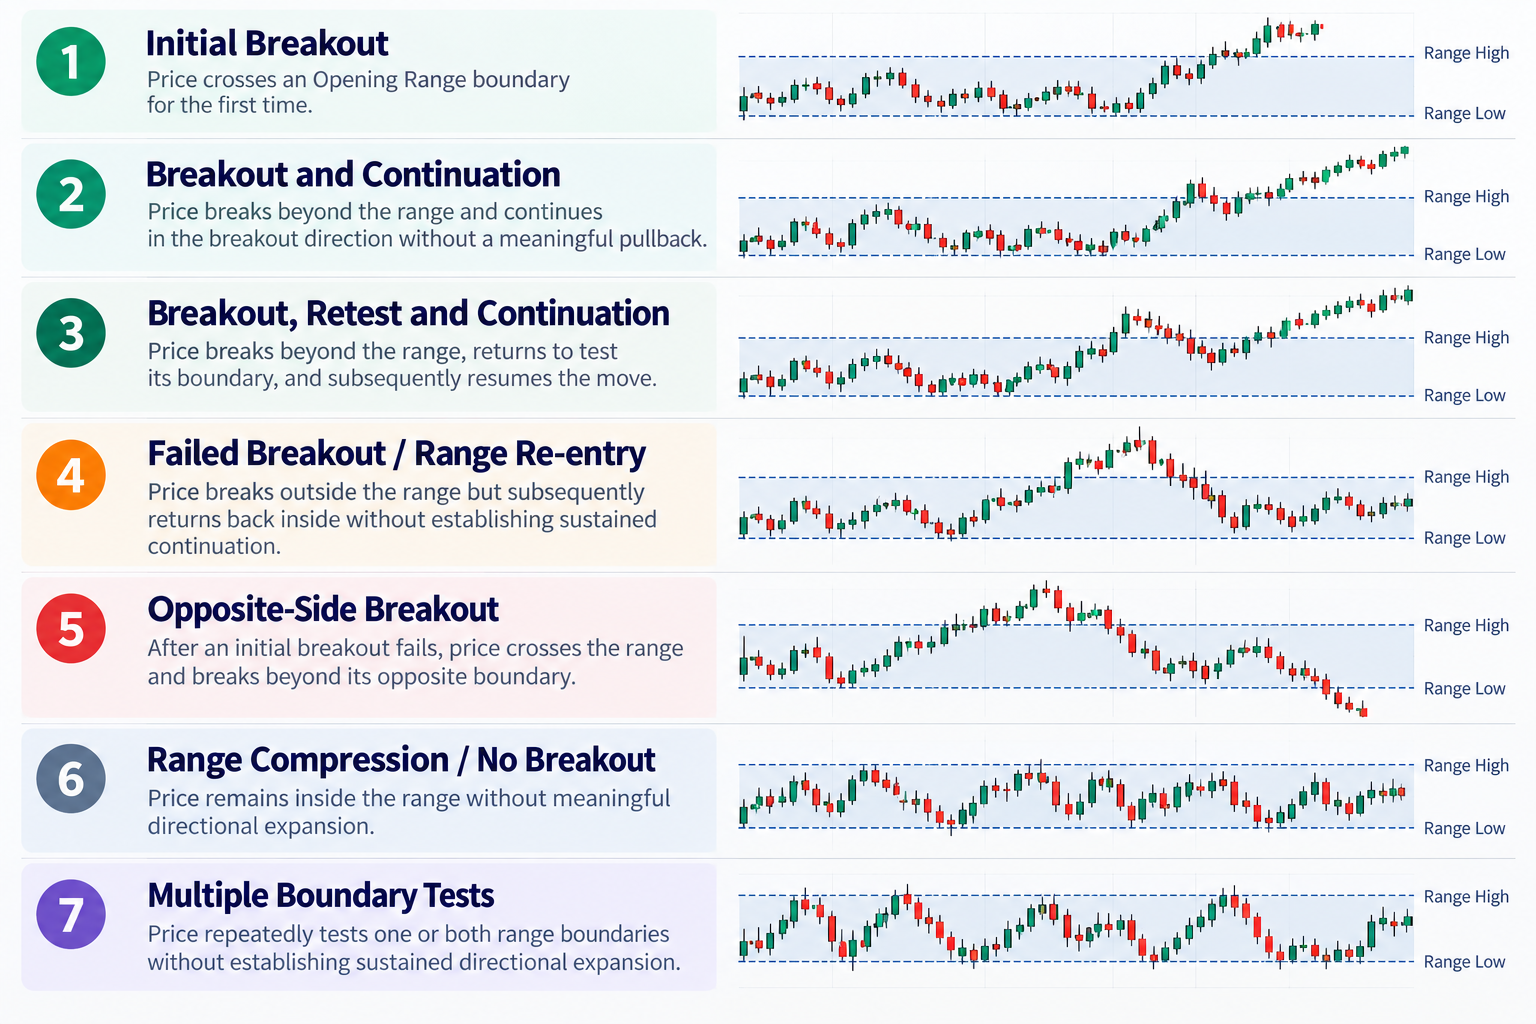 FIGURE 2 - Possible Post-Opening Range Price Paths
Conceptual illustrations for educational purposes. Not actual market data or trading signals.
5. Market Context Matters
Two visually similar breakouts can occur under very different market conditions.
One may take place during expanding volatility.
Another may occur when price movement is relatively subdued.
One may be aligned with a broader intraday trend.
Another may move against it.
A breakout may occur near an important session reference level, or at a considerable distance from it.
Executed order flow may also differ between apparently similar price movements.
These differences motivate the study of market context.
Common analytical tools include:
Volatility measures, such as Average True Range (ATR), which help describe recent price movement.
Trend measures, including moving averages, which provide a reference for directional market conditions.
Volume Weighted Average Price (VWAP), which offers a volume-weighted reference for traded prices over a defined period.
Order Flow Delta, which describes differences between buyer-initiated and seller-initiated traded volume under a given classification method.
Volume imbalance, which can help characterize aggressive participation at particular price levels.
None of these measures can reliably identify the intentions of individual market participants.
Nor does adding more indicators automatically improve a strategy.
Additional conditions may reduce trading frequency, increase complexity, or introduce overfitting without improving results.
The appropriate question is not whether a filter sounds useful.
It is whether the filter produces a measurable improvement under realistic testing conditions.
Market context should be evaluated, not romanticized.
6. A Recognizable Pattern Is Not Necessarily a Trading Edge
The distinction between market structure and profitability is particularly important in Opening Range research.
A pattern can be easy to identify and still be difficult to trade profitably.
Research has reported differing results across instruments, market conditions, and testing methods.
Holmberg, Lönnbark, and Lundström (2013) examined intraday Opening Range Breakout strategies in crude-oil futures and found that performance depended on the period and conditions being studied.
Tsai and colleagues (2019) investigated Opening Range trading in index-futures markets, highlighting the importance of trading activity and market timing.
More recently, Pineda (2026) examined the relationship between breakout, retest characteristics, and subsequent outcomes in QQQ. The study was exploratory and did not establish that the observed relationships represented an exploitable trading advantage.
A September 2026 preprint by Fetna provides a particularly important skeptical perspective.
The study evaluated 225 predefined ORB configurations across nine liquid U.S. futures markets using data spanning 2010–2026.
Under its specified transaction-cost assumptions, none of the tested configurations met the study's pre-registered positive-performance criterion.
That finding does not prove that every possible Opening Range methodology is unprofitable.
It does, however, challenge the assumption that a simple mechanical breakout rule necessarily provides a durable advantage.
The broader lesson is straightforward.
The presence of a recognizable price pattern is not sufficient evidence of profitability.
A credible trading approach requires testing that accounts for commissions, slippage, changing market conditions, and the risk of selecting parameters that happened to work well in historical data.
7. From Market Observation to a Structured Trading Process
Recognizing a market event is only the beginning of developing a practical trading methodology.
A complete trading process must also address questions that are independent of the initial signal.
How should position size be determined?
How much capital should be exposed to a particular trade?
How should protective orders be managed?
When should trading activity be restricted?
How should the system respond when market conditions or execution circumstances differ from expectations?
These considerations are particularly important in automated trading.
An automated strategy may execute consistently, but consistency alone does not guarantee that its decisions are profitable.
Likewise, a technically correct entry does not eliminate the possibility of adverse price movement, slippage, order rejection, or connectivity problems.
This leads to an important principle:
Trade identification, execution, and risk management should be treated as related but distinct parts of a trading framework.
Each requires its own design decisions and testing.
8. SharpSizer ORB: An Example of This Approach
The questions explored in this article also influenced the development of SharpSizer ORB, a trading strategy framework for NinjaTrader 8.
The project began with an Opening Range trading concept introduced by a collaborating trader.
Through continued development, testing, and feedback, the initial concept evolved into a broader framework combining Opening Range analysis, configurable market-context tools, trade execution, and risk management.
SharpSizer ORB is designed to evaluate several types of Opening Range behavior rather than relying exclusively on a single initial breakout event.
The framework incorporates configurable trading setups, optional market-context filters, position sizing, trade-management controls, and an interactive chart dashboard.
Its purpose is to provide a structured environment in which defined trading rules can be executed and monitored.
The specific internal conditions, parameter combinations, and implementation details are outside the scope of this article.
More importantly, the existence of such a framework should not be interpreted as evidence that any particular configuration is profitable.
The effectiveness of a trading methodology depends on the instrument, market conditions, execution assumptions, and results of rigorous testing.
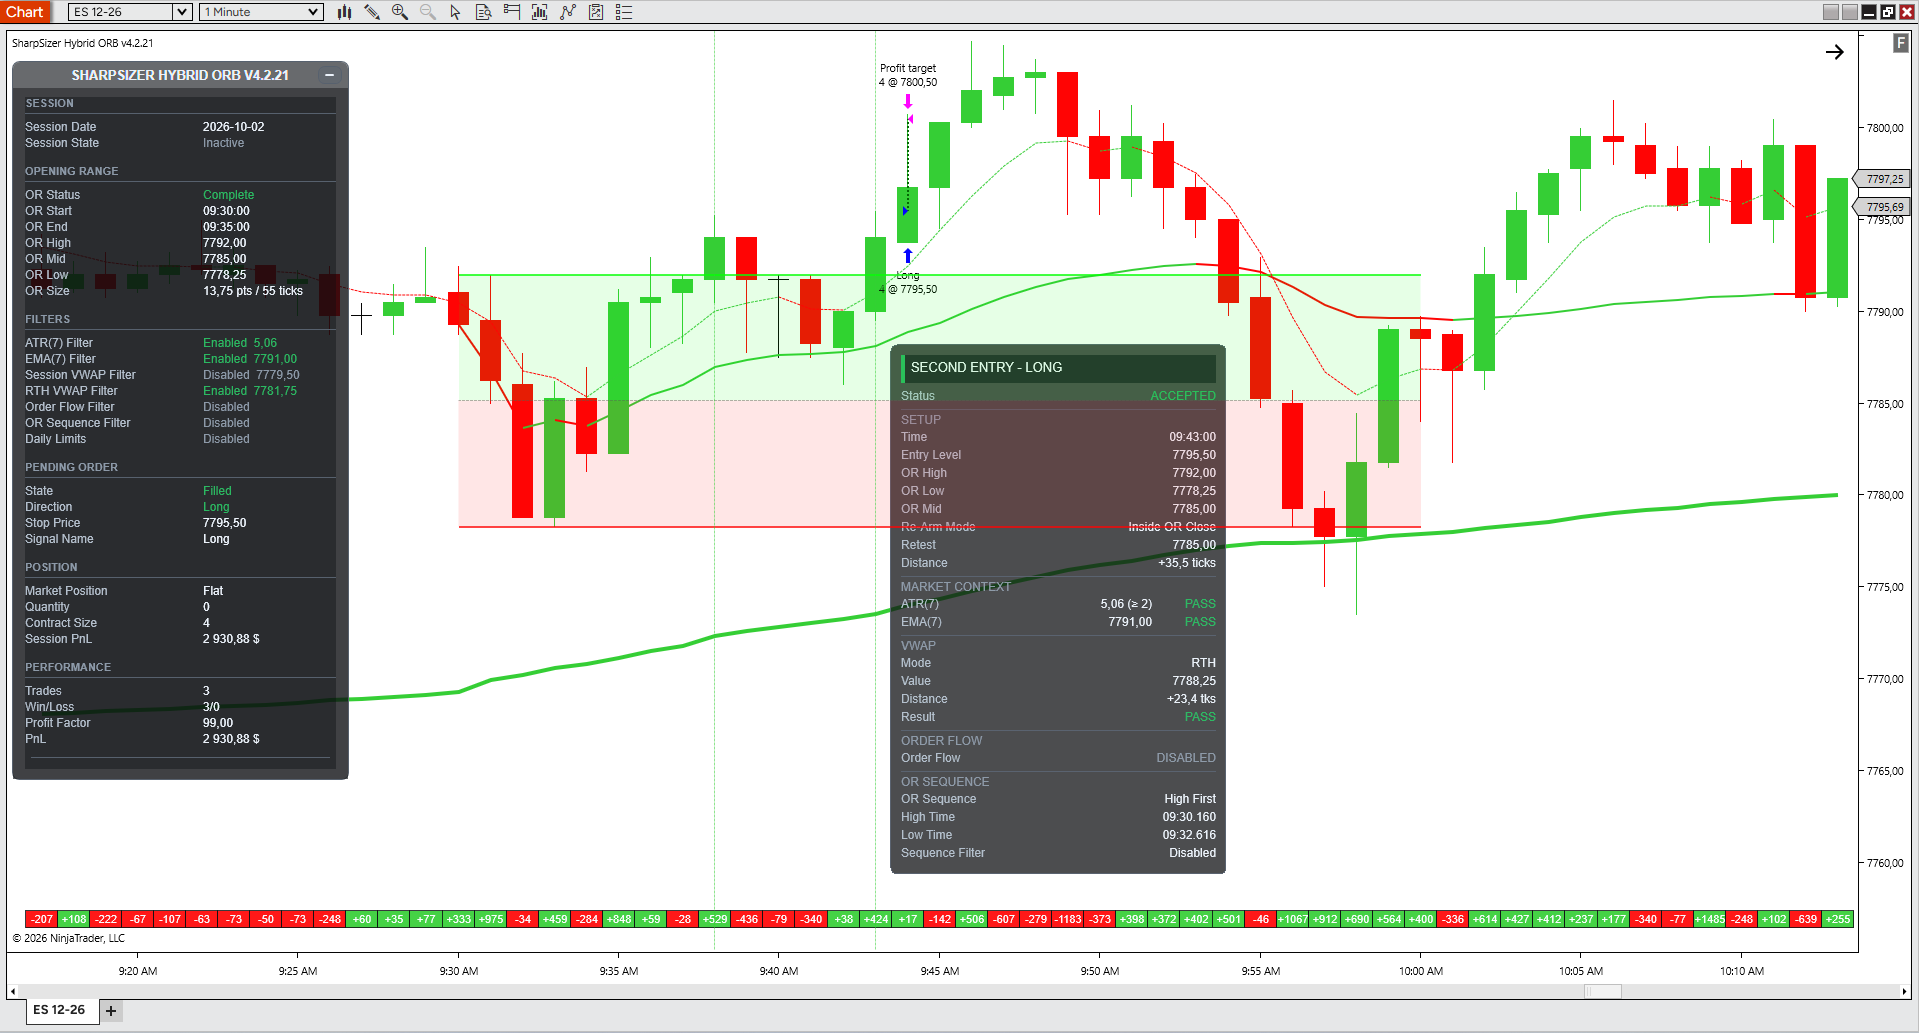 SCREENSHOT 1 - SharpSizer ORB in NinjaTrader 8
Actual NinjaTrader 8 chart showing SharpSizer Hybrid ORB v4.2.21 in action on ES futures (1-minute timeframe). The screenshot illustrates a validated Second Entry LONG setup, including Opening Range levels, filter confirmations, and trade execution. Historical example shown for educational purposes only. Past performance does not guarantee future results.
9. Why the Interface Matters
An automated strategy should provide enough information for a trader to understand and monitor its current operating state.
A chart can show the relevant price structure.
A dashboard can summarize position and order information.
Configuration controls can make the system's available capabilities accessible without requiring changes to source code.
These elements do not create a statistical trading advantage.
They can, however, improve the transparency and usability of the trading process.
SharpSizer ORB combines chart-based visualization with an interactive dashboard designed to support trade monitoring and management.
Depending on its configuration and operating state, the interface provides information about the strategy, relevant market structures, positions, and available trade-management actions.
The framework also includes configurable protective-order management, daily trading restrictions, and an optional mechanism intended to respond to detected loss of Stop Loss protection.
Such safeguards are not guarantees.
A market order submitted in an emergency can still experience delay, rejection, or unfavorable execution.
Nevertheless, operational risk deserves attention alongside trading-signal research.
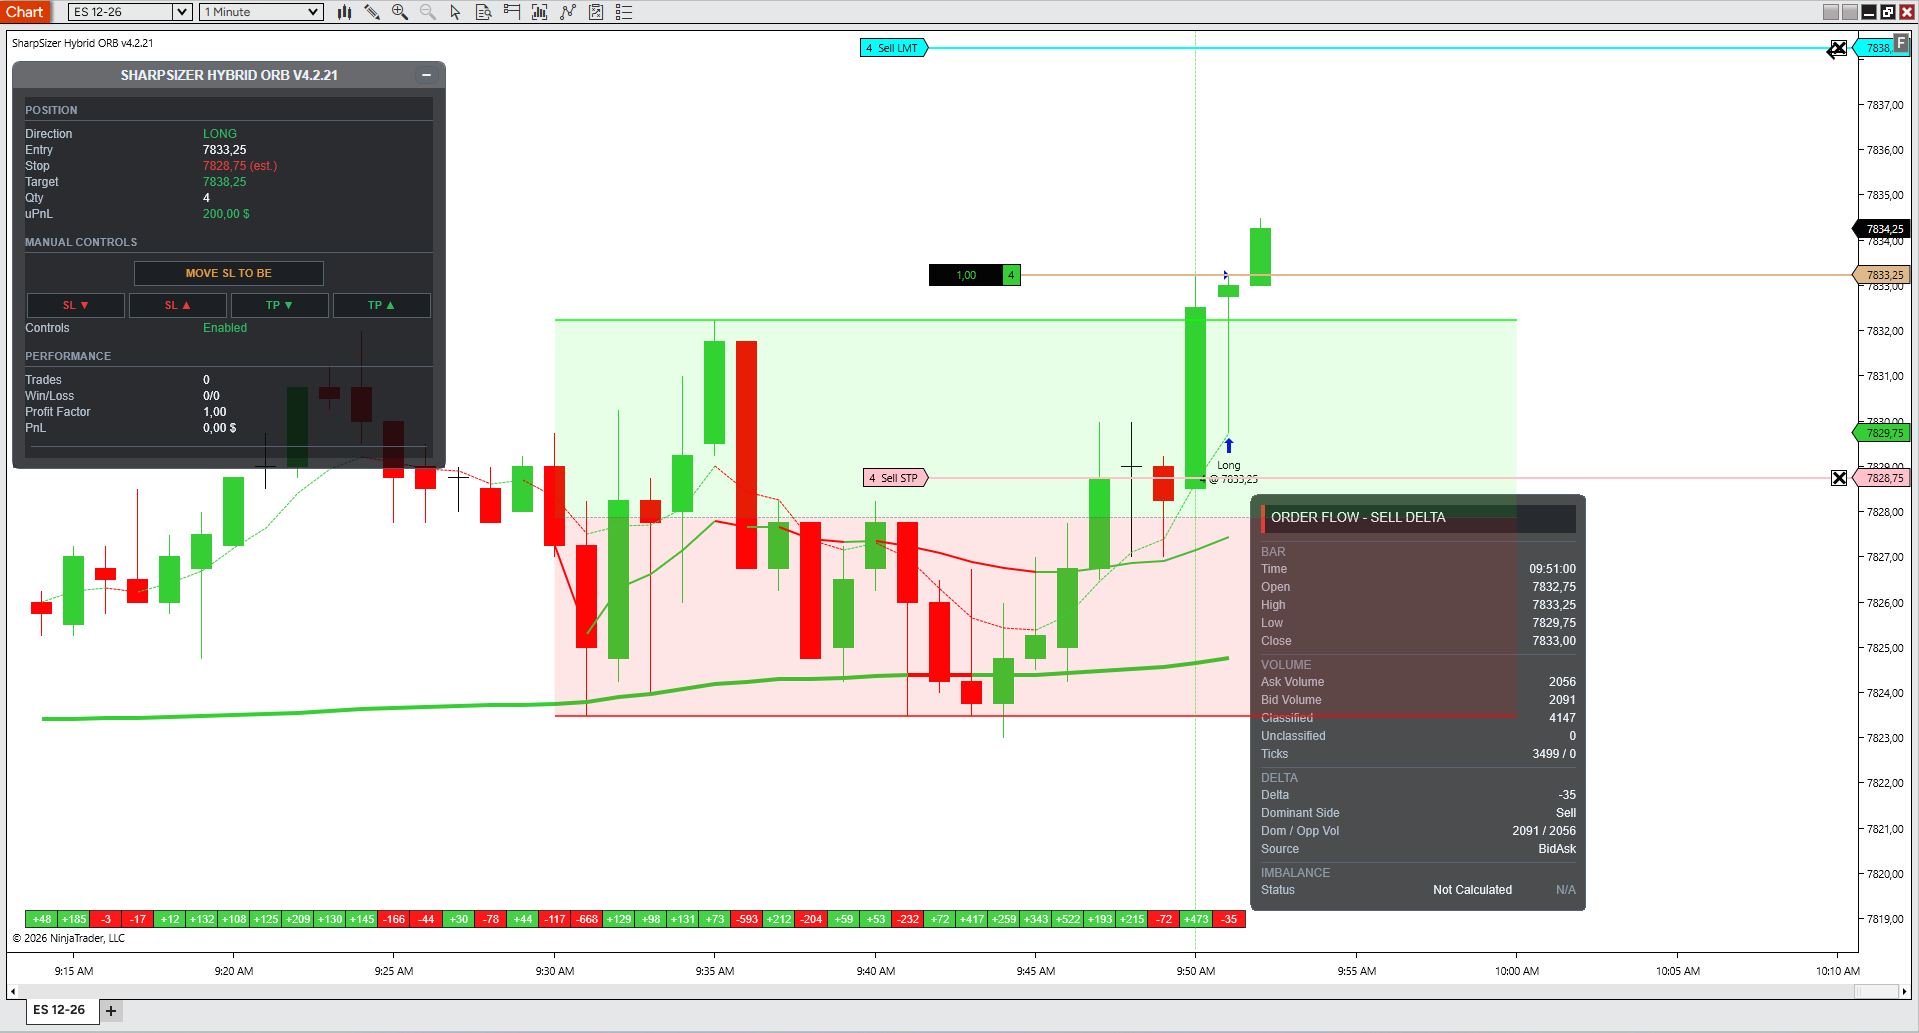 SCREENSHOT 2 - Interactive Dashboard and Trade Management
Actual NinjaTrader 8 screenshot illustrating SharpSizer Hybrid ORB's interactive dashboard and position-management controls. The interface provides real-time trade monitoring and manual intervention capabilities. Shown in a simulated trading environment for illustrative purposes. Automated trading involves risk, and protective orders do not guarantee execution at the intended price.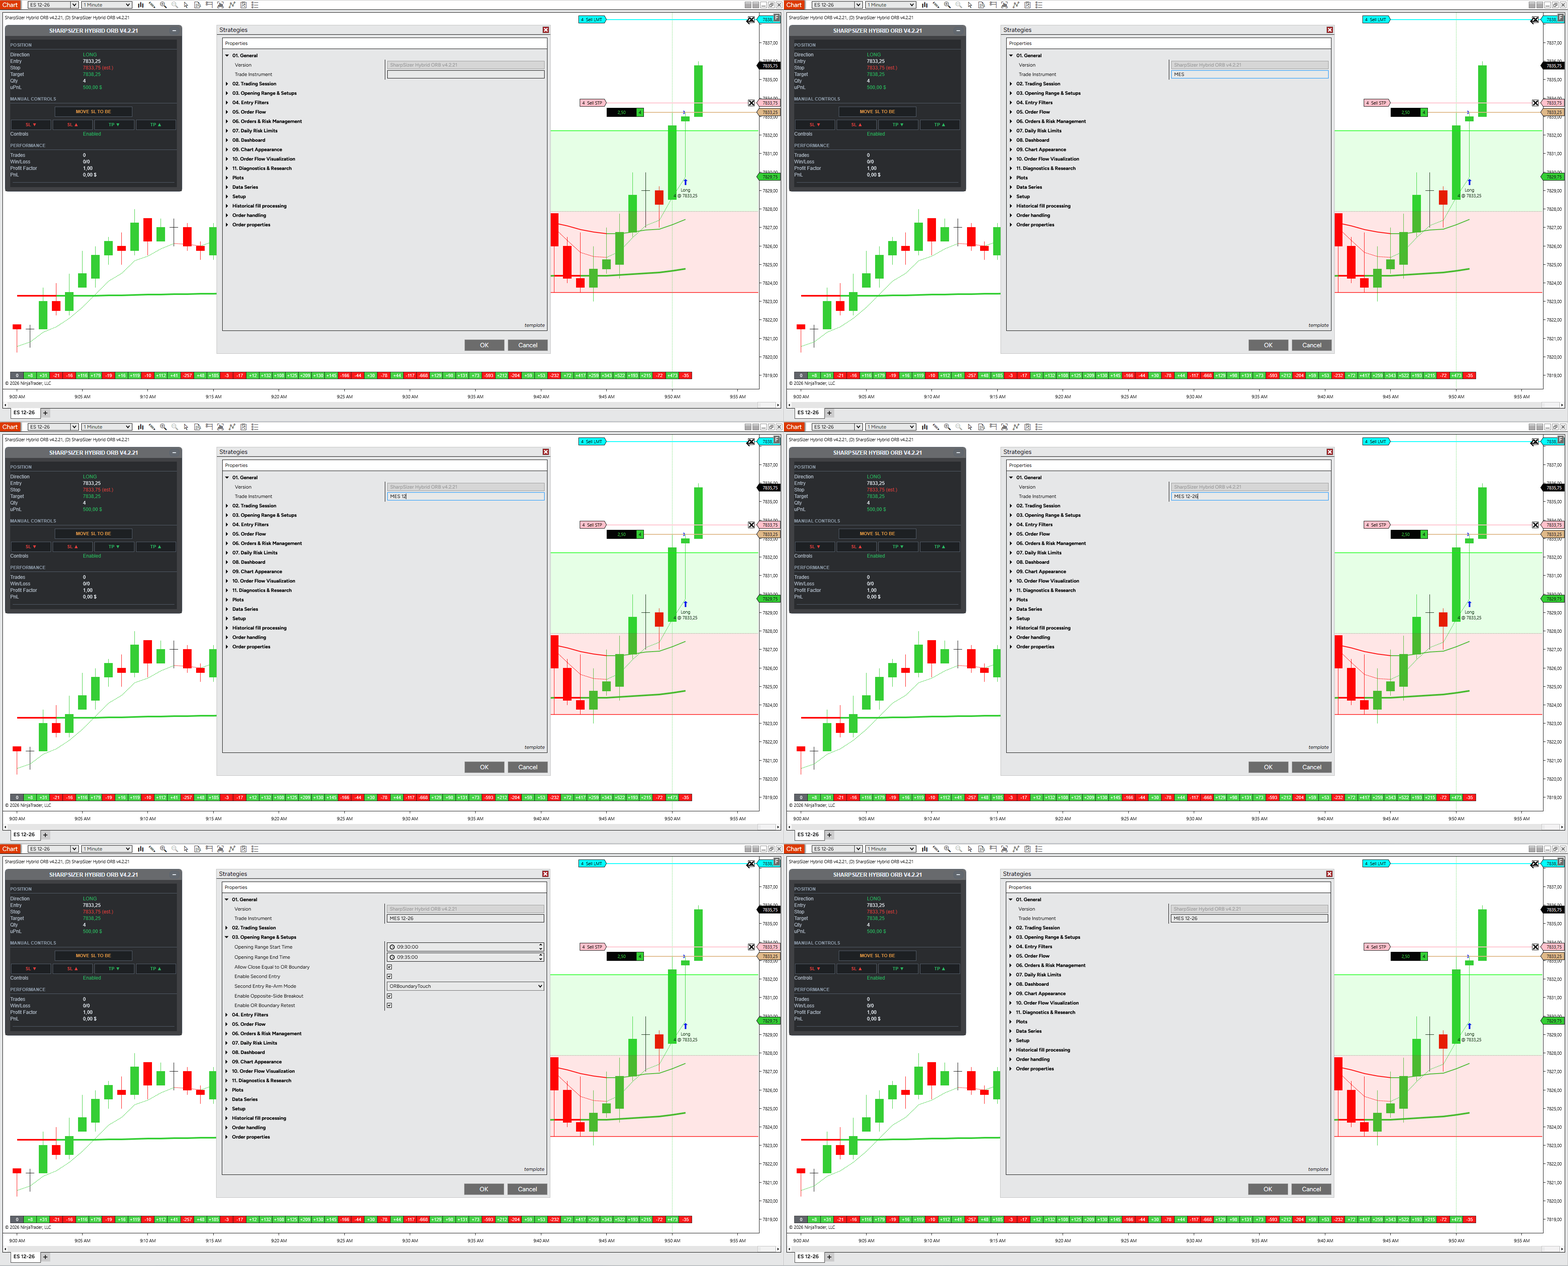 SCREENSHOT 3 - Configuration Overview
Actual NinjaTrader 8 strategy configuration panel showing the organization of SharpSizer Hybrid ORB settings, including Opening Range parameters, entry setups, market filters, execution controls, and risk management. Displayed settings are illustrative and do not represent a recommended or optimized trading configuration.
10. The Importance of Testing Across Markets and Sessions
If Opening Range behavior can be studied across different markets and reference events, an obvious question follows:
Can a methodology developed around one instrument or session be transferred to another?
The answer cannot be assumed.
Different futures contracts have different liquidity characteristics, tick values, volatility patterns, and transaction costs.
Regional sessions also differ in market participation and their relationship to underlying cash markets.
A configuration that performs favorably in one environment may behave very differently elsewhere.
Even within a single instrument, historical performance can change across market regimes.
A disciplined research process should therefore consider:
Whether the chosen reference event has a meaningful relationship to the instrument being studied.
How the Opening Range duration affects the resulting structure.
Whether observed behavior is stable across different historical periods.
How performance changes after realistic transaction costs.
Whether the results survive out-of-sample testing.
Whether the methodology remains practical under live execution conditions.
It is also important to distinguish between research questions and validated findings.
The fact that an instrument or regional opening is worth studying does not imply that it has already been tested or shown to be profitable.
Broadening the research universe creates additional opportunities for investigation.
It also increases the danger of overfitting.
Testing many instruments, sessions, and configurations makes it easier to find attractive historical results by chance.
The more alternatives that are examined, the more carefully the results must be interpreted.
11. The Opening Range Is the Beginning of the Story
The Opening Range is a simple concept.
Select a meaningful market reference event.
Observe price over a defined interval.
Establish the high and low of that interval.
The more interesting questions begin afterward.
Does price leave the range?
Does the breakout continue?
Does price return?
Does the market test the same boundary repeatedly?
Does the initial move fail?
Does price cross the entire range?
Or does the market remain confined within the original structure?
These questions can be asked across different instruments, sessions, and market environments.
They do not require the assumption that every breakout should be traded.
Nor do they require elaborate stories about hidden institutional intentions.
They require observation, measurement, and testing.
Our experience developing SharpSizer ORB has reinforced the value of treating the Opening Range as a reference structure rather than a mechanical prediction.
The objective is not to discover a universal breakout rule.
It is to understand how different market behaviors develop around a clearly defined structure, and whether any of those behaviors can be incorporated into a disciplined, testable trading process.
The Opening Range provides the structure. What happens next provides the information. Whether that information offers a trading advantage remains a question for evidence.
Research Referenced in This Article
Tsai, Y.-C., et al. (2019).
Assessing the Profitability of Timely Opening Range Breakout on Index Futures Markets. IEEE Access, 7, 32061–32071.
https://doi.org/10.1109/ACCESS.2019.2899177
Holmberg, U., Lönnbark, C., & Lundström, C. (2013).
Assessing the Profitability of Intraday Opening Range Breakout Strategies. Finance Research Letters, 10(1), 27–33.
https://doi.org/10.1016/j.frl.2012.09.001
Pineda, M. (2026).
Anatomy of the Retest in the QQQ Opening Range Breakout. SSRN Working Paper.
https://doi.org/10.2139/ssrn.6745958
Fetna, M. (2026).
Opening-Range Breakout Does Not Survive Trading Costs: A Pre-Registered 225-Cell Study on Sixteen Years of Futures Data. SSRN Preprint.
https://doi.org/10.2139/ssrn.7428398
The research cited above is presented for educational purposes. Its findings should not be interpreted as evidence that SharpSizer ORB or any other particular Opening Range strategy will be profitable in future trading.
⚠️ Risk Disclosure
Futures and forex trading involve substantial risk and are not suitable for every investor. An investor could potentially lose all or more than their initial investment. Only risk capital should be used for trading, meaning money that can be lost without jeopardizing one’s financial security or lifestyle. Past performance is not necessarily indicative of future results.
📊 Hypothetical Performance Disclosure
Hypothetical performance results have many inherent limitations. No representation is being made that any account will or is likely to achieve similar profits or losses as those shown. Hypothetical trading does not involve financial risk, and it cannot fully reflect the emotional and psychological factors of real trading.
Additional factors, such as market conditions, liquidity, and execution delays, may adversely affect trading results. It is important to understand that all trading involves risk, and no trading strategy or indicator can guarantee profits.
Trade responsibly!