
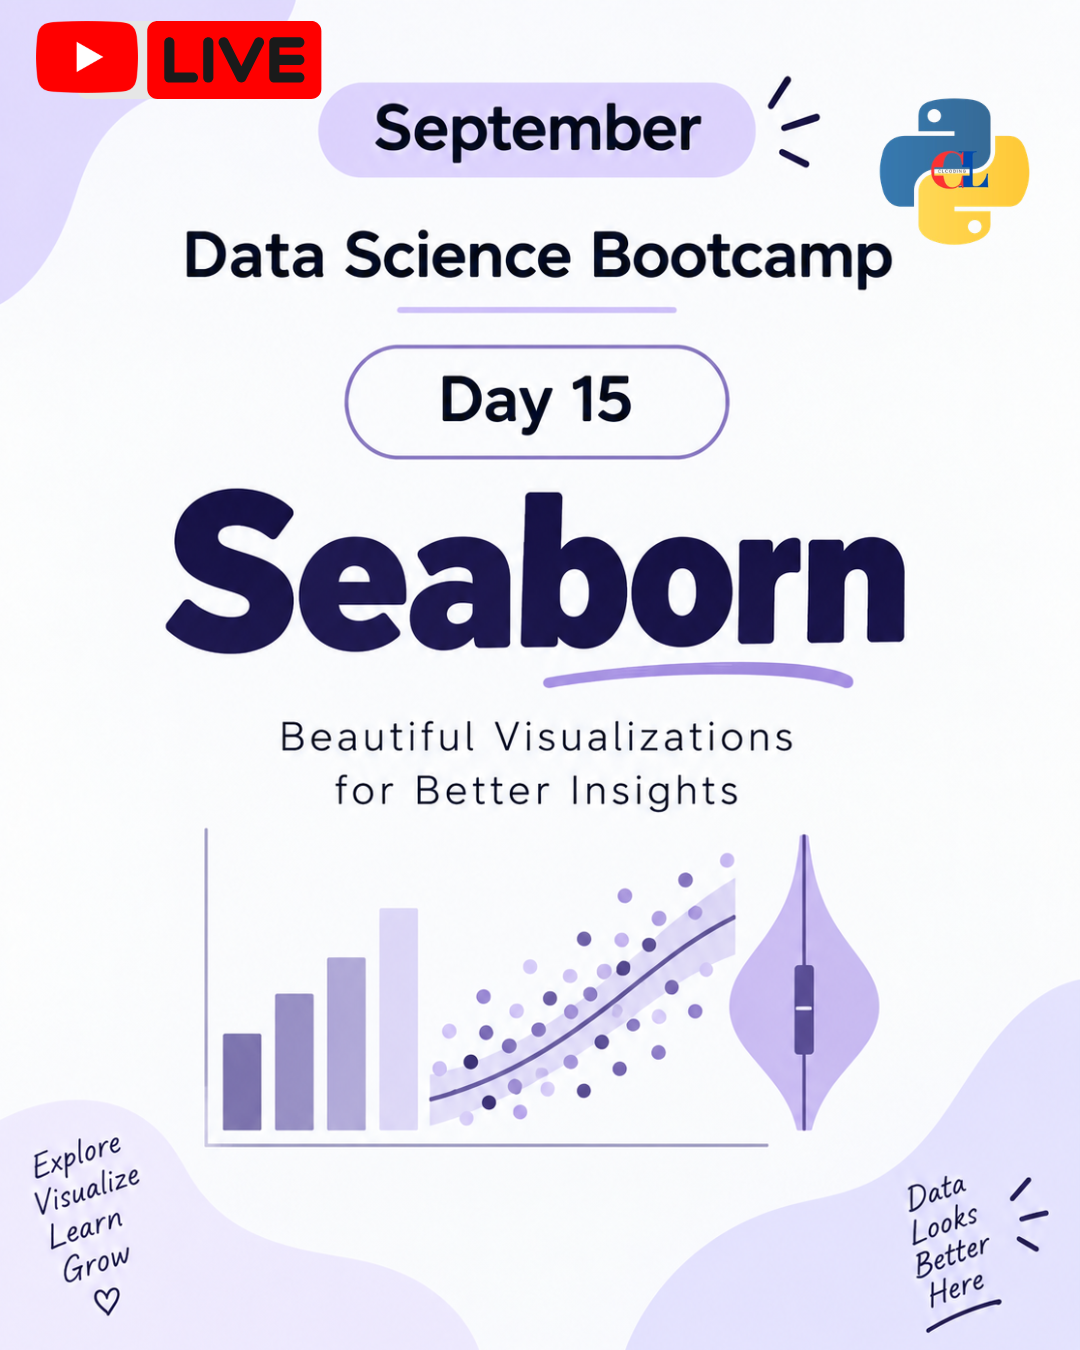
🚀 September Data Science Bootcamp | Day: Seaborn
Ready to turn your data into beautiful visualizations?
In this session, we'll explore Seaborn, a powerful Python library for statistical data visualization.
📌 What you'll learn:
✅ Seaborn Fundamentals
✅ Creating Stunning Statistical Plots
✅ Distribution & Categorical Visualizations
✅ Correlation Heatmaps
✅ Real-World Data Visualization
📊 Learn how to transform complex datasets into meaningful insights using Python!
Join the September Data Science Bootcamp and level up your Data Science skills!
Join Free: https://youtube.com/live/bFLyx4DjmW8
Follow CLCODING for more Python & Data Science content.