
Bitcoin approaching 64k will it breakout?
Opinion
I've been advocating for a 0.25% rate drop leading up to the Federal Reserve meeting on Wednesday. I was shocked when they lowered rates by 0.50%, as I felt this might appear desperate. During the conference call, I noticed a hint of deflationary concerns, which may have triggered this larger rate cut. While I thought a 0.50% drop was appropriate, I expected a more incremental approach.
In hindsight, the 0.50% cut might have been influenced by political factors. What I find most intriguing is the Federal Reserve's lack of acknowledgment that virtually every metric they're basing policy on is inaccurate. They claimed employment had slowed, but based on the 818,000 overstatement over the last year, it has only decreased slightly.
It's concerning that they must address the fact that GDP, unemployment, and other key measurements must be adjusted for the overstatement in employment numbers. None of these numbers can be trusted, especially since they are not acknowledging their errors.
I'm frustrated by the government's apparent willingness to continue presenting misleading data. It's becoming increasingly difficult to trust these numbers. While I don't want to sound like a conspiracy theorist, we face these realities. Aside from a brief mention in the BLS audit, these agencies have not acknowledged their lack of credibility or explained the overstatements.
The job situation might be worse than reported, as they are likely manipulating the data. This could explain the 0.50% rate cut, which is unusual when the stock market trades at all-time highs. Maybe it is possible based on misleading data.
Powell stated the economy is doing fine, but is it really?
The reliability of the data we react to is now in question, and I doubt they'll ever fully admit to these massive errors.
I've long been aware of how statistics can be manipulated, as detailed in the book "How to Lie with Statistics." It discusses sampling sizes and statements from authority figures
like the Federal Reserve and BLS. We expect these organizations to tell the truth, but it's becoming evident that may only sometimes be the case.
Given this uncertainty, I increasingly rely on weekly numbers like initial and continuing unemployment claims. While not guaranteed accuracy, their short-term nature and frequent adjustments should make them potentially more reliable.
Powell mentioned bringing millions of people into the labor force, which he claims is increasing unemployment. However, I've argued in the past that it's had the opposite effect. Many of these newcomers are receiving government assistance, which is draining the system.
As a quant, I've always focused on pure numbers and market psychology. Given the unreliability of fundamental data, this approach has become even more crucial. While we still need to respond to the official numbers, I'm becoming more cautious about which metrics are critical.
I'll continue to share these thoughts in my newsletter, and I appreciate my subscriber’s willingness to consider these perspectives. For those who prefer to focus solely on technical analysis, feel free to skip to that section.
Looking back on Wednesday’s Action
Today's session started sluggish as markets awaited the Federal Reserve's decision. The Federal Open Market Committee (FOMC) voted to cut the target range for the fed funds rate by 50 basis points to 4.75-5.00%. The decision wasn't unanimous, with Fed Governor Bowman preferring a 25-basis point cut.
The Fed indicated greater confidence that inflation is moving sustainably toward 2 percent, with risks to employment and inflation goals now considered roughly balanced. Economic projections showed shifts, including a higher 2024 unemployment rate estimate of 4.4% and lower inflation forecasts. The dot plot suggests another 50 basis points of rate cuts this year and 100 basis points in 2025.
Fed Chair Powell characterized the larger cut as a "recalibration" to maintain a solid labor market and economy. He stated the Fed doesn't feel behind the curve and views this move as demonstrating their commitment to staying ahead.
Market reaction was volatile. Stocks initially surged to new record highs for the S&P 500 and Dow Jones Industrial Average but ultimately closed lower. Most S&P 500 sectors ended down, with only energy and communication services posting slight gains.
The Treasury market saw an interesting development. Despite the rate cut and indications of future cuts, Treasury yields moved higher after an initial drop. This could signal inflation concerns, with the market potentially pricing in a curve-steepening trade. The 2-year note yield closed at 3.60% (up one basis point), while the 10-year yield settled at 3.69% (up four basis points).
This complex market response highlights the delicate balance the Fed is trying to strike and the ongoing uncertainty surrounding the economic outlook. The interplay between monetary policy decisions and market reactions continues to shape the financial landscape.
S&P 500: +17.8% YTD
Nasdaq Composite: +17.1% YTD
S&P Midcap 400: +10.4% YTD
Dow Jones Industrial Average: +10.1% YTD
Russell 2000: +8.8% YTD
Wednesday’s economic data releases
The weekly MBA Mortgage Applications Index increased significantly by 14.2%, driven by a surge in both refinance and purchase applications. Refinance applications soared by 24%, while purchase applications rose by 5%, indicating renewed interest in the housing market.
Housing starts exceeded expectations, increasing 9.6% month-over-month to a seasonally adjusted annual rate of 1.356 million units, surpassing the KR Forecast consensus of 1.320 million. This growth was primarily fueled by a robust 15.8% increase in single-unit starts. Building permits also showed strength, rising 4.9% month-over-month to a seasonally adjusted annual rate of 1.475 million, above the KR Forecast consensus of 1.415 million. Single-unit permits contributed to this increase with a 2.8% rise.
The key takeaway from the housing report is the widespread growth in single-unit starts and permits across all regions. This uptick in builder activity can be attributed to declining interest rates and pent-up demand in the housing market.
In the energy sector, the weekly EIA Crude Oil Inventories report revealed a draw of 1.63 million barrels, contrasting with last week's build of 833,000 barrels. This reduction in inventories may have implications for oil prices in the near term.
Looking ahead to Thursday
Market participants will be presented with a series of critical economic indicators. The day will begin with the release of weekly initial and continuing jobless claims, which will provide insight into the current state of the labor market. The Q2 Current Account and September Philadelphia Fed Index will also be announced, with the latter expected to show improvement from the previous month's negative reading.
Later in the morning, August Existing Home Sales data will be released. The KR Forecast consensus projects a slight decline to 3.90 million from the previous month's 3.95 million. The August Leading Indicators report is also scheduled. Expectations are for a 0.3% decrease, showing some improvement from the prior month's 0.6% decline.
The weekly natural gas inventories report will round out Thursday's economic calendar and provide further insight into the energy market dynamics.
S&P 500 Futures
As I sit here writing this commentary, it's about an hour and 20 minutes after the London opening. We've witnessed a typical pattern initially, where the London market made a new high for the session before selling off. However, what followed was nothing short of a stampede, with market participants seemingly aiming for yesterday's post-Fed announcement high in the futures, which was at the 5755.75 level. We've come tantalizingly close to a new high, trading up to 5755.25.
In yesterday's live stream, I discussed the outside bar that had formed, setting up at a key high. The action we've seen validates all of that. Typically, if we're going to get a classic reversal pattern setup, we don't trade above R1 or R2. But today, we've traded all the way up to RXT at 5747, actually exceeding the projected range for the day.
We've seen quite a bit of buying coming in. It's about 3:30 AM New York time as I write this, and we're starting to see some East Coast traders wake up, possibly selling into some of this overnight strength. We've already seen an entire day's range, and right now we have an inside bar occurring, which is typically bullish if we don't do anything else but close within the range.
We'll maintain a bullish sentiment as long as we trade in the upper 50% of the daily range. We're in the upper half of our range so far (5691-5754). We'll need to close above the midpoint of that range to keep the bullish sentiment intact. If we trade below that, we could retest the lows.
The algorithms suggest more strength heading into Friday. We'll get some employment reports tomorrow, but the biggest issue is the impact of the Fed's 50 basis point pivot on the markets.
I've been discussing new Fibonacci targets issued about six days ago. These suggest a minimum move to 5943, with a reasonable target range between 6153-6176. It's fascinating how this market appears somewhat unstoppable. If we look back to the August sell-off and the big reversal that followed, we had an eight-day rally. Now we've witnessed another eight sessions higher, and we're still pushing to move the markets even higher from here.
The database and all other indicators are very robust, and it doesn't look like anything will stop this market. We could quickly end up printing up toward that 5943 number before we finally catch our breath and start to see some consolidation.
I'll address some issues surrounding the Fed's action in the coming days. As I mentioned earlier, their decision feels a bit politically motivated, which doesn't necessarily mean it is. I was shocked at the 0.50 decrease in the front end of the yields, even though it was justified based on what happened in the back end. I'll discuss this further in Monday's report.
Looking at the overnight action, we've already experienced the projected range. We could extend a bit more, but I would expect to see some retracement as we come into the US open. This market continues to surprise and challenge our expectations, making it an exciting time for market watchers and participants.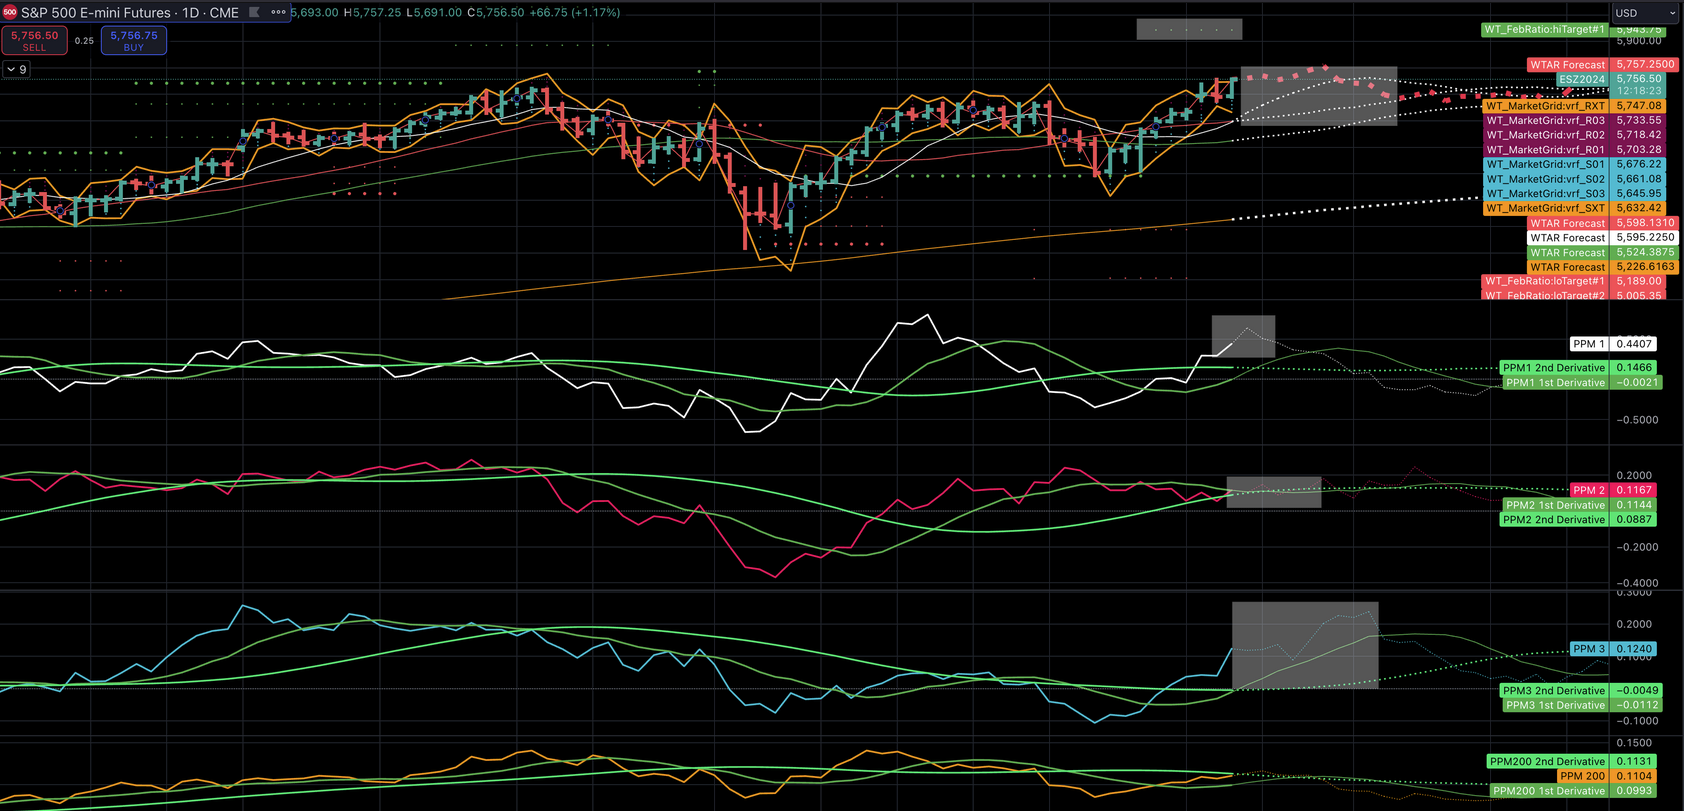
NASDAQ Futures
As I analyze the NASDAQ's performance, I'm witnessing a sharp rally, with the index up 302 points, representing a 1.54% increase. Notably, we've just penetrated Wednesday's high, and the momentum appears to be expanding over the next two days. Looking at the price pressure momentum indicators two and three, we're seeing signs that this upward bias could continue into the end of September.
Like the S&P, the NASDAQ has already traded at the RXT number, which is 19,921. In fact, we've seen a high of 19,944. Typically, I would expect to see a retracement back into the range. However, it's crucial to note that market participants and the algorithms driving the markets seem to operate with little to no fear. This fearless sentiment opens up the possibility for them to continue bidding this market much higher.
I've raised the question several times over the past couple of weeks: Will rate decreases be bullish? At this moment, the answer is yes. After the Fed's announcement and Powell's conference yesterday, there seemed to be some apprehension about the numbers. However, as we've moved into the overnight session, especially around the London open, we're witnessing what I can only describe as crazy enthusiasm. The markets are being bid up to astronomical levels.
Regarding the daily market grid ranges, we've already exceeded these. We last encountered this during the big reversal we saw seven days ago. Prior to that, we have to look back to a couple of events in August where the markets were able to extend above the RTX levels. It's important to understand that these are typically extreme levels, at least daily.
Given this context, I would normally expect to see a pullback into the range. However, as I mentioned earlier, there's an unusual fearlessness in the market right now. Looking above these levels, we don't have many established reference points. The red dot closing predictor, however, is still suggesting multiple days of higher closes. Interestingly, these closes could hover around the 20,000 level as we move forward.
This market behavior is truly remarkable. We're seeing levels of enthusiasm and momentum that are quite rare. While part of me expects a retracement due to how extended we are, the strength of this rally and the seeming lack of fear among market participants make me hesitant to bet against this upward movement.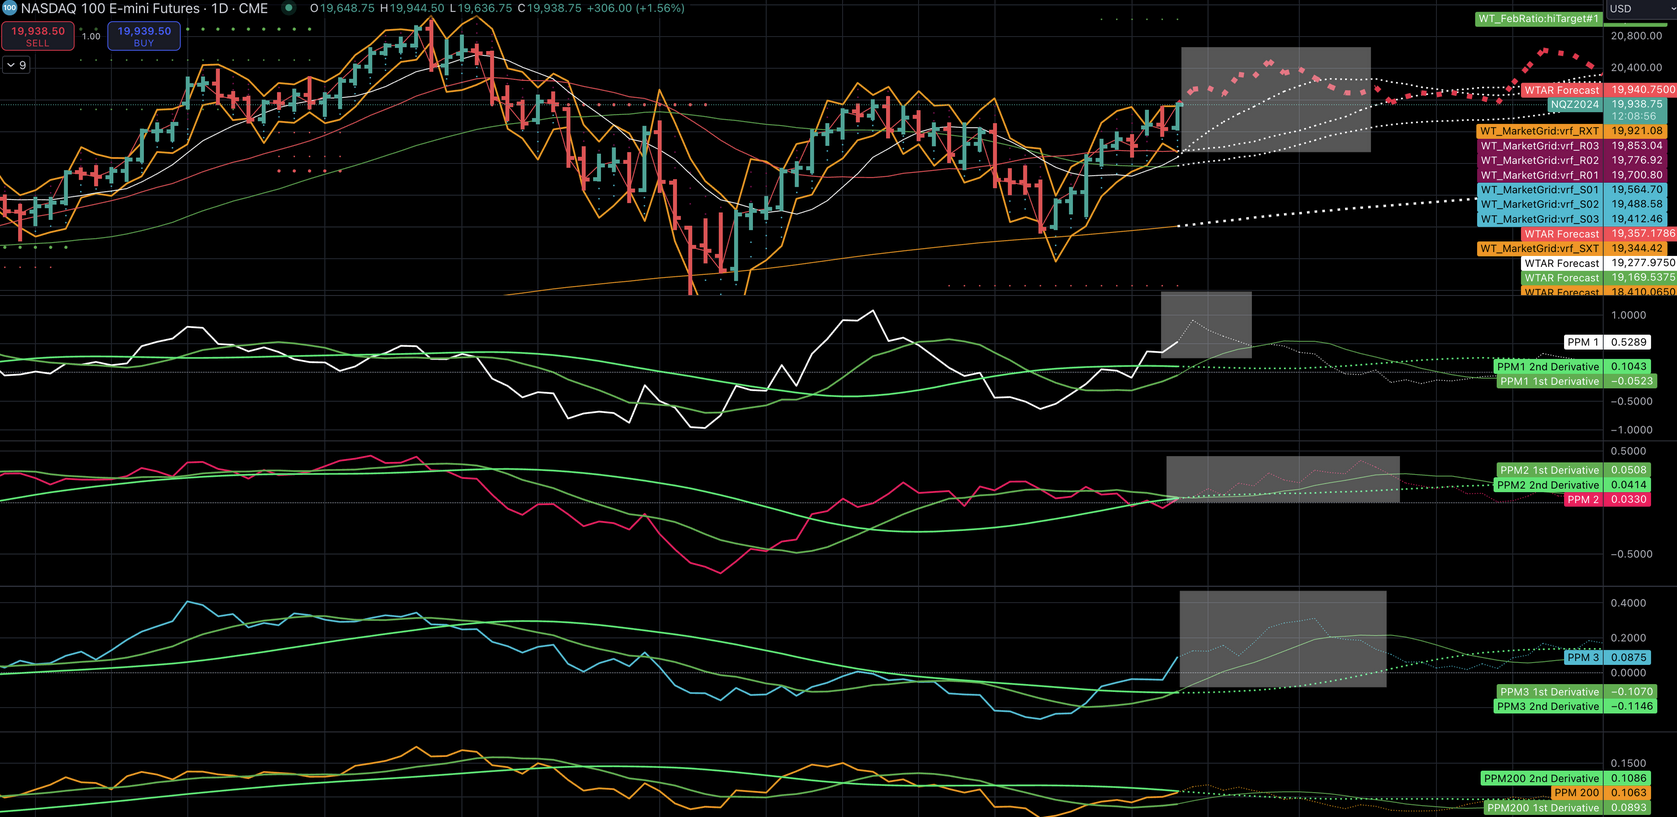
Bitcoin
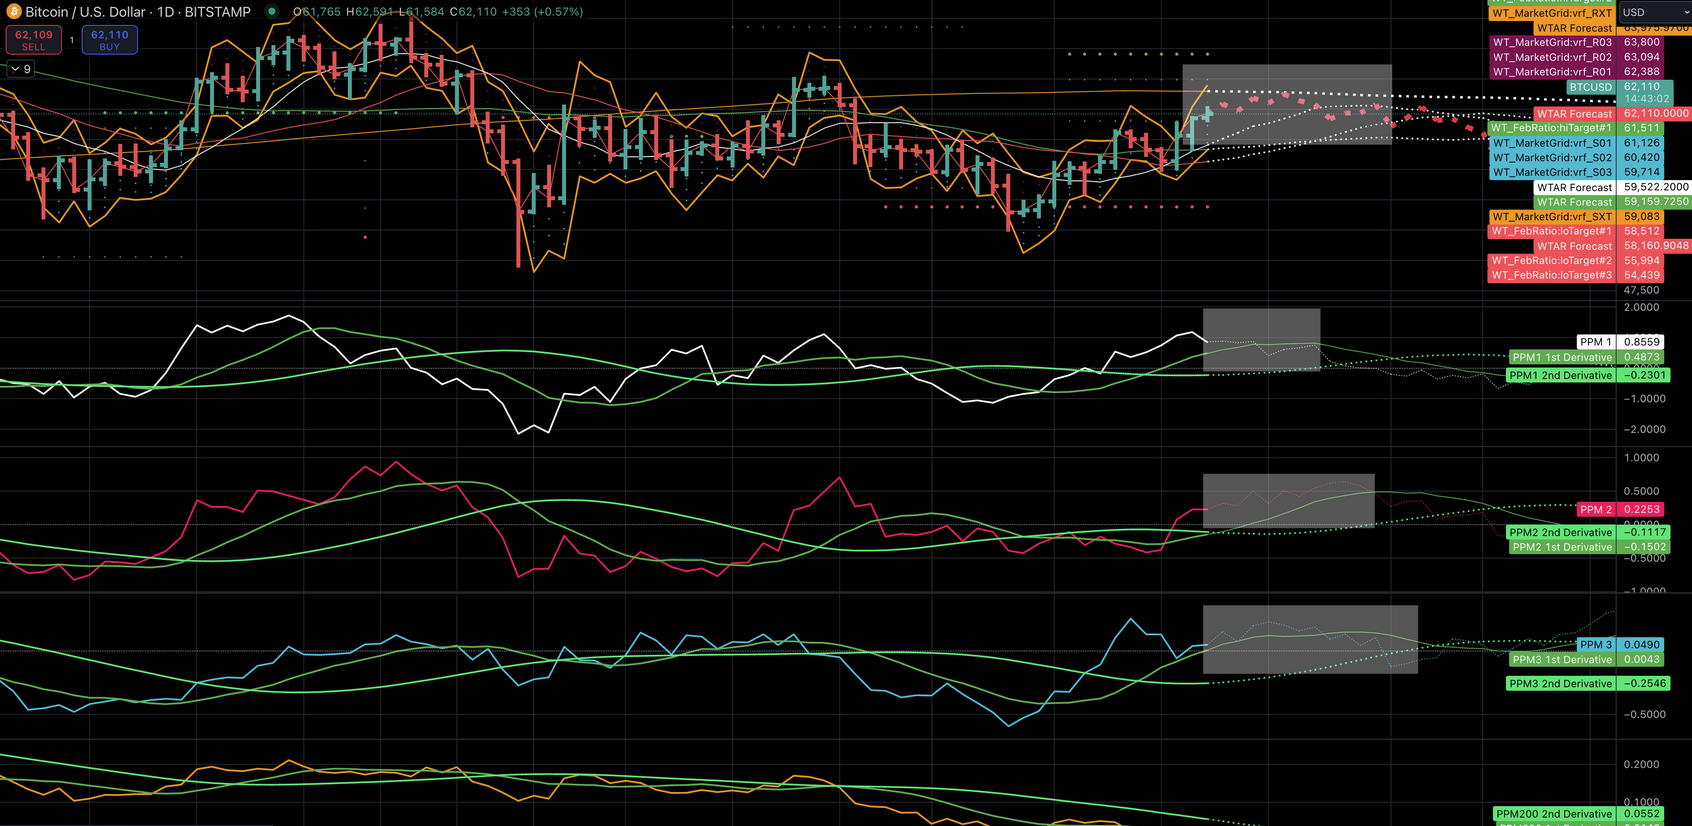
As I continue monitoring Bitcoin, I observe a persistently strong profile with significant overnight movement. We've recently touched 62,591, which aligns with my previous discussions about the potential for Bitcoin to reach the 64,000 level. This target is just shy of the Fibonacci 2 objective, currently at 64,936.
Based on these levels and current market dynamics, I anticipate we'll see a top in this market over the next couple of days. However, it's worth noting that the extreme Fibonacci projection sits at 67,051, suggesting some potential upside remains.
The algorithms provide additional insight, indicating that we're currently in an upward trend. This translates to a 60% probability of Bitcoin remaining above its 10-day moving average, currently at 59,502. This probability underscores the strength of the current upward movement but also reminds us that there's still a 40% chance of a pullback below this level.
For today's trading session, I'm closely watching the following support and resistance levels:
Support levels:
1. 61,126
2. 60,420
These levels could provide a floor if we see any retracement in the short term.
Resistance levels:
1. 63,094
2. 64,431 (extreme)
The extreme resistance at 64,431 is particularly noteworthy as it corresponds with the 200-day moving average. This confluence of technical factors makes this level a significant point to watch. If Bitcoin can break through this level, it could signal even stronger bullish sentiment and potentially open the door to testing the extreme Fibonacci projection at 67,051.
As we move forward, I'll pay close attention to how Bitcoin behaves around these critical levels, particularly the 64,000 area and the 200-day moving average.
The strength in Bitcoin reflects the broader risk-on sentiment we're observing across various markets. It will be interesting to see if the strength continues to correlate with the equity market rallies we've been witnessing.