

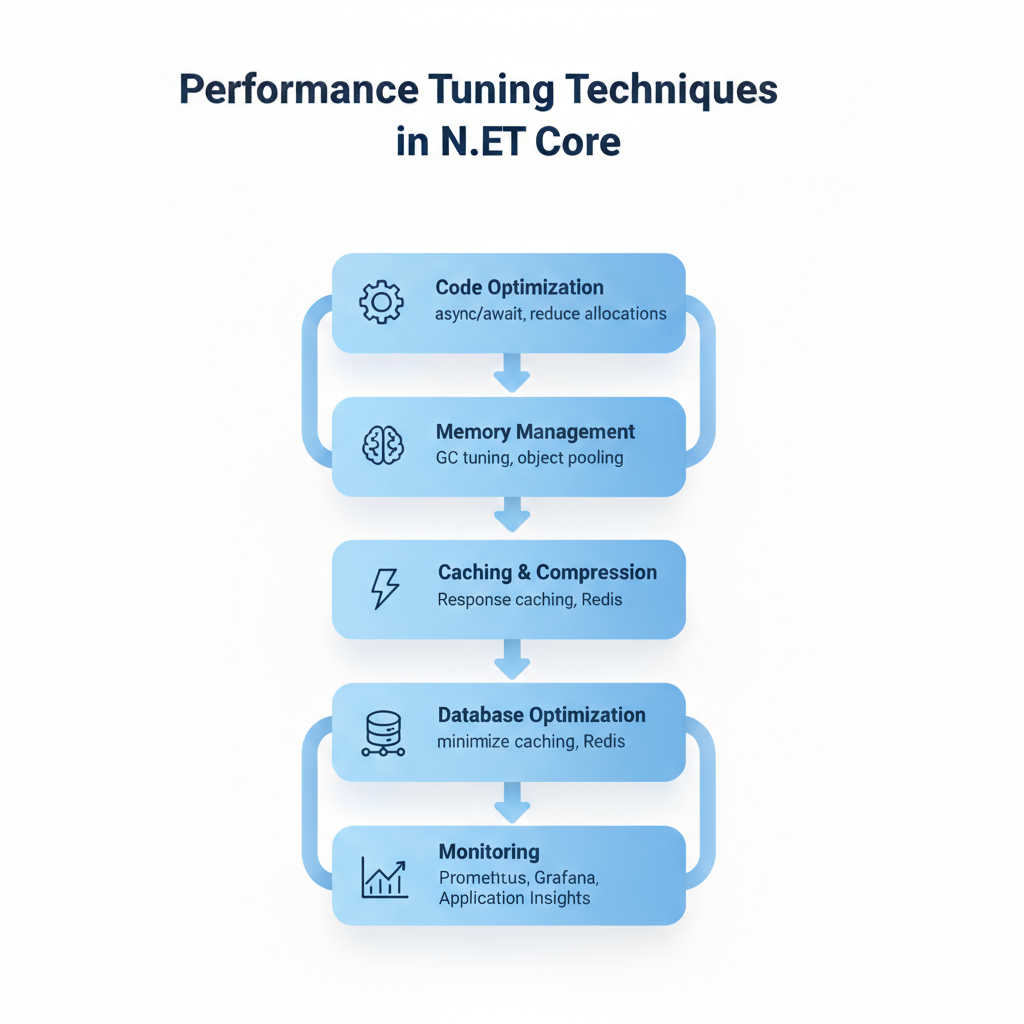
 Modern enterprise applications demand speed, scalability, and reliability. Whether you're building APIs, microservices, or full-stack applications with ASP.NET Core, performance tuning is no longer an afterthought — it’s a necessity.
This post dives deep into the Performance Tuning Techniques in .NET Core, based on the visual flowchart shared above. We’ll walk through each stage — from Code Optimization to Monitoring — exploring not only what to do but why and how to do it effectively.
Let’s begin.
🔧 1. Code Optimization
Performance tuning starts at the code level. No matter how optimized your infrastructure is, poorly written code will always create bottlenecks.
Here are key strategies for code optimization in .NET Core:
a. Use async/await Efficiently
The asynchronous model in .NET Core allows applications to handle more concurrent requests with fewer threads, freeing the CPU to perform other work while waiting for I/O operations.
Example:
public async Task<IActionResult> GetDataAsync()
{
    var result = await _repository.FetchDataAsync();
    return Ok(result);
}
When to use:
Database calls
File I/O
Network requests (HTTP, gRPC, etc.)
Avoid blocking calls like .Result or .Wait() inside async methods — they can cause deadlocks and thread starvation.
b. Reduce Object Allocations
Frequent object creation increases Garbage Collection (GC) pressure. Instead, reuse objects wherever possible.
Use:
ArrayPoolfor temporary arraysStringBuilderinstead of string concatenation in loopsStructs for small immutable data
Example:
var sb = new StringBuilder();
for (int i = 0; i < 1000; i++)
{
    sb.Append(i);
}
c. Minimize LINQ Overhead
LINQ is elegant but can create unnecessary allocations. Replace heavy LINQ queries with efficient loops in performance-critical paths.
Example:
Instead of:
var result = data.Where(x => x.IsActive).Select(x => x.Name).ToList();
Use:
var result = new List<string>();
foreach (var item in data)
{
    if (item.IsActive)
        result.Add(item.Name);
}
d. Use Efficient Data Structures
Choose the right collection:
Dictionaryfor fast lookupsSpanandMemoryfor memory-efficient operationsConcurrentDictionaryfor thread-safe scenarios
e. Avoid Unnecessary Boxing/Unboxing
Boxing occurs when value types are converted to reference types, creating hidden memory allocations. Use generics to avoid boxing.
🧠 2. Memory Management
Memory leaks and inefficient memory usage are silent performance killers. .NET Core provides an advanced Garbage Collector (GC), but developers must help it by writing memory-conscious code.
a. Understand Garbage Collection (GC) Tuning
.NET Core supports Server GC and Workstation GC.
Server GC: Optimized for backend services and web apps — uses multiple threads for parallel GC.
Workstation GC: Suitable for desktop apps where responsiveness matters more than throughput.
You can configure it in runtimeconfig.json or via environment variables:
{
  "runtimeOptions": {
    "configProperties": {
      "System.GC.Server": true
    }
  }
}
b. Object Pooling
Instead of creating new objects repeatedly, use object pools to reuse them.
Example using ObjectPool:
var pool = new DefaultObjectPool<StringBuilder>(new StringBuilderPooledObjectPolicy());
var sb = pool.Get();
try
{
    sb.Append("Hello World");
    Console.WriteLine(sb.ToString());
}
finally
{
    pool.Return(sb);
}
c. Use Span and Memory
These types allow high-performance memory operations without additional allocations.
Example:
Span<int> numbers = stackalloc int[5] { 1, 2, 3, 4, 5 };
d. Dispose Objects Properly
Implement IDisposable and use using blocks for objects like streams, DB connections, and HttpClient (prefer HttpClientFactory for reuse).
⚡ 3. Caching & Compression
Caching is one of the easiest and most impactful ways to enhance performance in .NET Core applications. It reduces redundant computations and database calls.
a. Response Caching
Enable response caching in middleware:
app.UseResponseCaching();
And in controllers:
[ResponseCache(Duration = 60)]
public IActionResult Get()
{
    return Ok(DateTime.Now);
}
This stores and serves cached responses for repeated requests, drastically improving speed.
b. In-Memory Caching
Ideal for single-instance applications or small datasets.
Example:
services.AddMemoryCache();
Usage:
if (!_cache.TryGetValue("dataKey", out var data))
{
    data = GetDataFromDb();
    _cache.Set("dataKey", data, TimeSpan.FromMinutes(5));
}
c. Distributed Caching with Redis
For microservices and cloud apps, Redis provides fast, distributed caching.
Setup:
services.AddStackExchangeRedisCache(options =>
{
    options.Configuration = "localhost:6379";
});
Usage:
await _cache.SetStringAsync("key", "value");
var value = await _cache.GetStringAsync("key");
d. Compression
Compress static and dynamic responses using Gzip or Brotli:
services.AddResponseCompression(options =>
{
    options.Providers.Add<GzipCompressionProvider>();
});
This reduces payload size and speeds up API responses.
🗃️ 4. Database Optimization
Databases are often the biggest performance bottleneck in backend systems. Efficient database access can dramatically improve end-to-end latency.
a. Optimize Queries
Use parameterized queries and retrieve only necessary columns.
Example:
var user = await _context.Users
    .Where(u => u.Id == id)
    .Select(u => new { u.Name, u.Email })
    .FirstOrDefaultAsync();
Avoid SELECT * — it consumes more bandwidth and memory.
b. Use Connection Pooling
.NET Core automatically manages connection pools, but ensure proper connection disposal using using blocks.
c. Minimize Database Calls
Batch multiple operations into one query when possible. Use transactions for related operations.
d. Use Caching Wisely
Caching database results in Redis or MemoryCache can dramatically reduce DB load. However, ensure cache invalidation strategies are in place to avoid stale data.
e. Use Asynchronous Database Calls
Always use async EF Core methods like:
await context.Users.ToListAsync();
f. Indexing and Query Plans
Use SQL Server Profiler or Azure Data Studio to monitor query performance. Create indexes on columns frequently used in filters and joins.
g. Use Read Replicas and Sharding
In large-scale systems:
Use read replicas for read-heavy workloads
Partition (shard) data for horizontal scalability
📈 5. Monitoring
You can’t improve what you don’t measure. Monitoring is the foundation for continuous performance tuning.
a. Application Insights (Azure)
Integrates seamlessly with .NET Core:
services.AddApplicationInsightsTelemetry();
It tracks:
Request latency
Exception rates
Dependency calls (SQL, Redis, etc.)
b. Prometheus + Grafana
For containerized or Kubernetes-based deployments:
Prometheus scrapes performance metrics.
Grafana visualizes them with interactive dashboards.
Add a Prometheus endpoint:
app.UseEndpoints(endpoints =>
{
    endpoints.MapMetrics(); // Prometheus metrics endpoint
});
c. Health Checks
.NET Core provides built-in health checks:
services.AddHealthChecks()
        .AddSqlServer(connectionString)
        .AddRedis("localhost");
Add route:
app.UseEndpoints(endpoints =>
{
    endpoints.MapHealthChecks("/health");
});
d. Logging
Use structured logging with Serilog or NLog:
Log.Information("Processing request {RequestId}", requestId);
Store logs in ElasticSearch, visualize with Kibana, or monitor with Grafana Loki.
e. Profiling Tools
dotTrace and PerfView for CPU profiling
dotMemory for memory leaks
BenchmarkDotNet for micro-benchmarks
🧩 6. Bringing It All Together
Each stage of performance tuning is connected:
Code optimization reduces CPU load
Memory management reduces GC pauses
Caching minimizes database hits
Database tuning improves I/O throughput
Monitoring ensures continuous visibility
Here’s how it flows (as in the image):
Code Optimization → Memory Management → Caching & Compression → Database Optimization → Monitoring
It’s a continuous loop. Once you monitor and identify new bottlenecks, you return to the first step and refine further. Performance tuning is not a one-time activity — it’s a cycle of measure → analyze → optimize → repeat.
💡 Real-World Example: End-to-End Optimization Flow
Imagine an ASP.NET Core API that loads customer data from a SQL database.
Before Optimization:
Each request executes multiple DB queries
No caching
Blocking calls (
.Result)No response compression
Limited monitoring
After Optimization:
Queries combined and optimized with indexes
Redis caching for frequently accessed data
Asynchronous calls (
await)Gzip compression enabled
Application Insights dashboards for latency and exceptions
The result? 🚀
Response time reduced from 2.5 seconds to 300 ms and DB load dropped by 70%.
🔍 Best Practices Checklist
✅ Use async/await for I/O operations
✅ Reuse objects and apply pooling
✅ Apply response and distributed caching
✅ Optimize EF Core queries and indexes
✅ Use Application Insights or Prometheus for metrics
✅ Continuously profile, monitor, and refactor
🧭 Conclusion
Performance tuning in .NET Core is not about one magic setting — it’s about holistic engineering discipline. From clean asynchronous code to robust caching, efficient memory management, and real-time monitoring, each layer plays a crucial role.
When done right, these optimizations lead to:
Faster response times
Lower infrastructure costs
Better scalability
Improved user experience
By applying the techniques shared above, you can make your .NET Core applications not only perform better but also run smarter.