

Article free for everyone: enjoy! (same for the analyses repository, which you will find at the end of the article)
Hello, dear supporters,
F1 is finally back! The never-short-enough winter break has finally ended, giving us some intense 3 days of testing. The 2024 season has been epic, with two separate fights for the WDC and WCC, and who would have guessed that McL and Ferrari would have fought for the constructors' championship? VER got the title thanks to his and Redbull's excellent season start and managed his advantage well in the second half. Many questions about the upcoming season: Can VER fight again? Will McLaren be the top-tier car, and can Ferrari further improve their 2024 challenger? Will Mercedes finally grasp the ground-effect regulations and produce a competitive car? What are Williams, Aston, Alpine, Haas, RacingBulls and Sauber up to?
We have to wait for Australia (and likely a couple more races) to have a clear picture, meanwhile, we can analyse the pre-season test data in search of answers. You will also find my prediction at the end of the article: let's go!
Final Results
Day 3
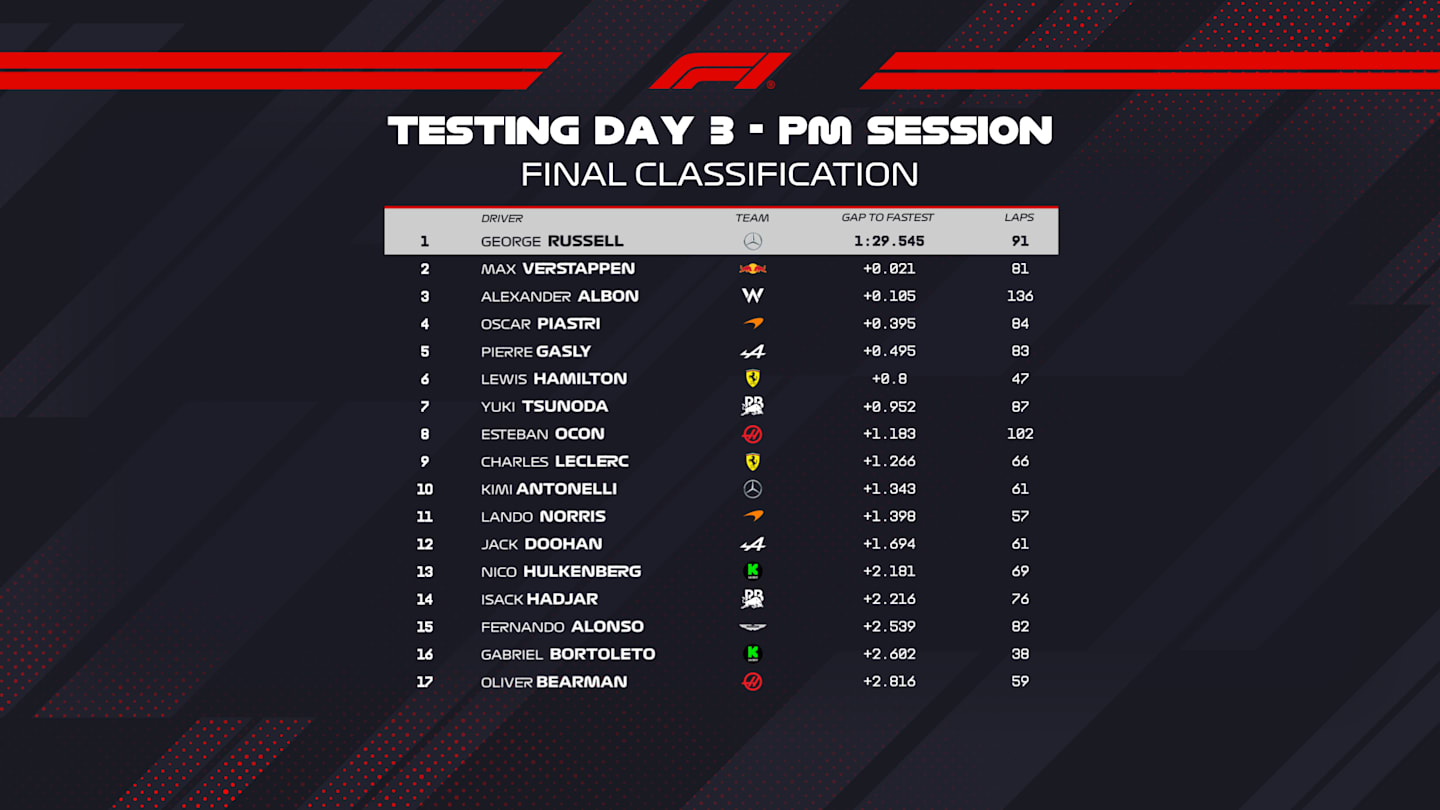
RUS topped the time sheets in the last day of testing, preceding VER by a tiny 0.021s gap and ALB (+0.105s). Not only was Albon quick, but he also completed more laps than any other driver by far (136). OCO was the only other driver to cover over 100 laps. BOR did the fewest laps (38)
Day 2
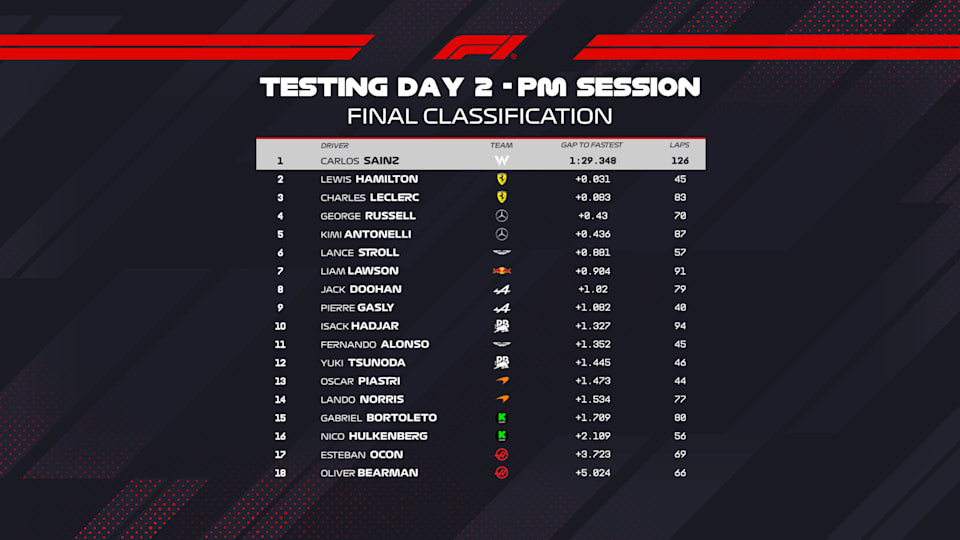
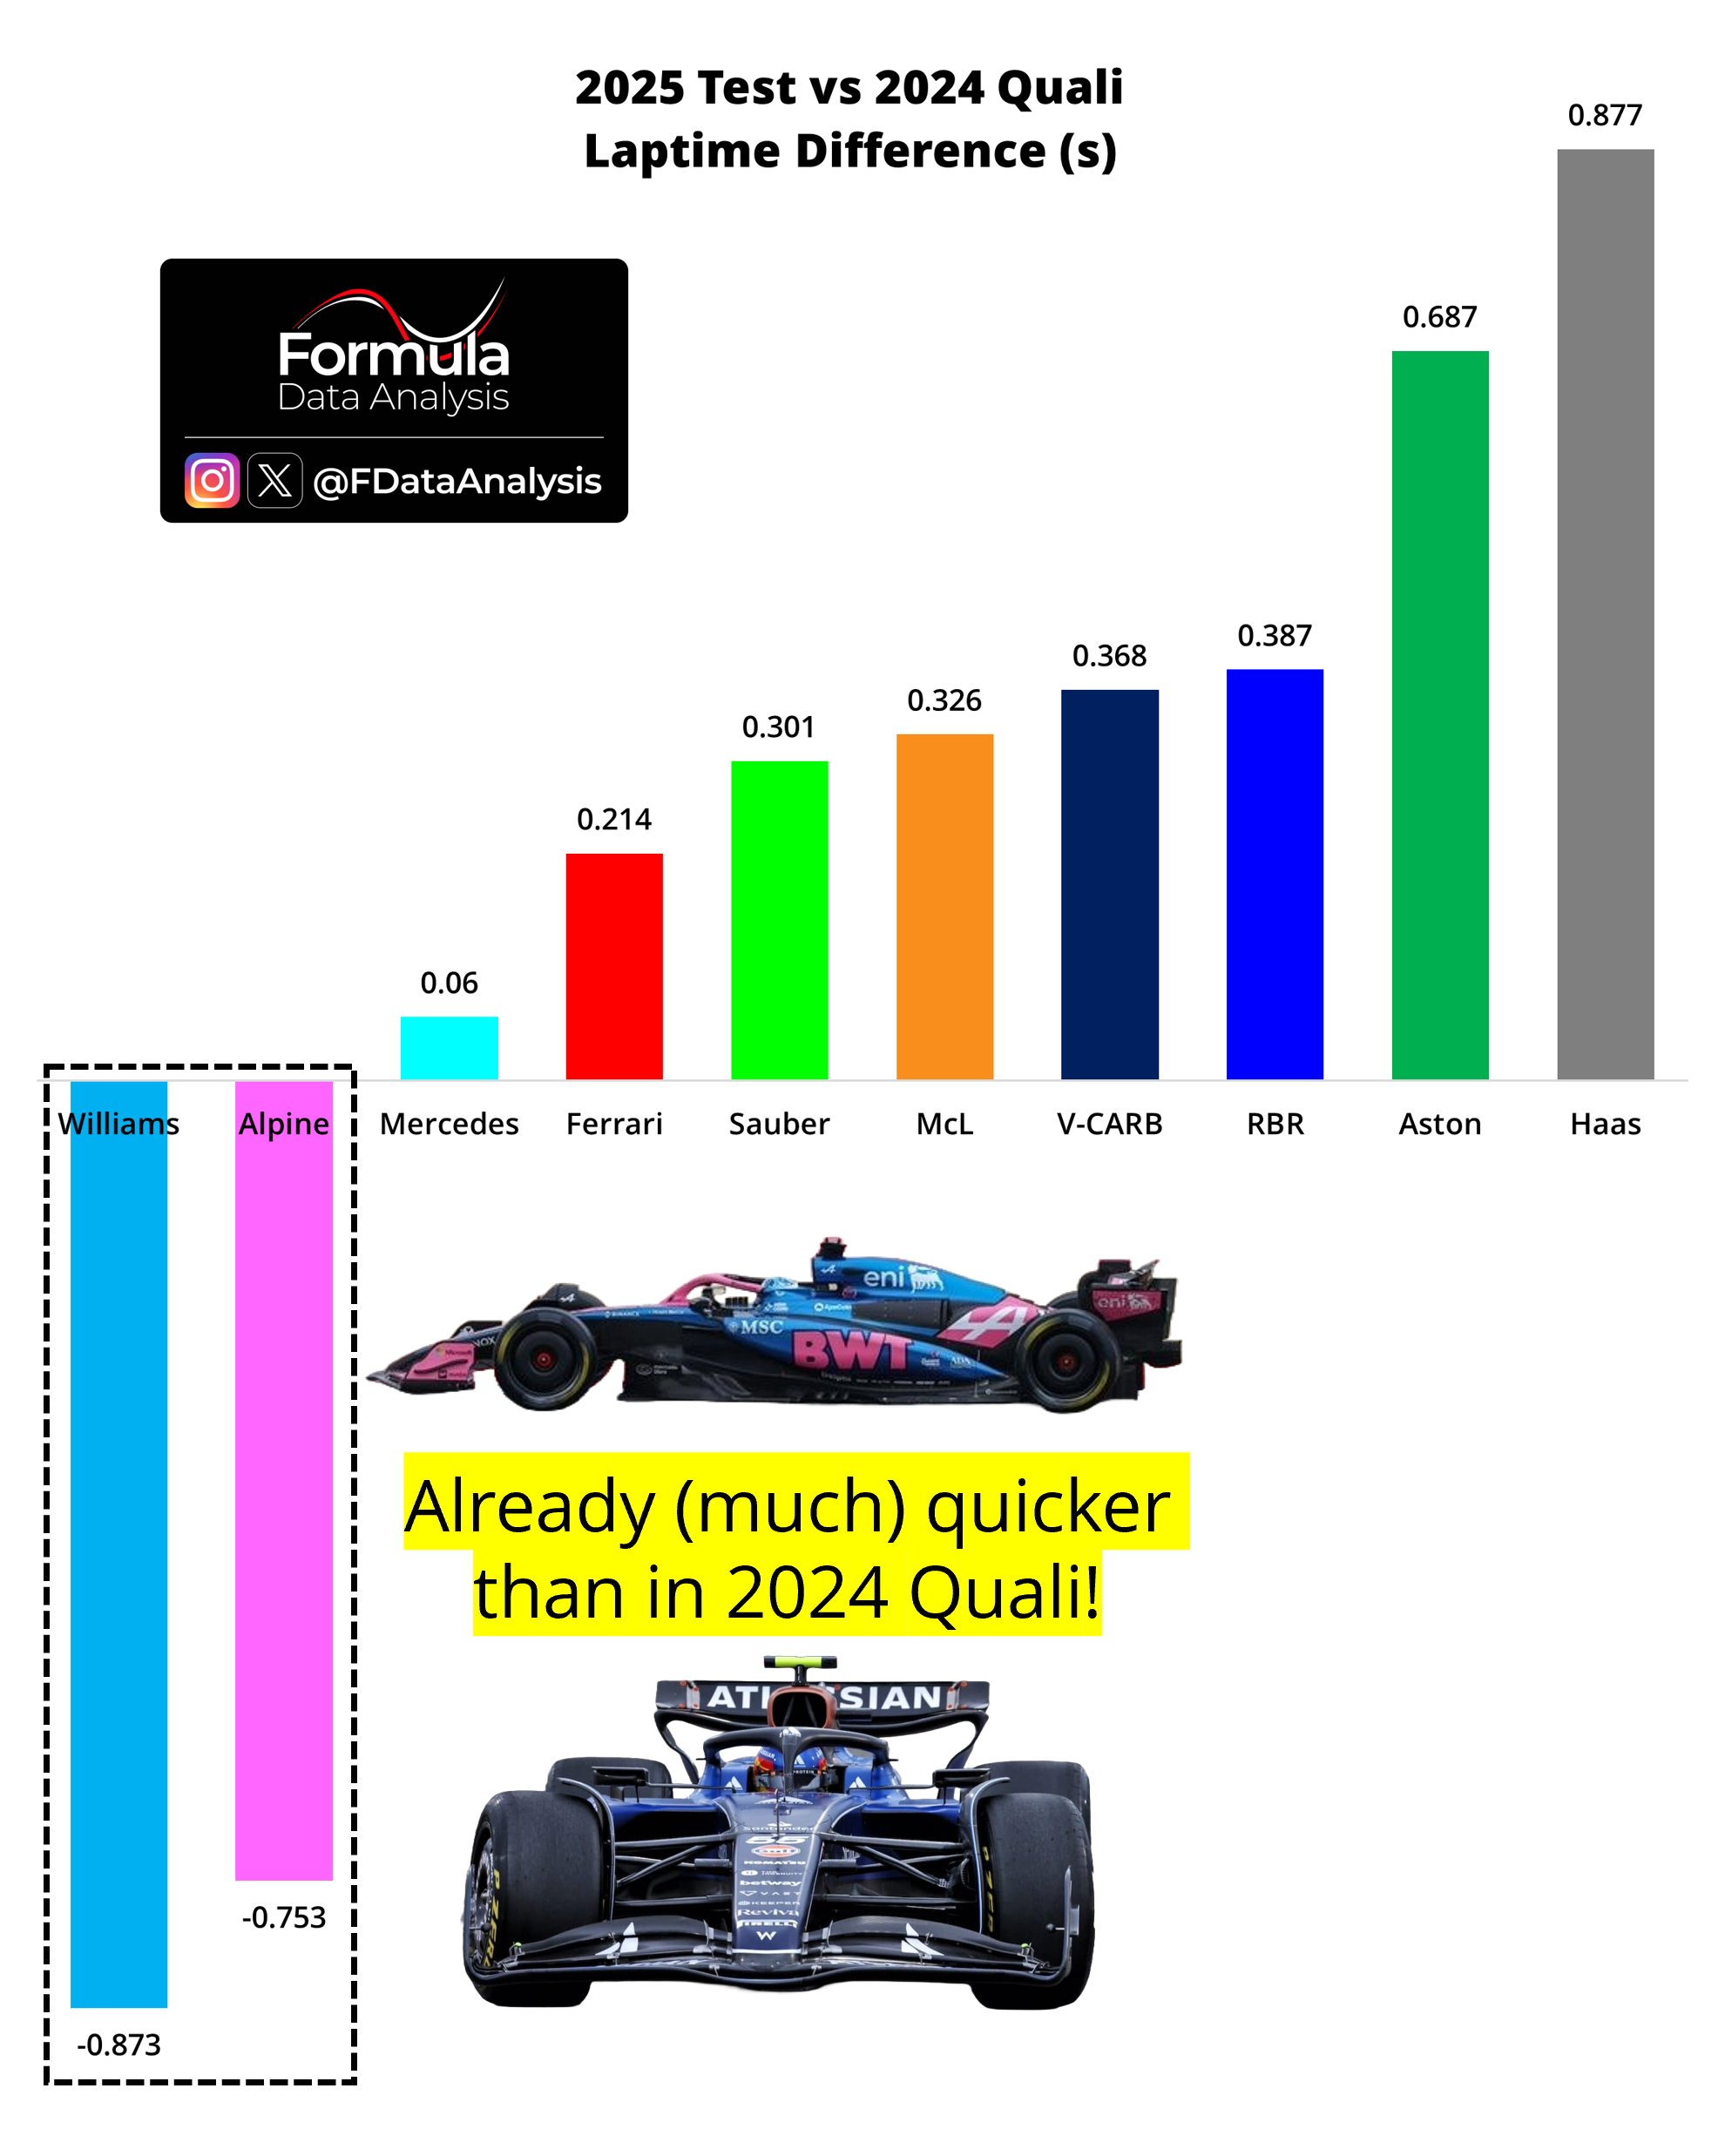
The second day was the one in which the fastest laptimes were performed: SAI topped the timesheets for the day (and, therefore, also those for the 3 days combined), closely in front of the two Ferrari cars. As his teammate the following day, he also covered the most laps (126). Williams is the surprise of this test, having covered a significant amount of laps and produced some very competitive laptimes, improving almost one second over their best 2024 quali laptime. Haas catches the eye, as they didn't attempt a push lap (as they did on Day 1, too). PIA completed the fewest laps (44)
Day 1
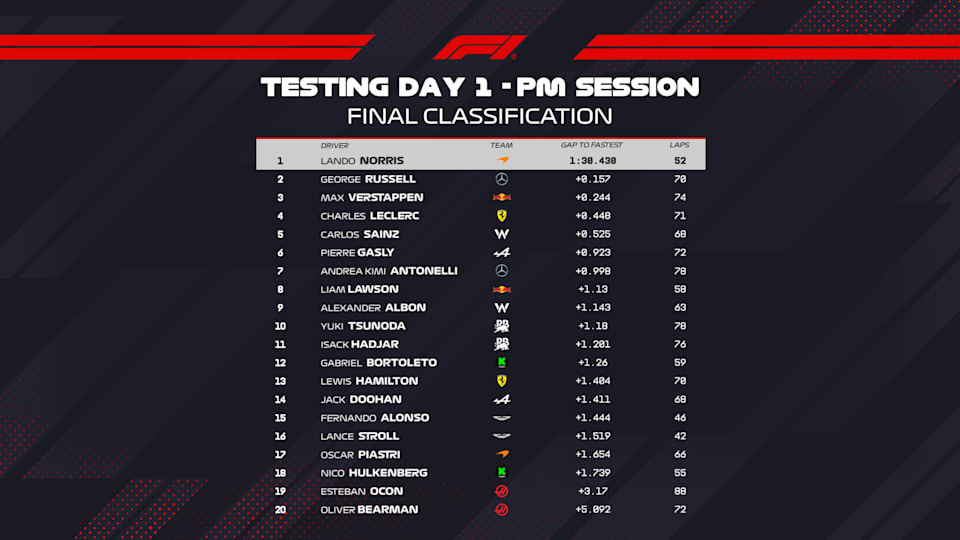
Going back in time (and looking at slower laptimes), the first day was topped by NOR: a different team was quickest on each day. He was followed by RUS and VER. OCO completed the most laps (88), STR the fewest
Overall Distance Completed
The more laps completed, the more data acquired by the team, aiding the development process. Conversely, covering relatively few laps limits the usefulness of the test to the team and can be due to issues that appeared on the 3 days.
Teams sorted by the number of laps covered (highest to lowest)
1)Mercedes
2)Haas
3)Racing Bulls
4)Alpine
5)Williams
6)Ferrari
7)McLaren
8)Sauber
9)Aston
10)Red Bull
Red Bull only covered 66.4% of Mercedes' laps (one-third less). Haas's efforts on longer stints helped them in this regard.
Track Characteristics
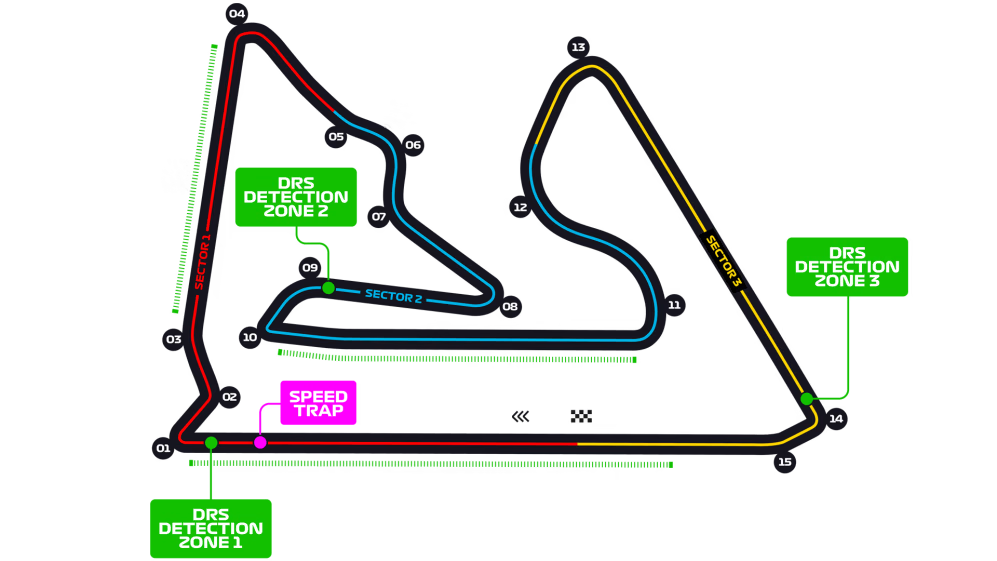
How to read: The track map shows its layout divided into three sectors (S1 in Red, S2 in Blue, and S3 in Yellow). The zones in which the DRS can be used are highlighted in green. In the race, a driver who crosses the DRS Detection Zone within 1s of the preceding driver can use the DRS in all zones up to the next DRS Detection Zone.
To analyse the pre-season test data, we must first have a clear picture of the track the testing is performed on!
Bahrain is a track made of 4 straights connected by slow and medium-speed corners. As such, it requires medium-load rear wings to reach a good compromise between straight-line speed, traction, braking, and cornering performance. It is a rear-limited track due to the numerous slow corners: exiting from the corner in a lower gear, the traction is the limiting factor, producing oversteer and wearing the rear tyres. A more understeery setup, albeit slower in qualifying, should aid the driver in managing his tyres along the sting.
It features 3 DRS zones, making it possible to dump a lot of drag through the upper plane: running a less loaded lower plane and more loaded upper plane ensures the highest degree of exploitation of the DRS in qualifying. In the race, however, the draggy upper plane might reduce their straight-line speed in a more evident way.
Characteristics of each sector:
Sector 1 (red): Two straights connected by a chicane. Having low drag yet good braking stability into T1 and traction out of it are crucial
Sector 2 (blue): the slowest one, with many medium and slow-speed corners and only a shorter straight. Downforce is critical for performance here
Sector 3 (yellow): A non-DRS straight and two medium-speed corners. Exiting well out of T13 and having a strong ERS deployment over the straight (as the unavailable DRS increases drag, draining the battery significantly) is important.
Top Speeds
How to read: the higher a team's top speed, the lower that car's drag or the higher that team's engine mode.
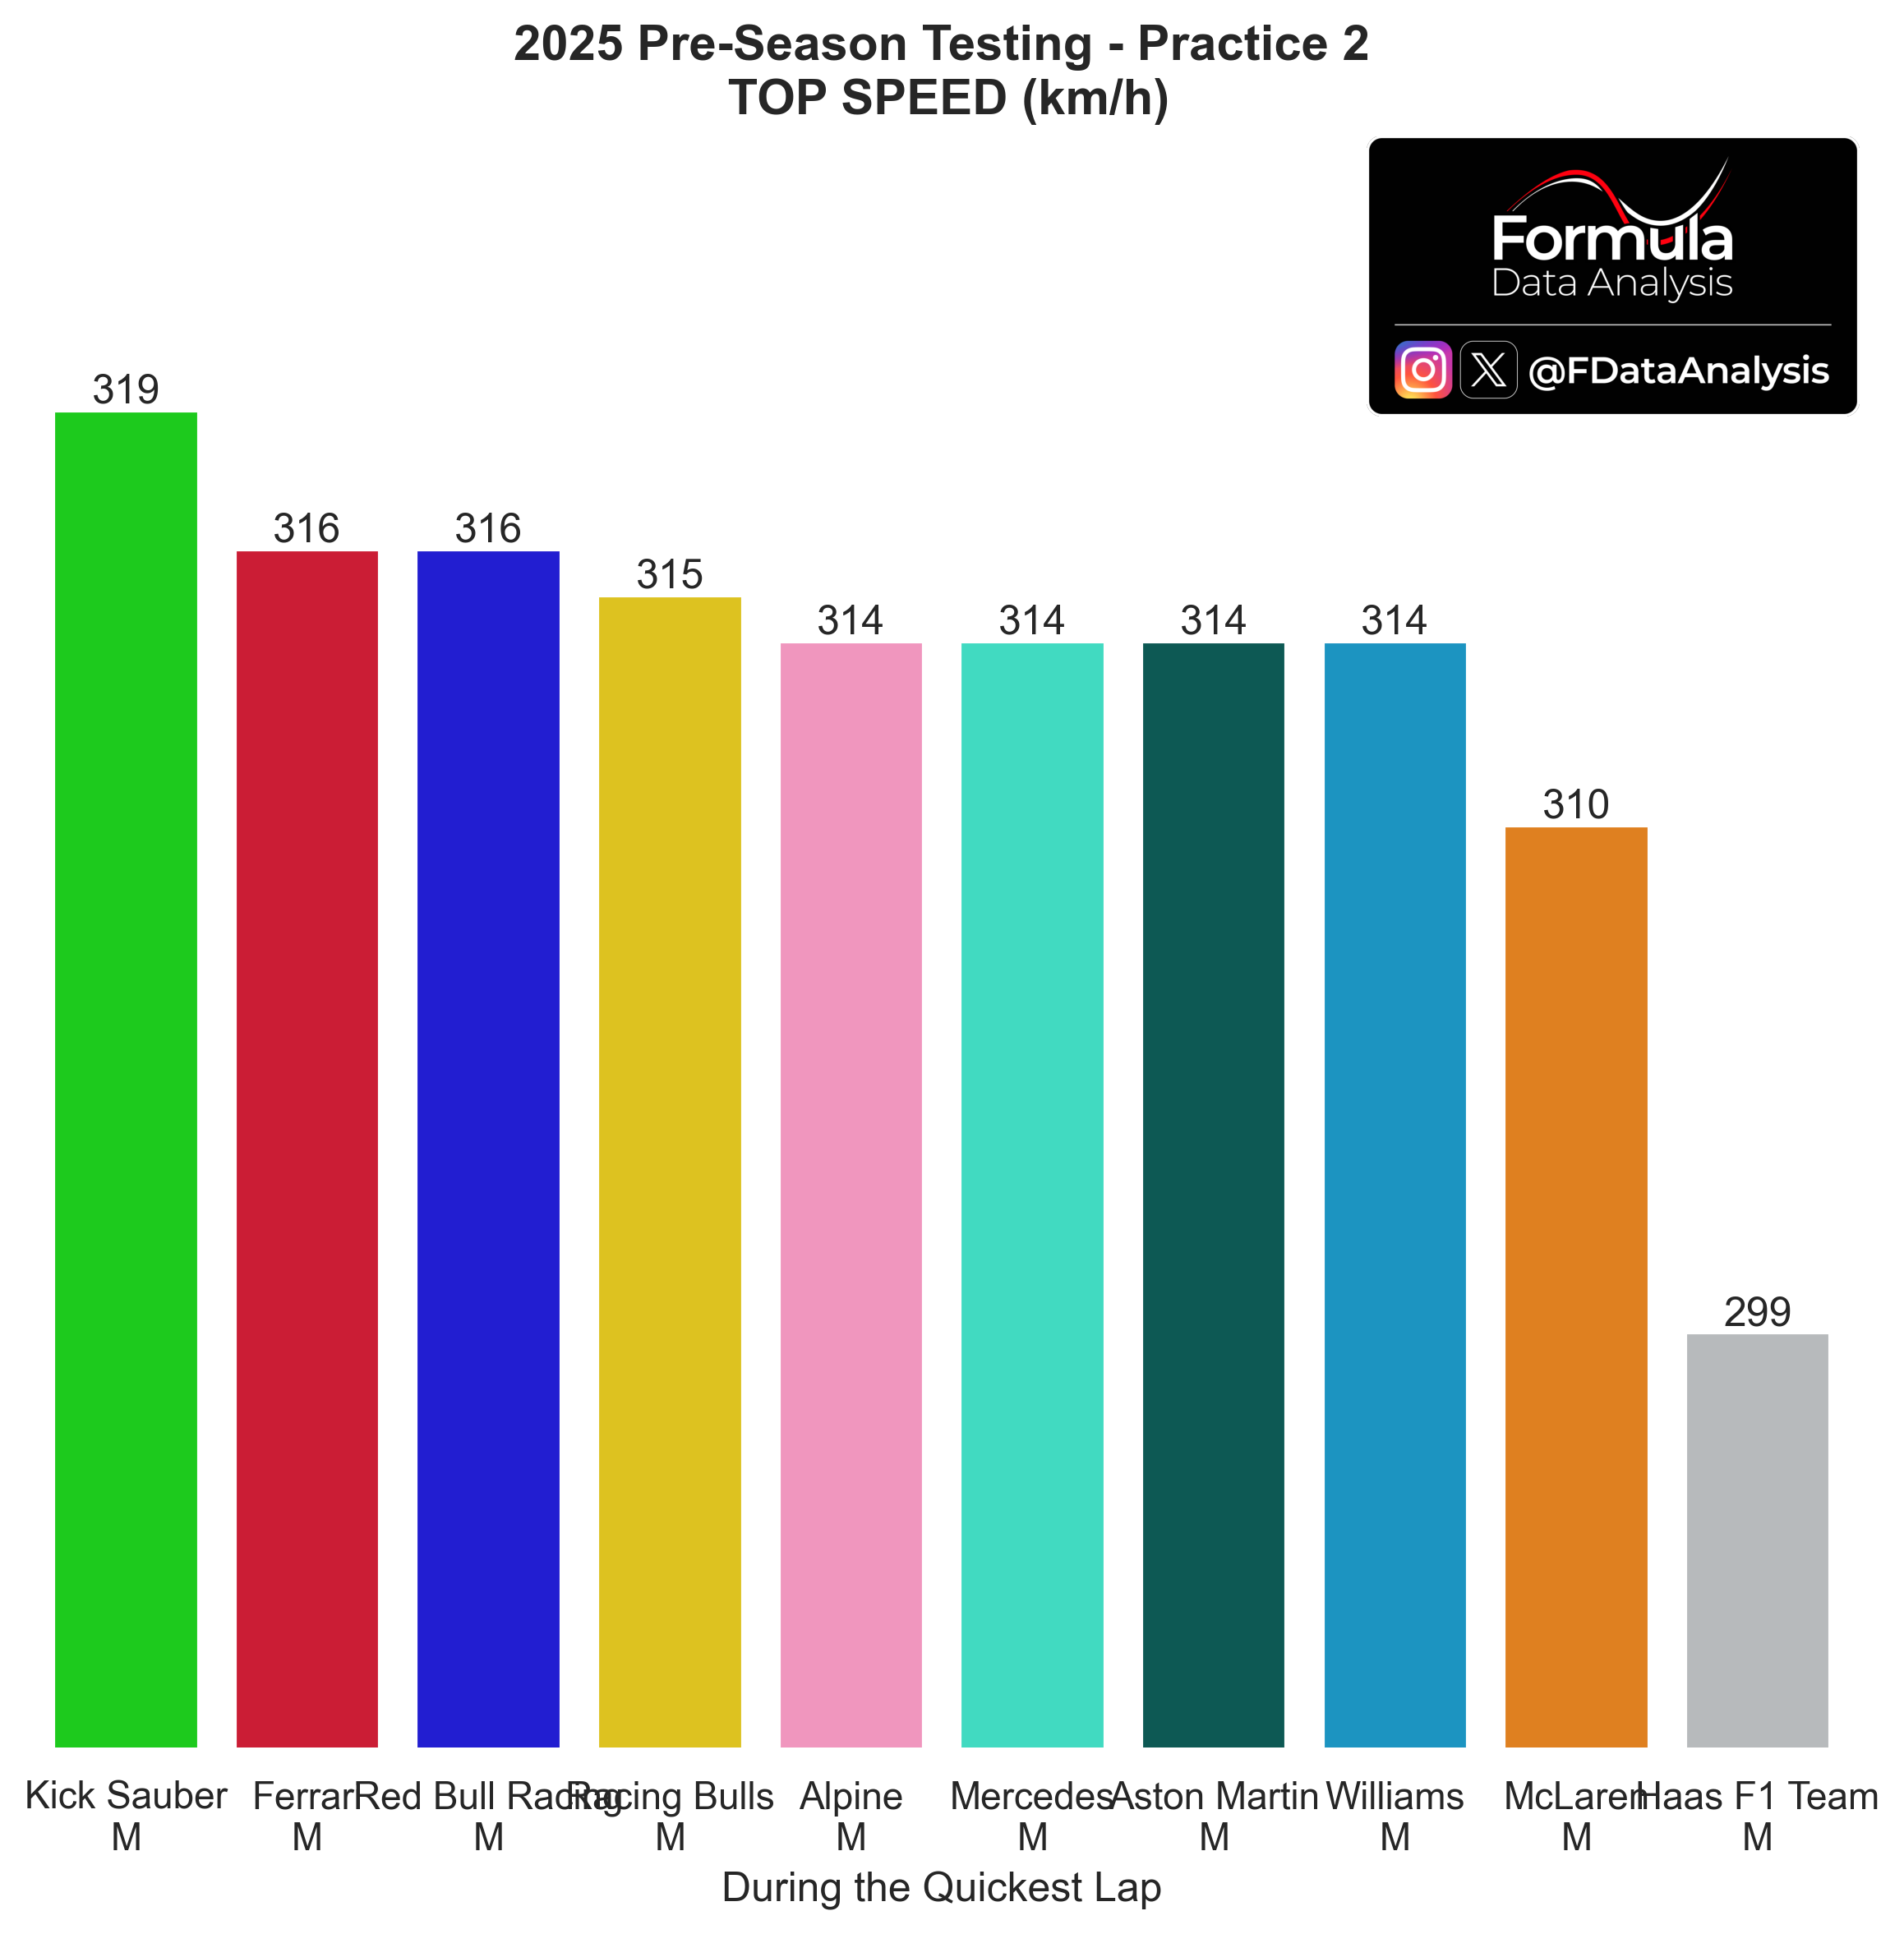
DAY 2
Sauber topped the speed traps on the second day, despite being the 2nd-to-last team in terms of laptime, only in front of Haas (which didn't even use DRS, as shown by their 20km/h top speed deficit!)
McLaren, instead, had a very limited top speed (310km/h): the telemetry reveals that, compared to Ferrari, the papaya car has lower acceleration at high speeds only. They were likely running more downforce (and therefore drag), but their deployment in the push lap seems weaker, too. Apart from these two extremes, the field was overall tight (7 teams within 2km/h)
DAY 3
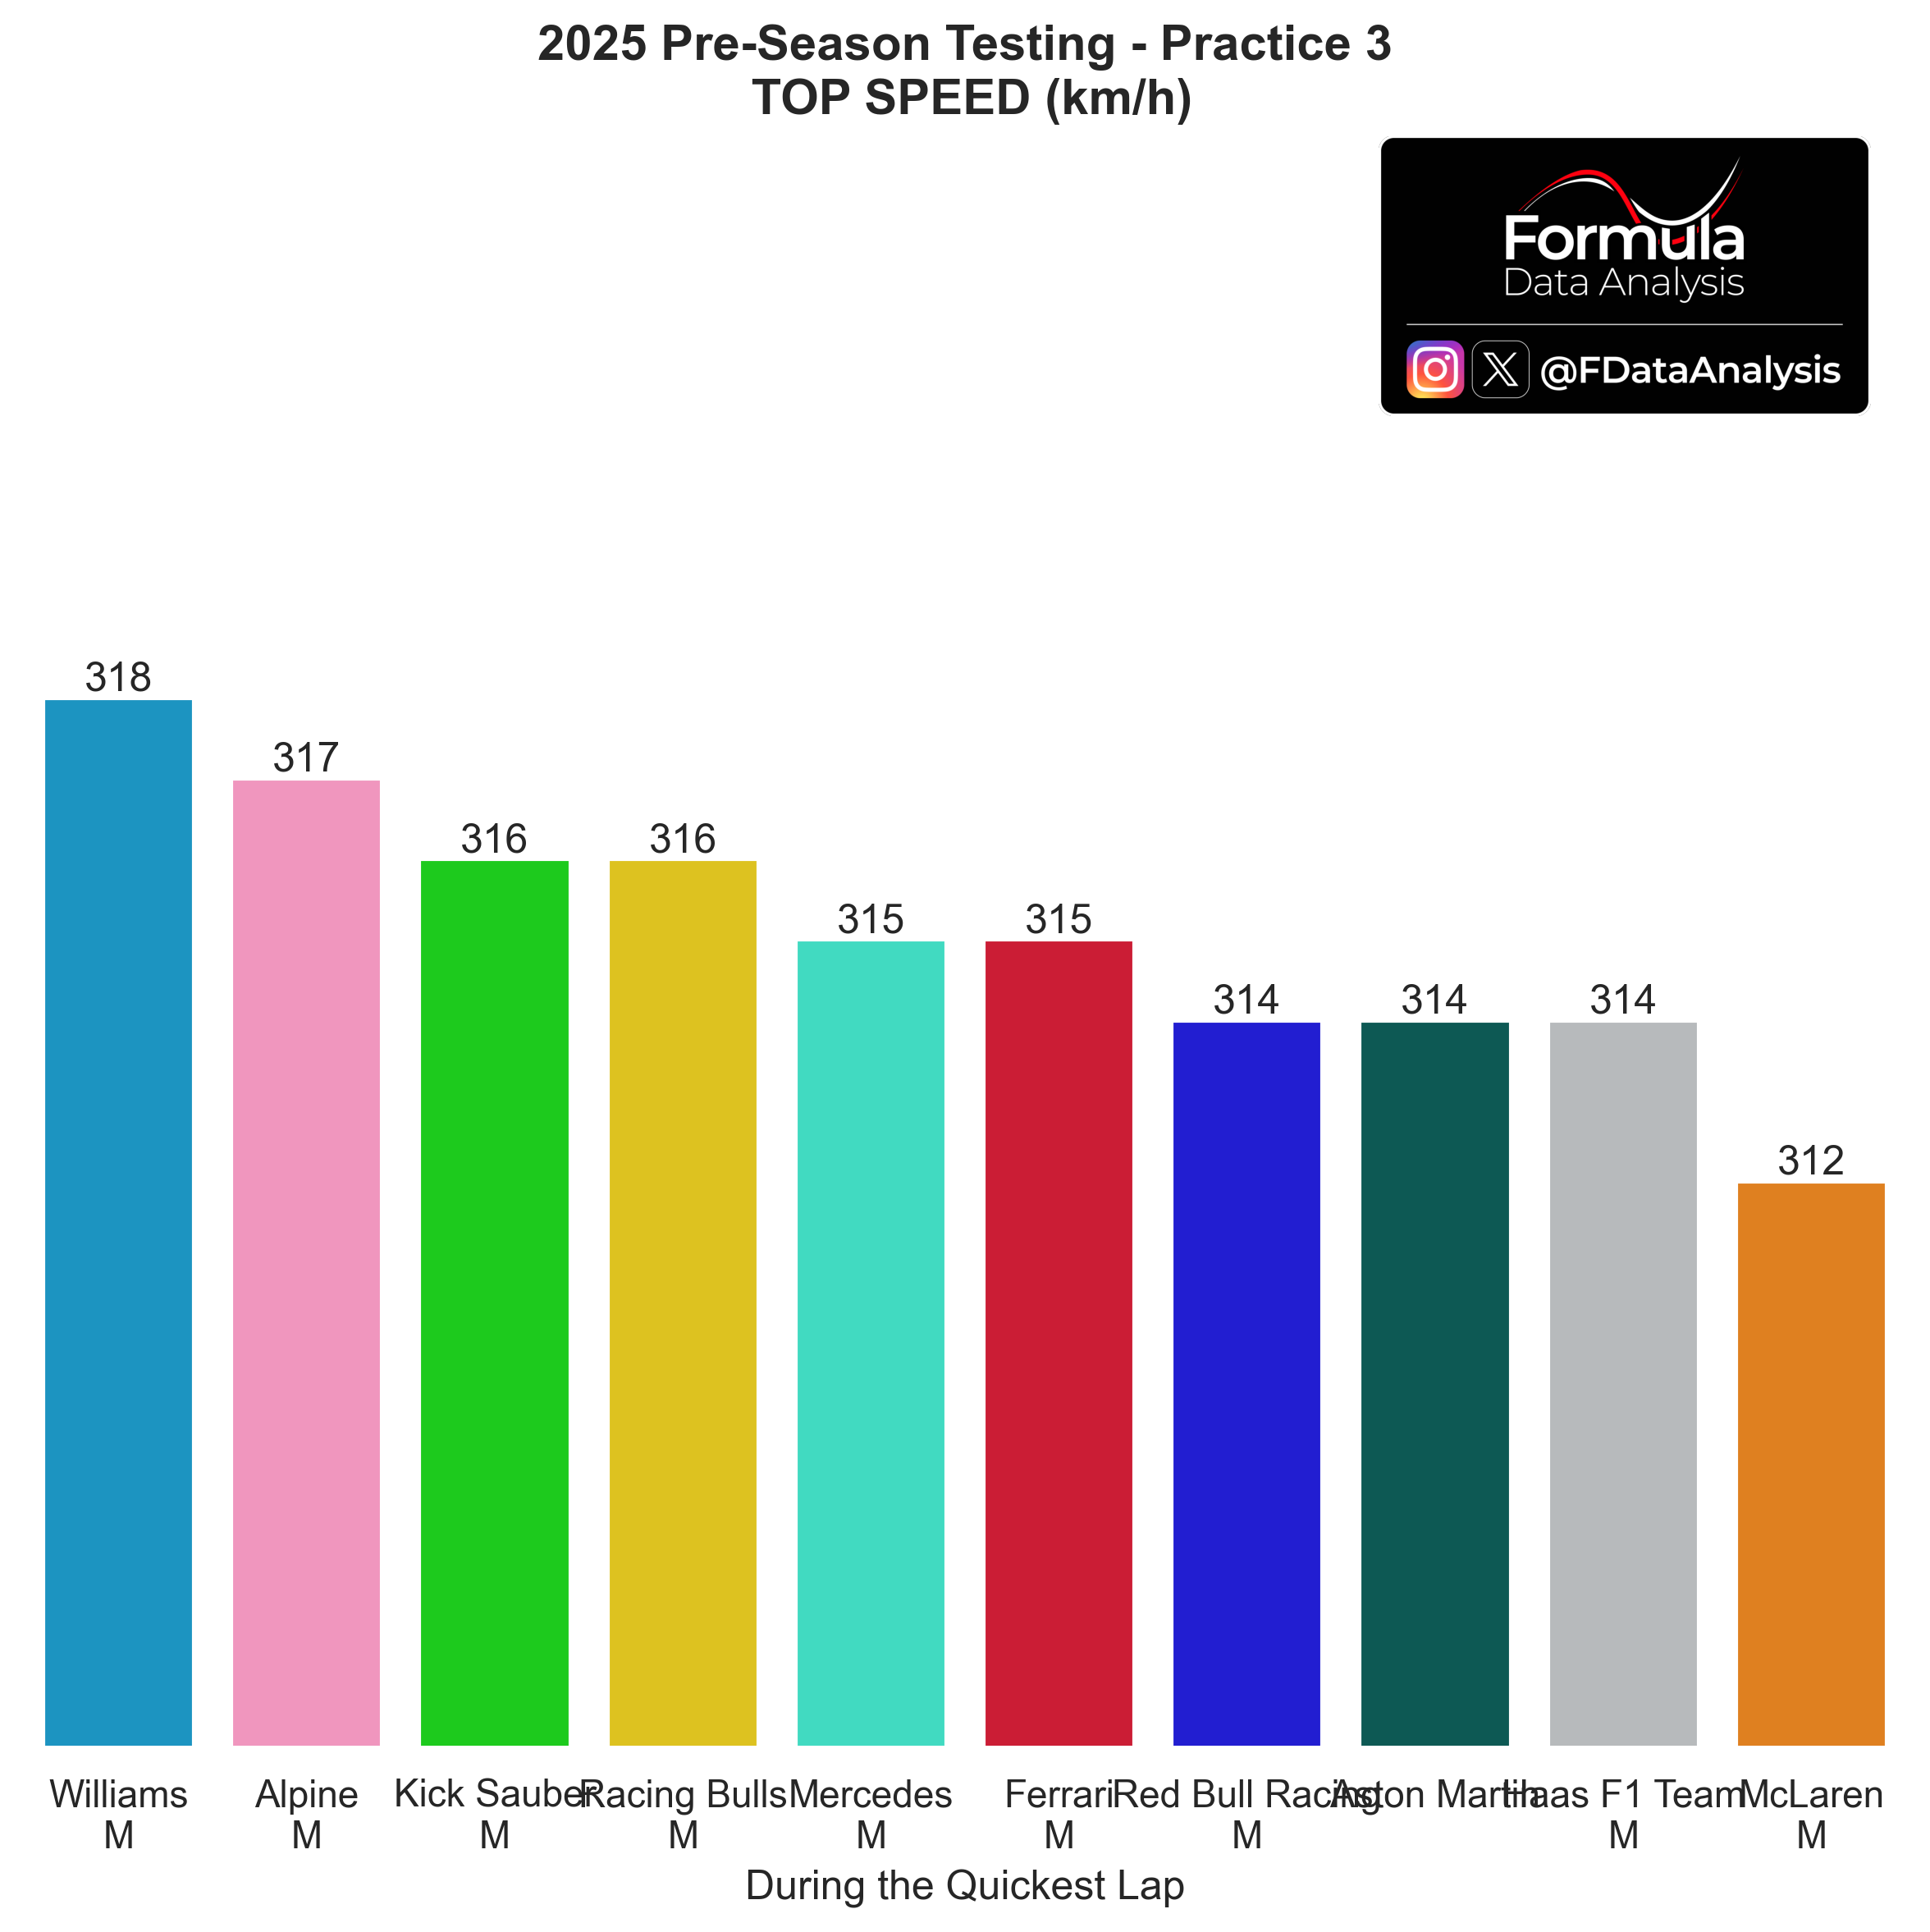
McL was slowest again in the speed traps on Day 3, behind Haas (who finally used DRS). Williams and Alpine had the highest top speeds: coincidentally, they are also the only teams which improved their pace vs last year's quali. It seems that they were running a slightly more powerful engine mode than most other teams. Note, however, that the test's quickest lap was made by SAI on D2, and his top speed was moderate on that attempt. Once again, little variance across the field: 7 different teams within 2km/h.
Best Sectors
DAY 2
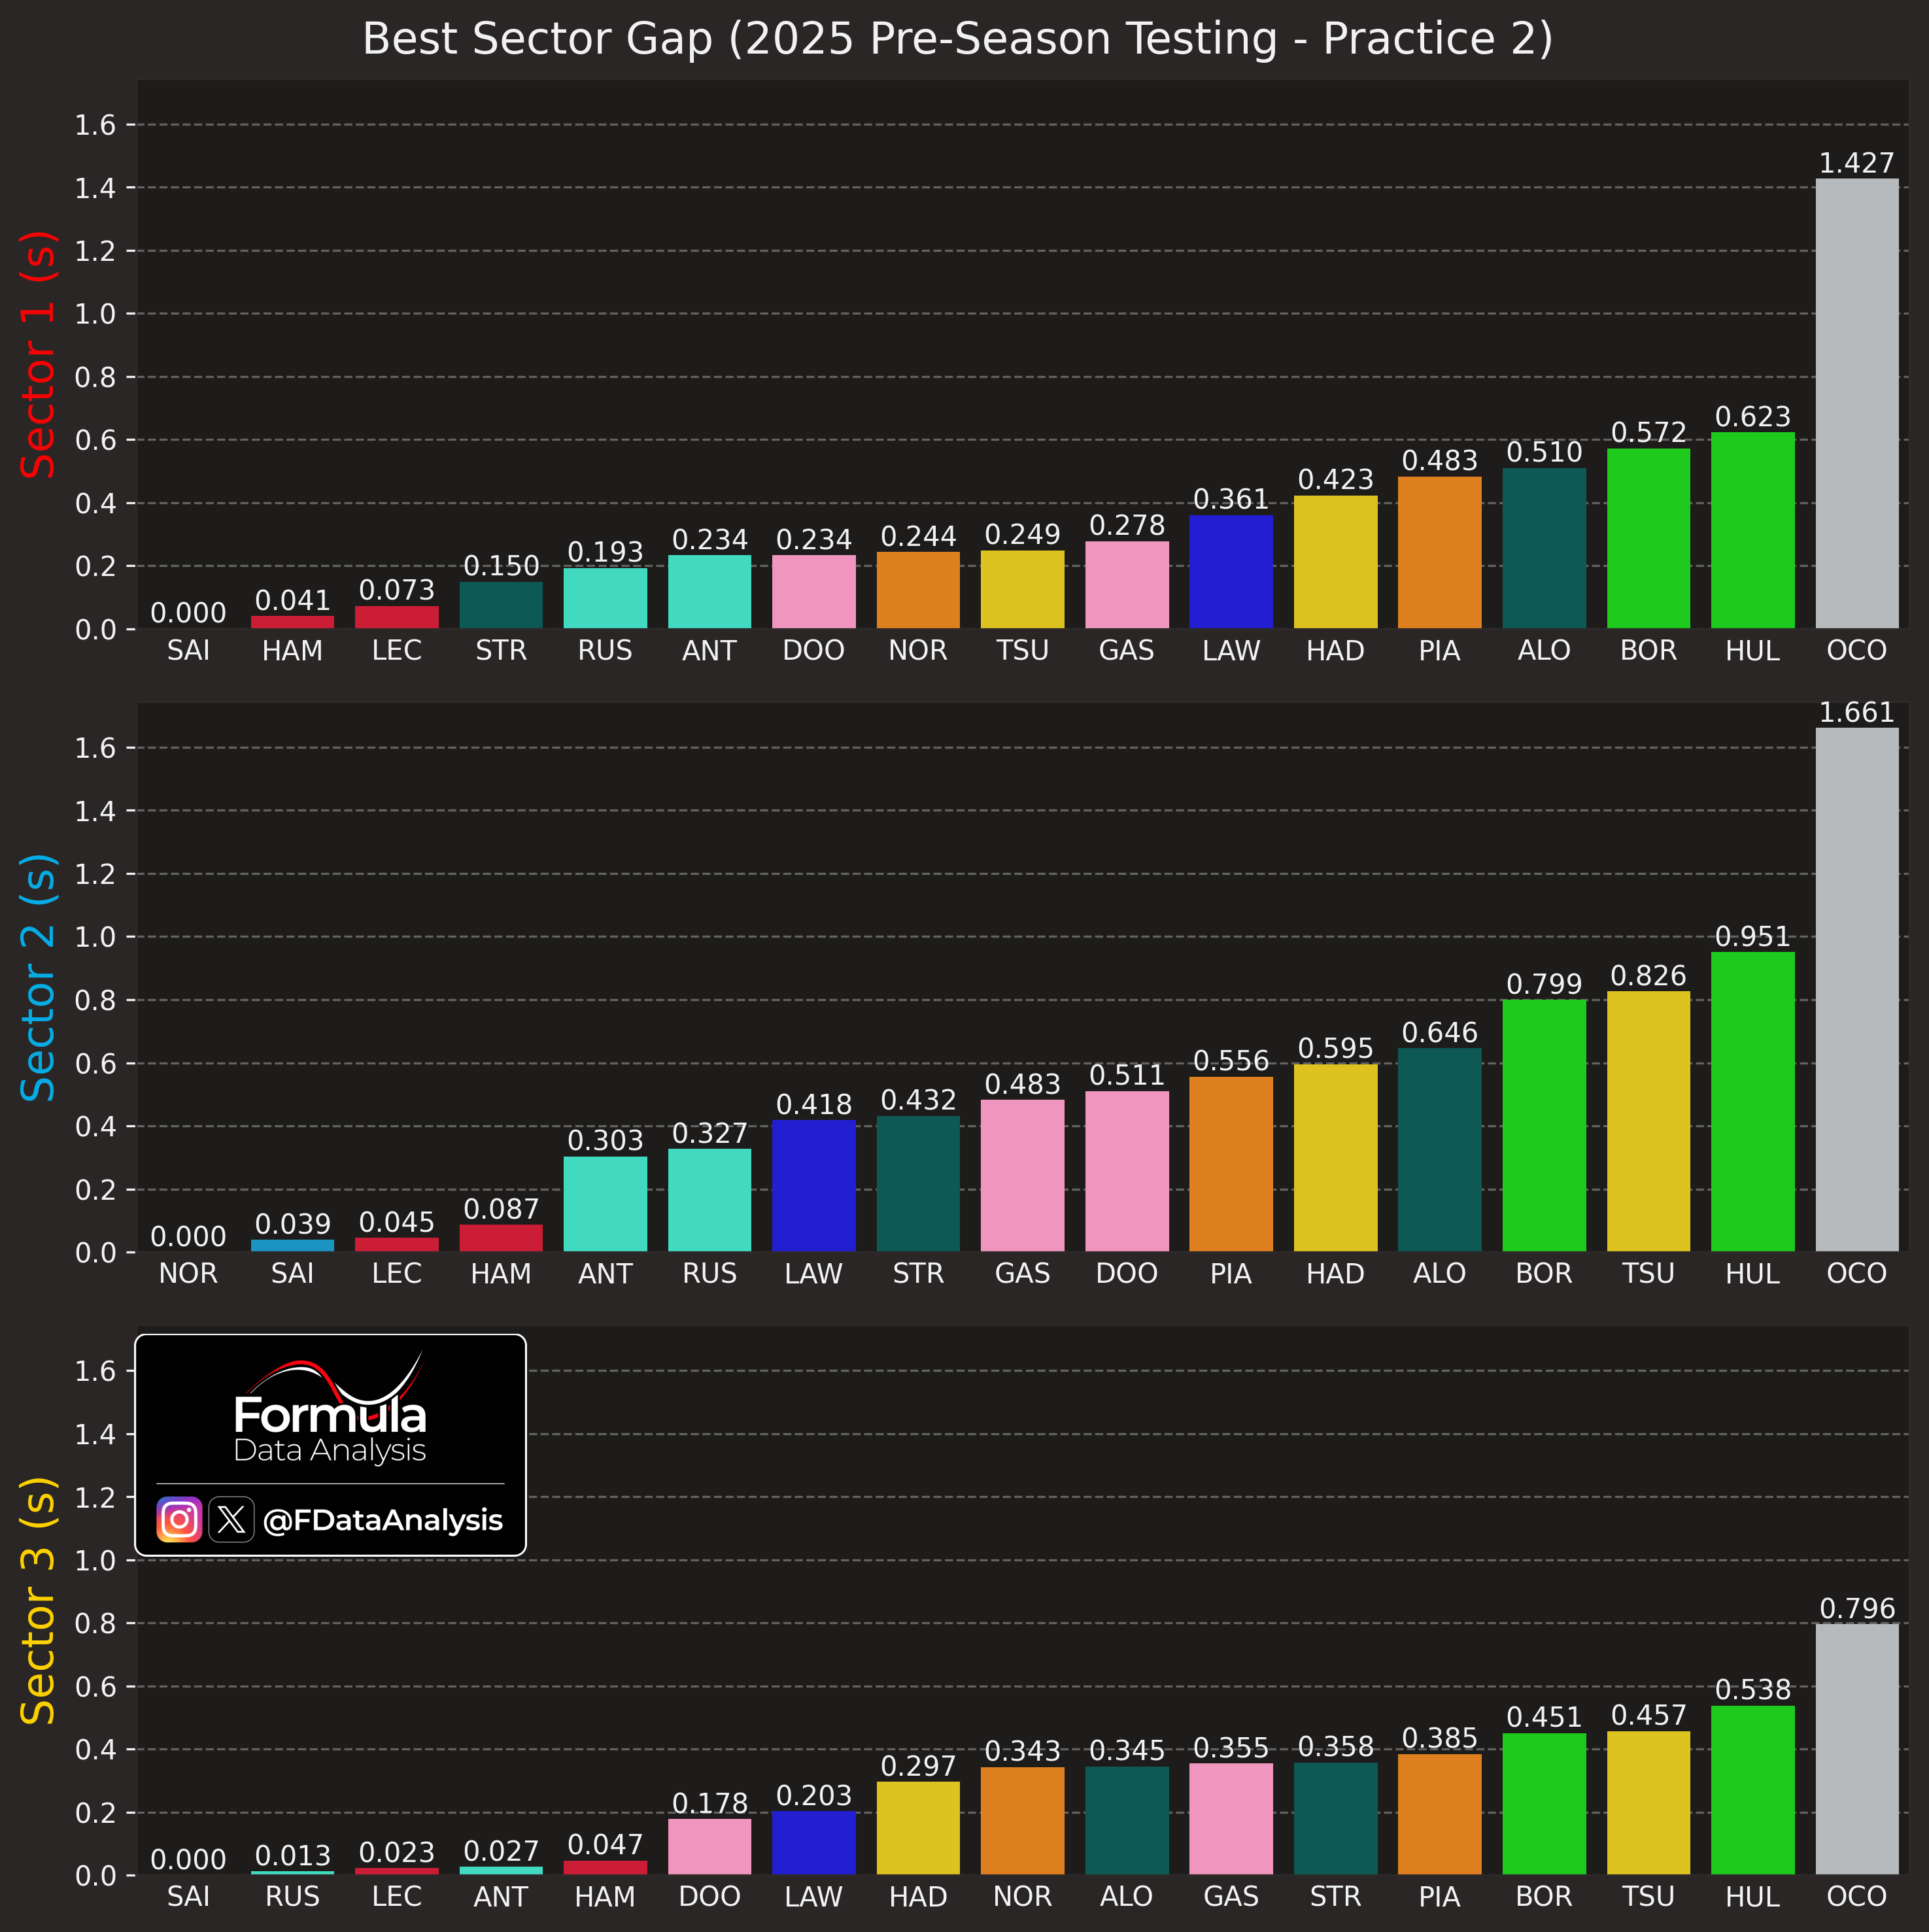
SAI was quickest not in one, but in two sectors (1 and 3)! What's peculiar is that those sectors require good straight-line performance, but his top speed was unremarkable on D2. Meaning: he was quickest there thanks to excellent braking/traction (Sector 1) and cornering too (Sector 3), and not due to a higher engine mode (which would have been the easiest way to gain significant performance). Bodes well for Williams!
NOR was quickest in S2, displaying excellent downforce. SAI was 2nd quickest here, though, due to the reasons explained above. Ferrari was the 2nd quickest car in S1 and the 3rd quickest in S2 and S3. Mercedes only shined on S3, which was RedBull's strongest sector, too.
DAY 3
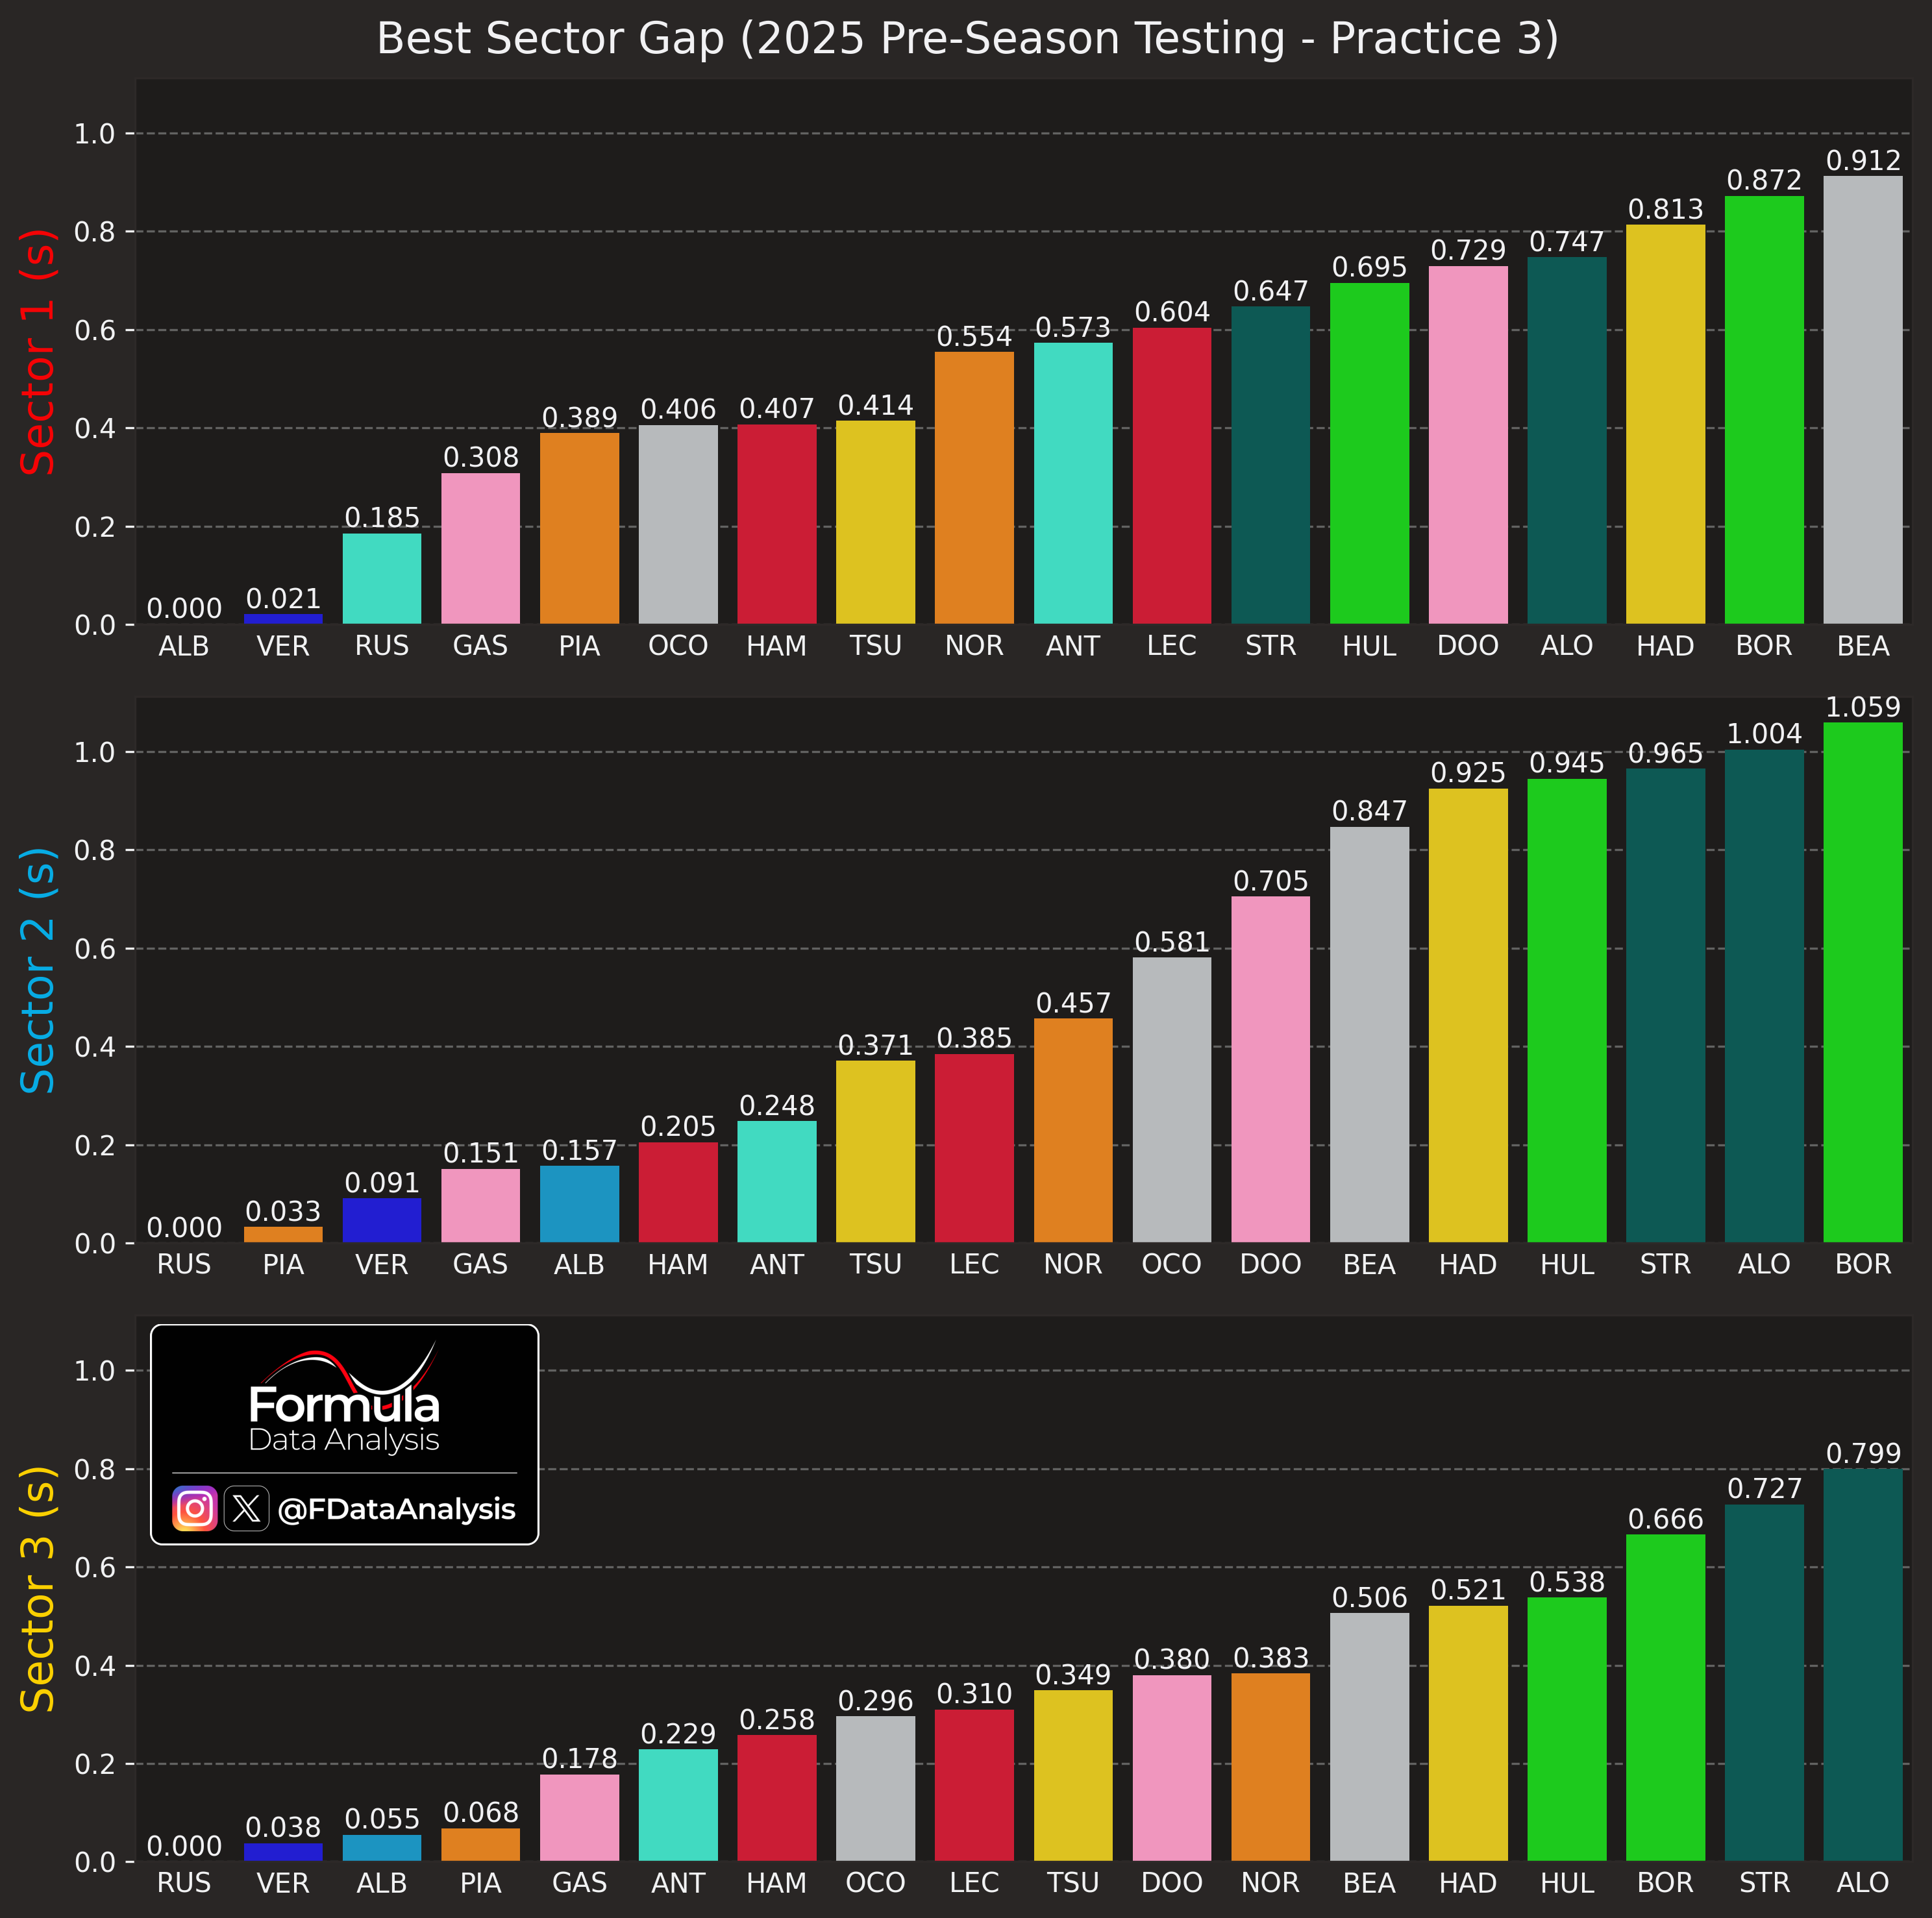
On the last day of testing, a Williams was once again the quickest in S1. RUS, however, edged ALB in S2 and S3. VER was competitive in all sectors but first in none. McL was quick in S2 but struggled in S1, as expected, due to their higher drag and downforce.
Throttle use
How to read: The graph shows the percentage of the time the driver spent at full throttle. Spending more time at full throttle is correlated with a weaker Power Unit mode, more drag, less fuel, and better grip (especially concerning traction out of the corners). This analysis is used together with the lap time produced by each driver and the corresponding top speed achieved to pinpoint which teams could be on a lower engine mode. For example, if a team produced a lap time worse than usual, but they are topping the charts concerning throttle usage, it's pretty likely that they were running a more conservative engine mode. Looking at the top speed achieved could confirm it.
DAY 2
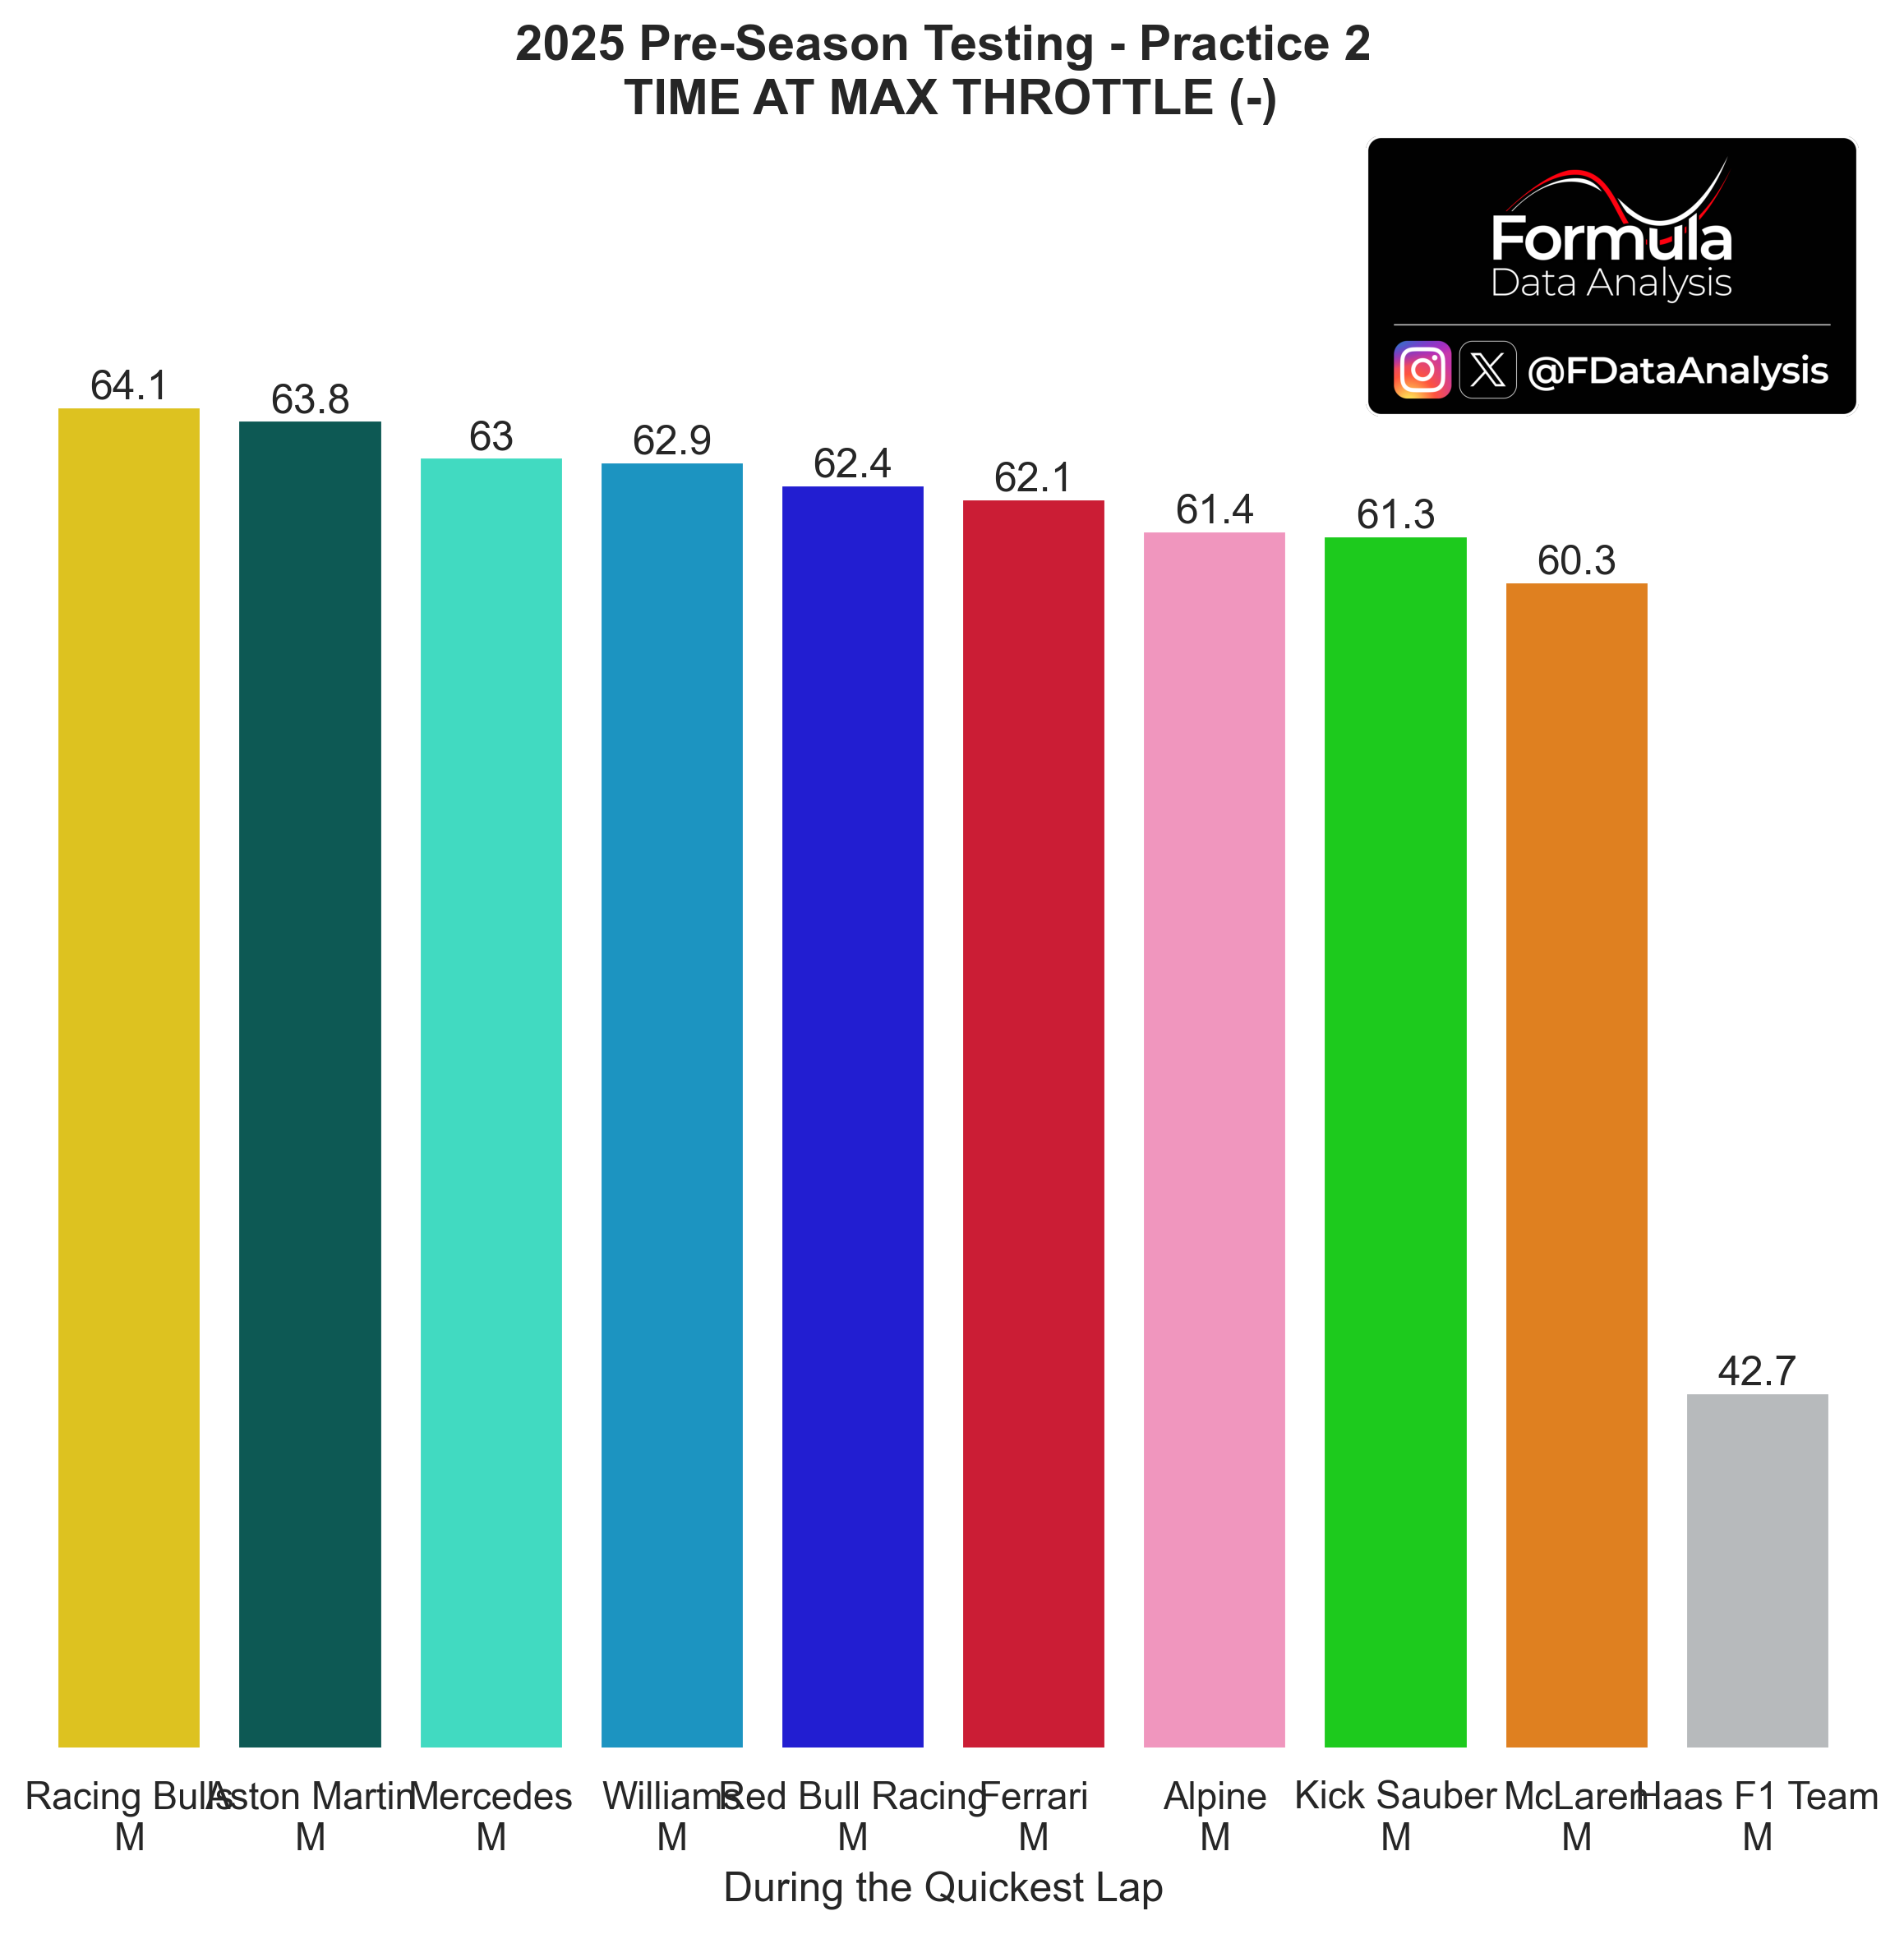
Racing Bulls could stay full-throttle the most on the second day, McL the least (excluding Haas, which didn't perform push laps). This is most interesting, as one would expect McLaren to be higher on this list! (due to their higher drag and downforce). This means that NOR (who performed the team's quickest lap) didn't push as much as other drivers, explaining the team's 'slow' laptime at the end of Day 2. Little difference between the other top teams: less than 1% separated Mercedes, Red Bull, and Ferrari.
DAY 3
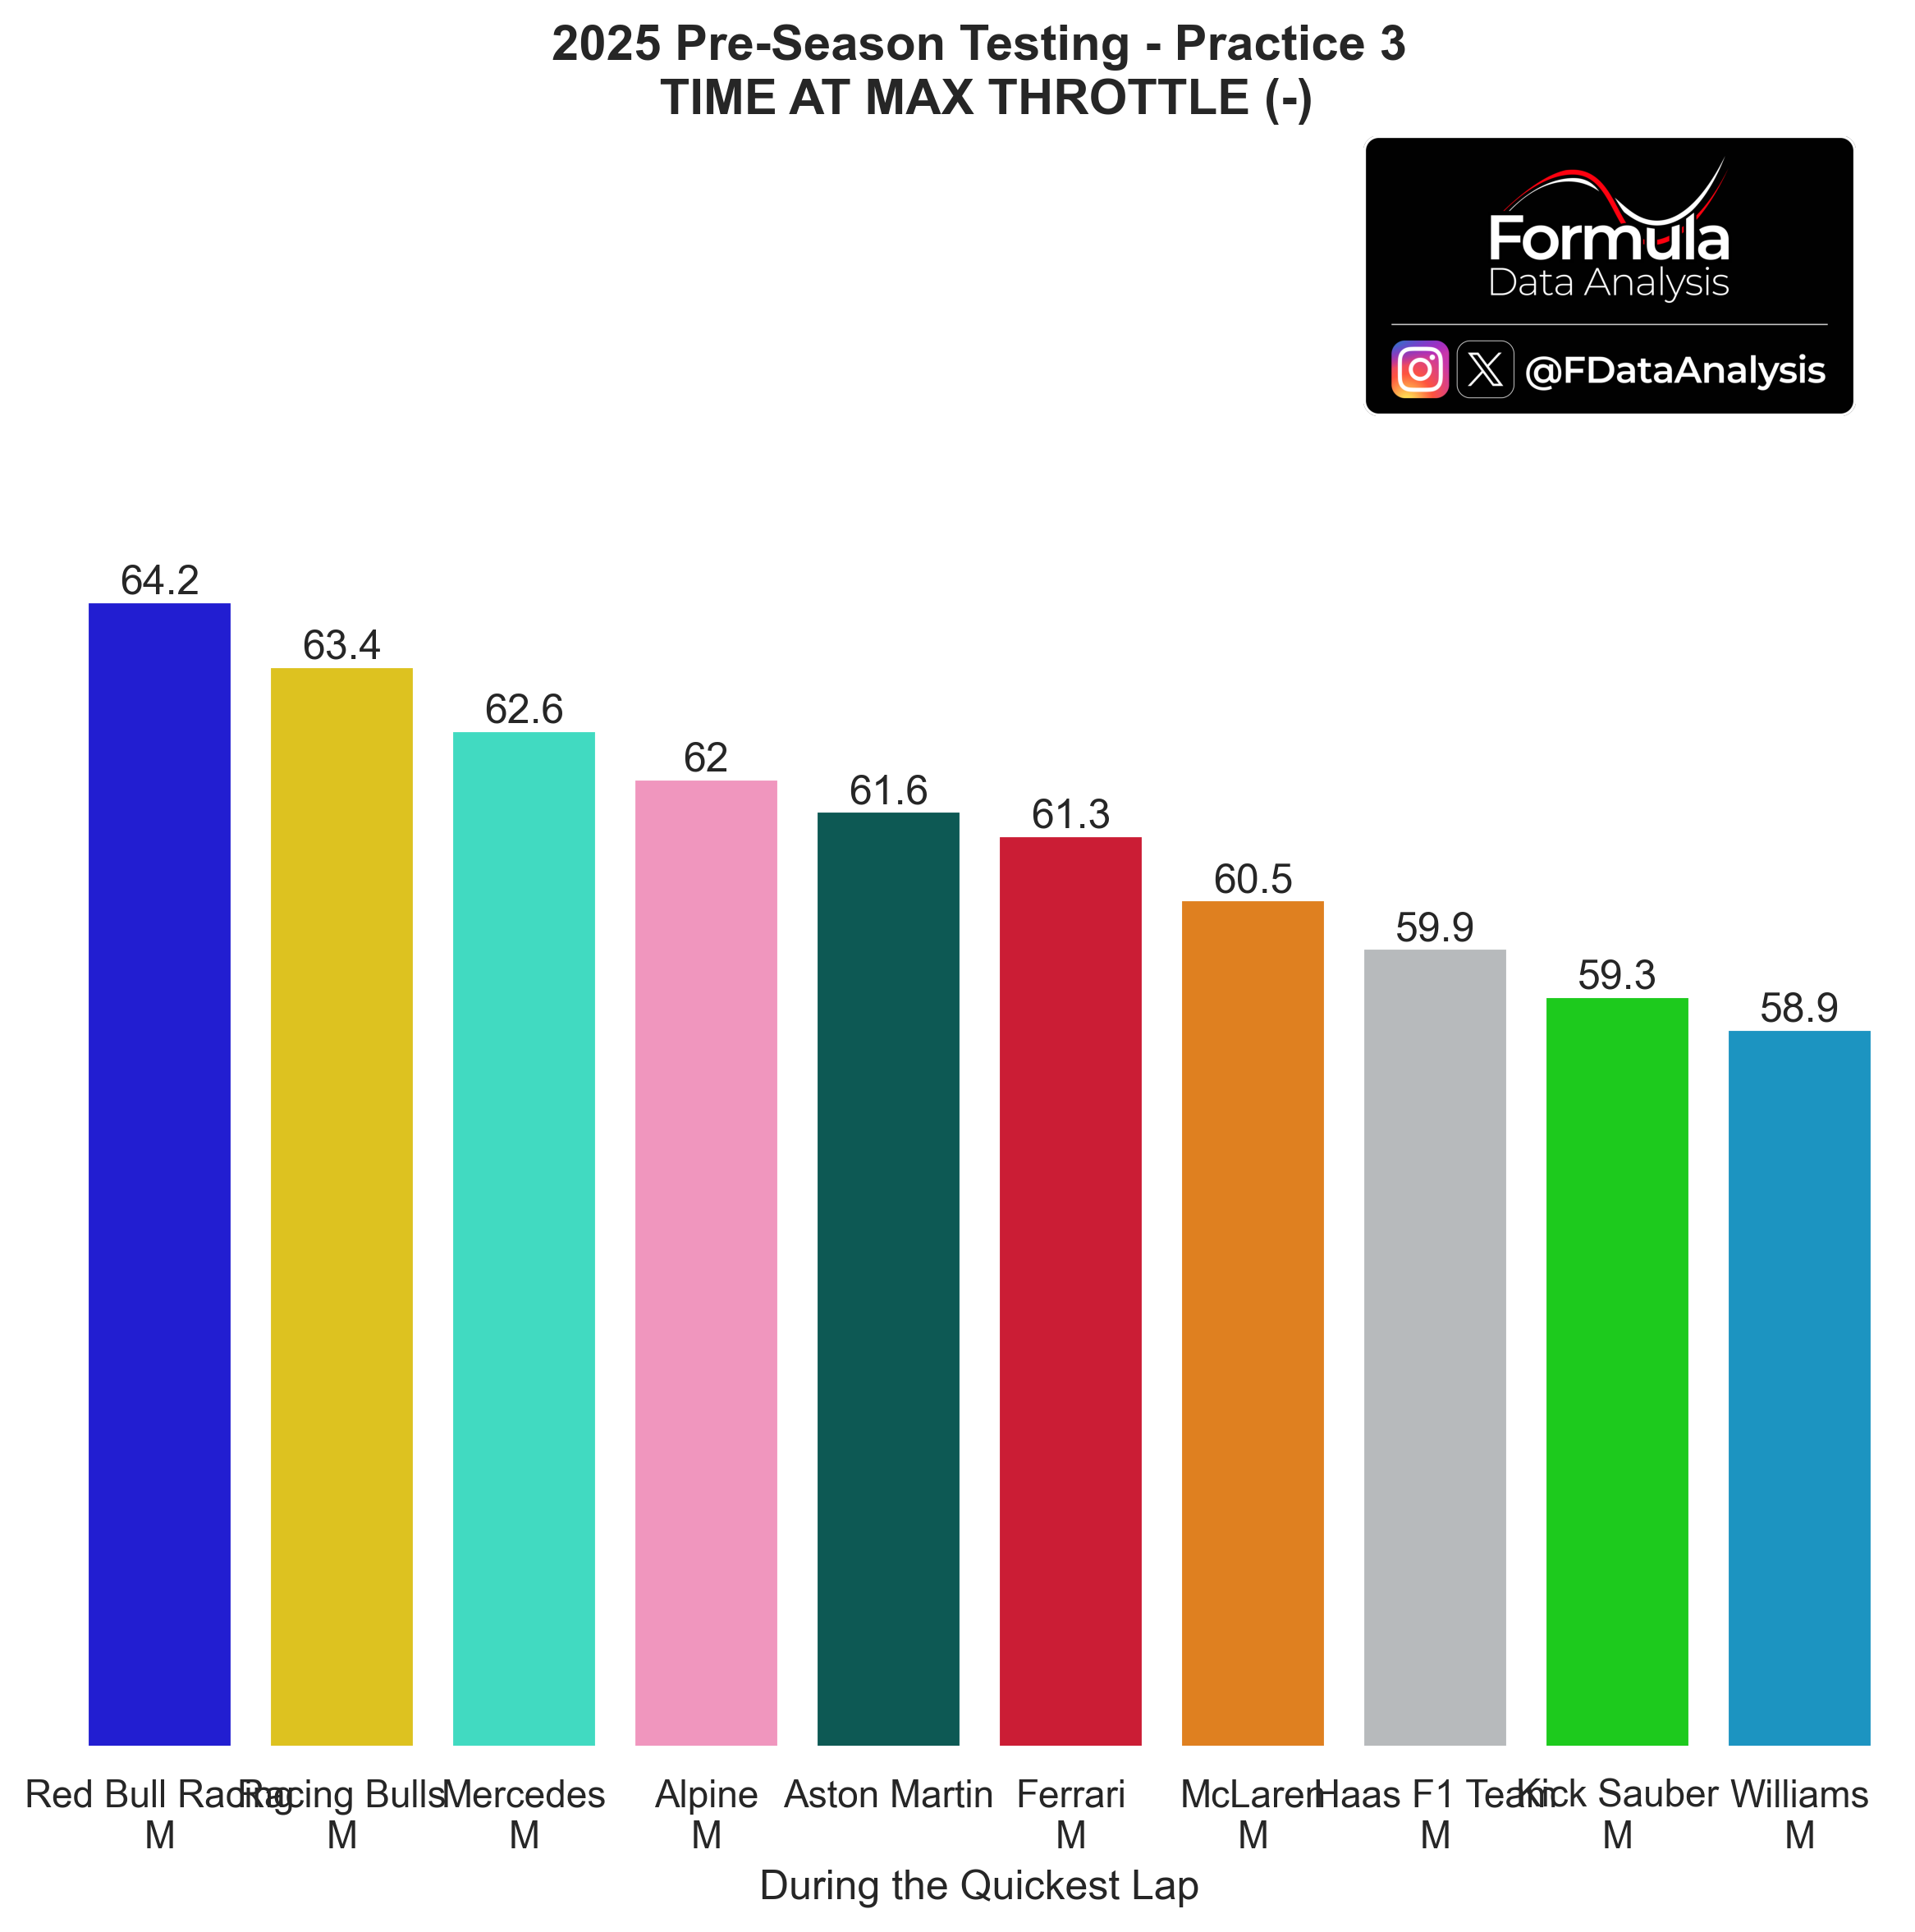
The story was different on Day 3: Red Bull (VER) could stay at full throttle for the longest time. Their top speed was unremarkable: the two metrics suggest that the team was likely running a more detuned engine mode than most. The other way around for Williams: the highest top speed and least time spent full throttle, indicating a prevalence of low drag over high downforce, and likely a slightly higher engine mode, too.
F1's Quali Simulation
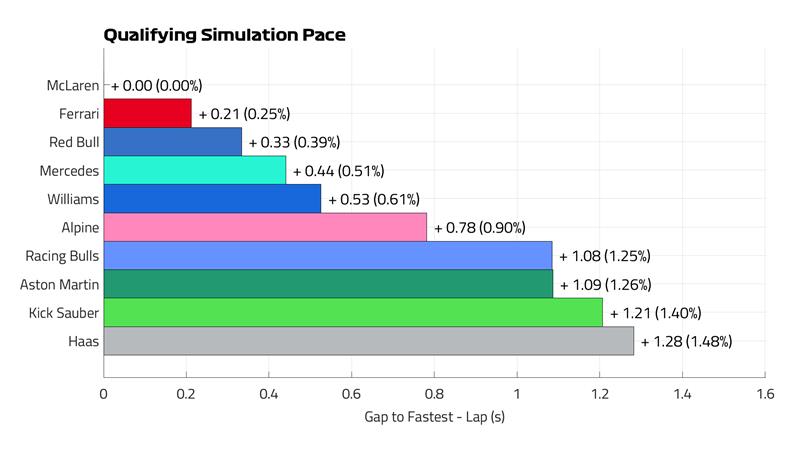
F1's quali simulation (based on Day 3) shows McLaren quickest (as I expected), next Ferrari (0.21s behind), Red Bull (+0.33s) and Mercedes (0.44s). Williams is expected to be the 5th quickest team: not as shiny as their placement on the timesheet would suggest, but a huge leap compared to last year if true! Alpine would be the 6th quickest team (the only other team already quicker than in 2024). Racing Bulls would match Aston, while Sauber and Haas are expected to be the slowest (I disagree concerning this: Haas should be quicker than Sauber at least, as the former focused on long runs all 3 days while the latter was often slowest despite their high top speed)
Here are the comparisons I made about 2025 vs 2024:

Race Simulations
DAY 2
3 different teams (McL, Ferrari, Mercedes) did a full race simulation on Day 2, which provided us some very precious data to evaluate the cars in the aspect that matters more to performance and which is hardest to hide: race pace!
NOR was quickest overall, gaining over 5 tenths over both LEC and ANT. On softs, the margin was smaller: 0.350s vs LEC and 0.376s vs ANT. However, NOR's laptime continued to improve throughout the stint, suggesting that he was indeed managing his pace. On the second stint, ANT and LEC used the C2 tyre, while NOR used the hardest compound (C1): despite that, he was quicker by over 2 tenths over LEC and almost 4 vs ANT. Tyres were swapped for the last stint: here, NOR's overall better pace and his softer tyre allowed him to lap below 1:33 on average, inflicting a gap above 1s to both his rivals!
Overall, NOR was 2.128s quicker than in his 2024 race: different track conditions alone cannot explain such a huge difference, especially considering that NOR was running with a lower engine mode than in the race (as expected). The car seems to have improved significantly vs 12 months ago, when it still wasn't a dominant beast. It has to be said that LEC had a lower ERS deployment on his third stint compared to NOR, which made him lose 1-2 tenths per lap on the last 20 laps of the simulation.

DAY 3
McLaren and Mercedes repeated their race simulations on Day, with different drivers (PIA, RUS).
RUS had severe degradation on the soft, which made him half a second slower than PIA. Once he changed tyres (C2), he was as quick as PIA (who used C1) with lower degradation than him, despite the softer compound! The two were matched again in the third stint when they swapped compounds.
Mercedes appeared far from McL on Day 2 but closer on Day 3. If not for the bad stint on softs, RUS would have looked very close to PIA overall. Mercedes must understand and solve their wear issues on softs (which was present in part on day 2 as well, albeit to a lower degree), but if they do then they should not be far off McLaren.

F1's Race Simulation
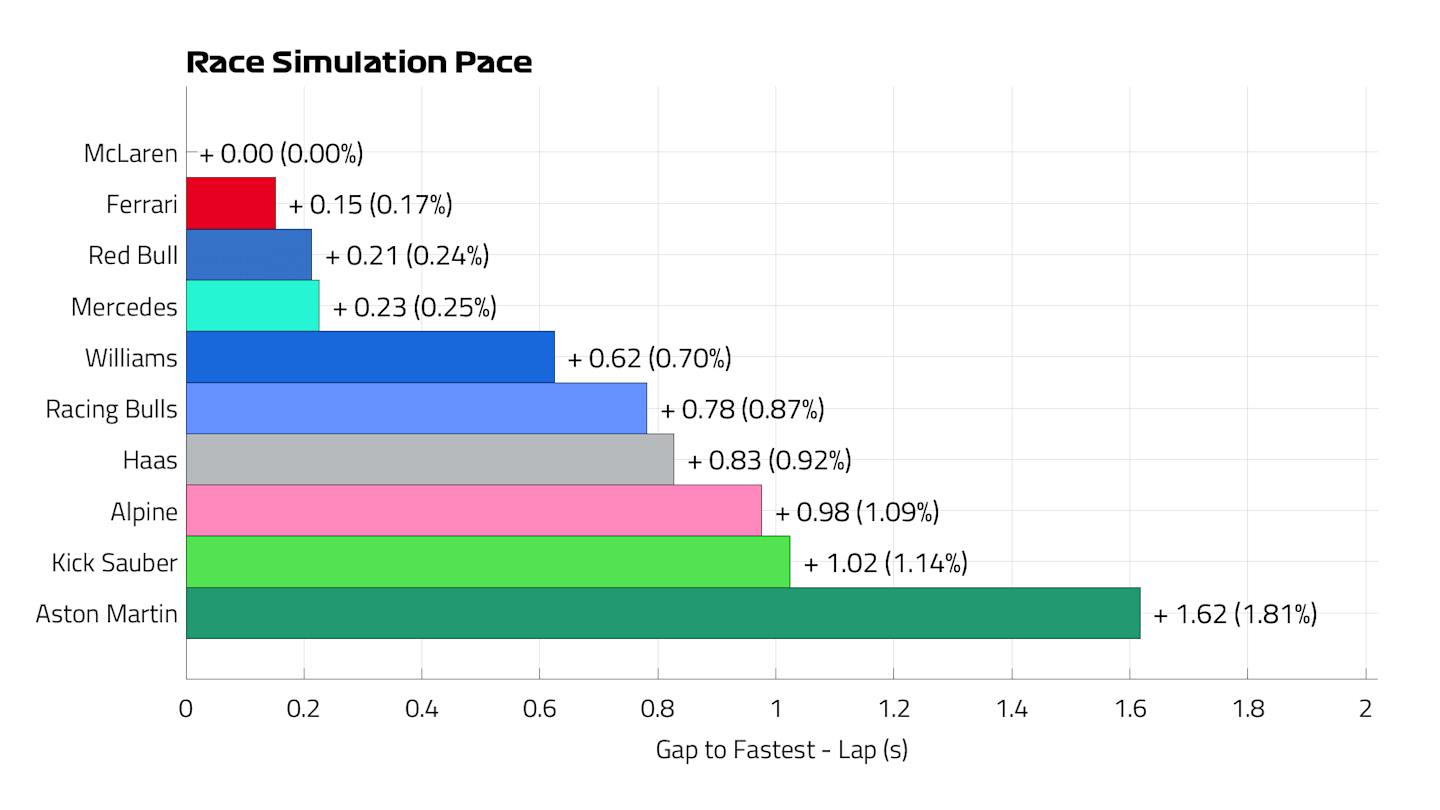
F1 (as I do) expects McL to be quickest in a race, followed by Ferrari (+0.15s/lap), Red Bull (+0.21) and Mercedes (+0.23). Williams would be a distant fifth, followed by Racing Bulls, Haas (thanks to their long-run efforts) and Alpine. Shockingly, they expect Aston to be the slowest, behind even Sauber (I disagree on this: I see no evidence of Aston being 6 tenths behind Sauber on the long runs!)
Pace Last Year
How to read: The upper plot shows the synthesis of each driver's pace during the race. The lower plot shows the (smoothed) evolution through the laps. Each bar contains the central 50% of the distribution: the shorter it is, the more consistent the pace. Inside it, the solid line indicates the MEDIAN (how quick was the TYPICAL lap), while the dashed line indicates the MEAN (how quick was a lap ON AVERAGE). The whiskers include all the laps from a driver which are not uncharacteristically slow for that driver: the lower whisker, in particular, shows that driver's quickest lap. The mean lap time is indicated below each driver's name, and below that is the gap to the quickest driver. The bottom line indicates the tyres used.
VER was the quickest - BY FAR. That's when Red Bull was still the dominant force! Ferrari was the 2nd quickest car, followed by McL and Mercedes (who had equal performance, not too close to SAI's Ferrari). Haas was quicker than Aston, while Sauber was the slowest car. Compared to last year's pecking order, Red Bull seems to have lost the most, while McL and Williams look to have gained the most.

MY PREDICTION
Taking everything into account (single lap pace, long run pace, struggles faced during the tests and likelihood of solving them, power modes used and much more), this is the expected pecking order for the 2025 season (teams on the same line are too close to call):
McLaren
Ferrari, Mercedes
Red Bull (Should be more competitive in the WDC and less so in the WCC. Expect VER to fight with the Ferrari and Mercedes drivers)
Williams, Alpine
Haas, Racing Bulls
Aston
Sauber
Let me know in the comments whether you agree with my conclusion! Thank you for supporting my project for one more year: my main job is very demanding, and your support allows me to devote a lot of time to this side-project. Don't forget to check out the analyses repository, too, to look at all of them!
Can't wait to analyse this season with you!
Mirco / Formula Data Analysis