
Dear F1 Data Analysts,
The 2025 season has officially ended, and with it, this generation of cars. Who, before the summer break, would have guessed that this season-end would have turned into a nail-biter? Even more incredibly, PIA went from leading the championship by a huge margin to finishing P3 in the WDC. NOR took a deserved title, but VER had the best season overall, recovering a significant gap through hard work session after session. McL stopped developing their car early in the season, a decision which made perfect sense at the time: they could not expect RBR to be able to solve their issues so decisively! Still, many strategic and sporting mistakes that McL made could be prevented; something to work on for the next season (although the outcome was not impacted in the end: WCC and WDC in the bag). Let's take a look at the data for one last time.
You will find all the analyses through this link
Starting Grid and Results
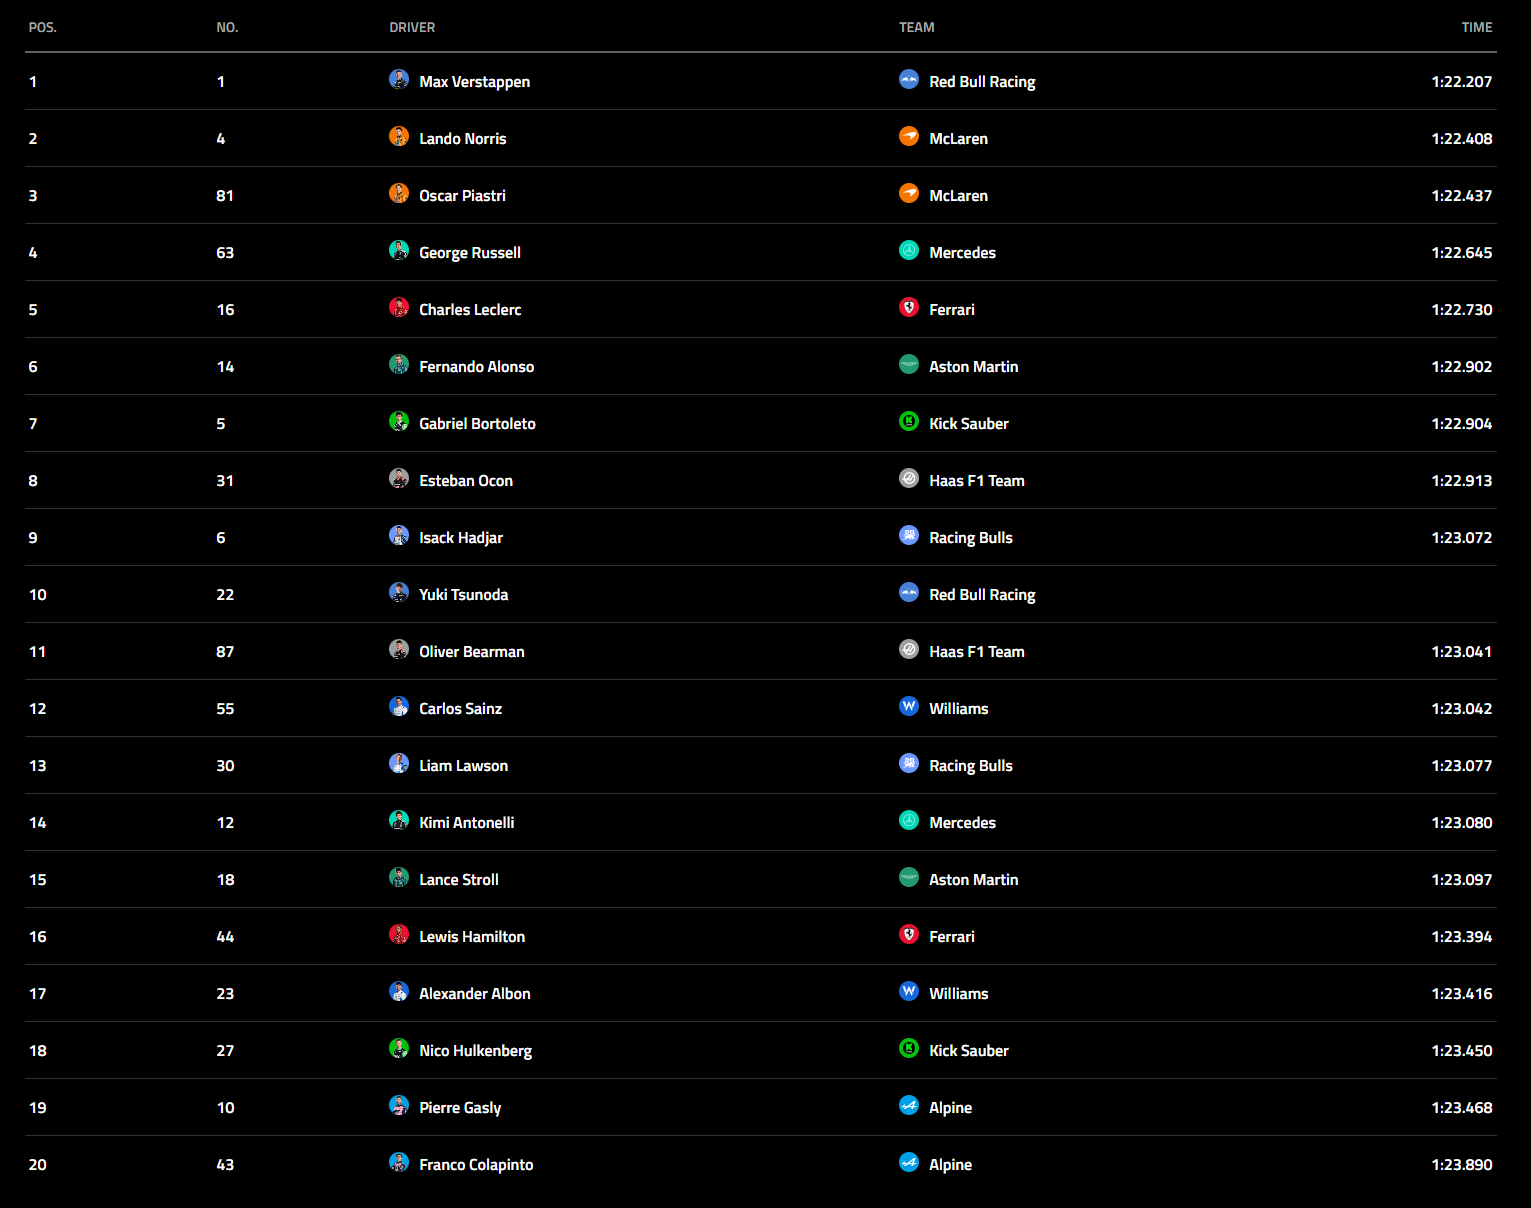
Here is a quick look at the starting grid to provide context for the results:
VER was starting on pole, after beating NOR by 2-tenths. PIA, the underdog, was starting right behind the other two. RUS and LEC were the main threats to NOR, as they could impact the WDC by overtaking NOR. ALO started on the third row after a fantastic quali session. BOR and OCO followed, set for a strong race. HAD will take TSU's seat next year, and beat him in qualifying: the two rounded off the top 10.
ANT and HAM had a negative quali session; HAM was the first Ferrari driver ever not to access Q2 for a third consecutive time. The Englishman was determined to finish his season on a more positive note, trying to recover as many places as possible.
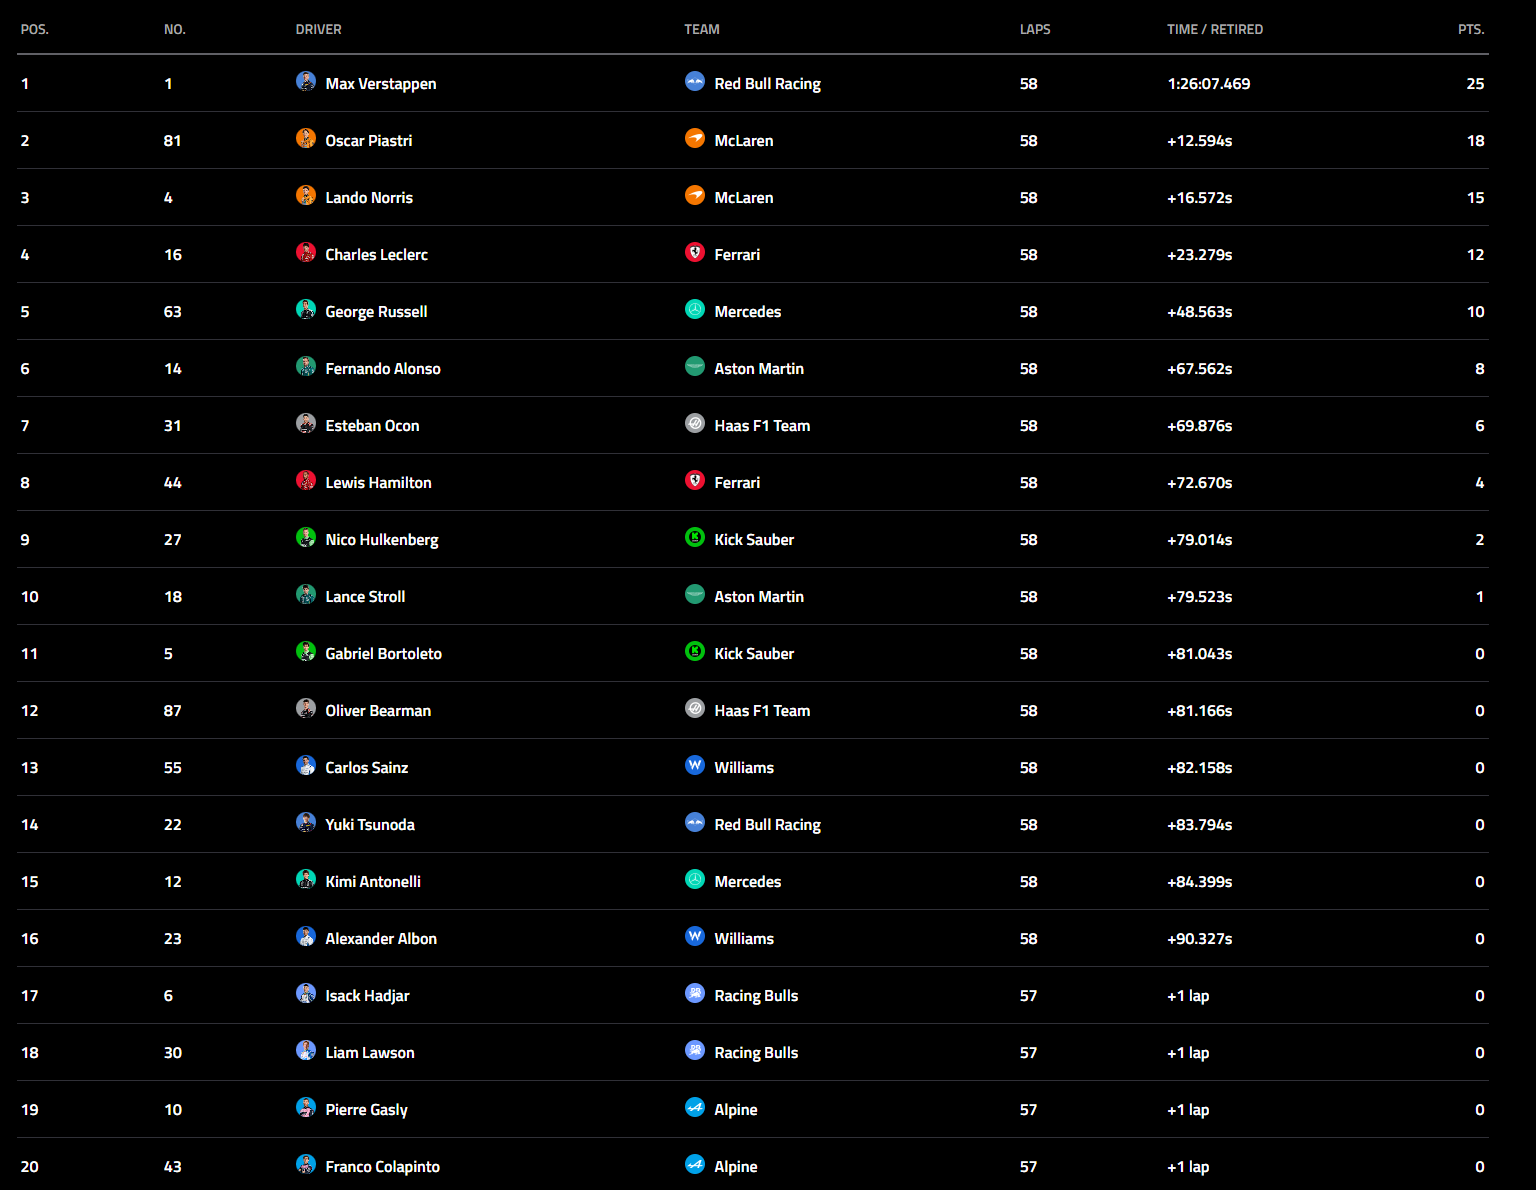
 Below is the final classification:
VER won the race: the maximum result he could aim for. It wasn't enough for the title, as NOR did succeed in finishing in the top 4: he fended off LEC well and finished the race on the podium. Still, on the very last race, McL could not match VER's pace. LEC's pace was strong, setting the fastest lap of the race on L45. HAM had a very good race too: he recovered 8 places and finished P8; overall, as a Ferrari fan, I was satisfied by this result, although Ferrari's season was extremely disappointing (they fought for the WCC here last year!). ALO and OCO got some heavy points, while HUL and STR completed the top 10. No points for Williams, Racing Bulls, and Alpine.
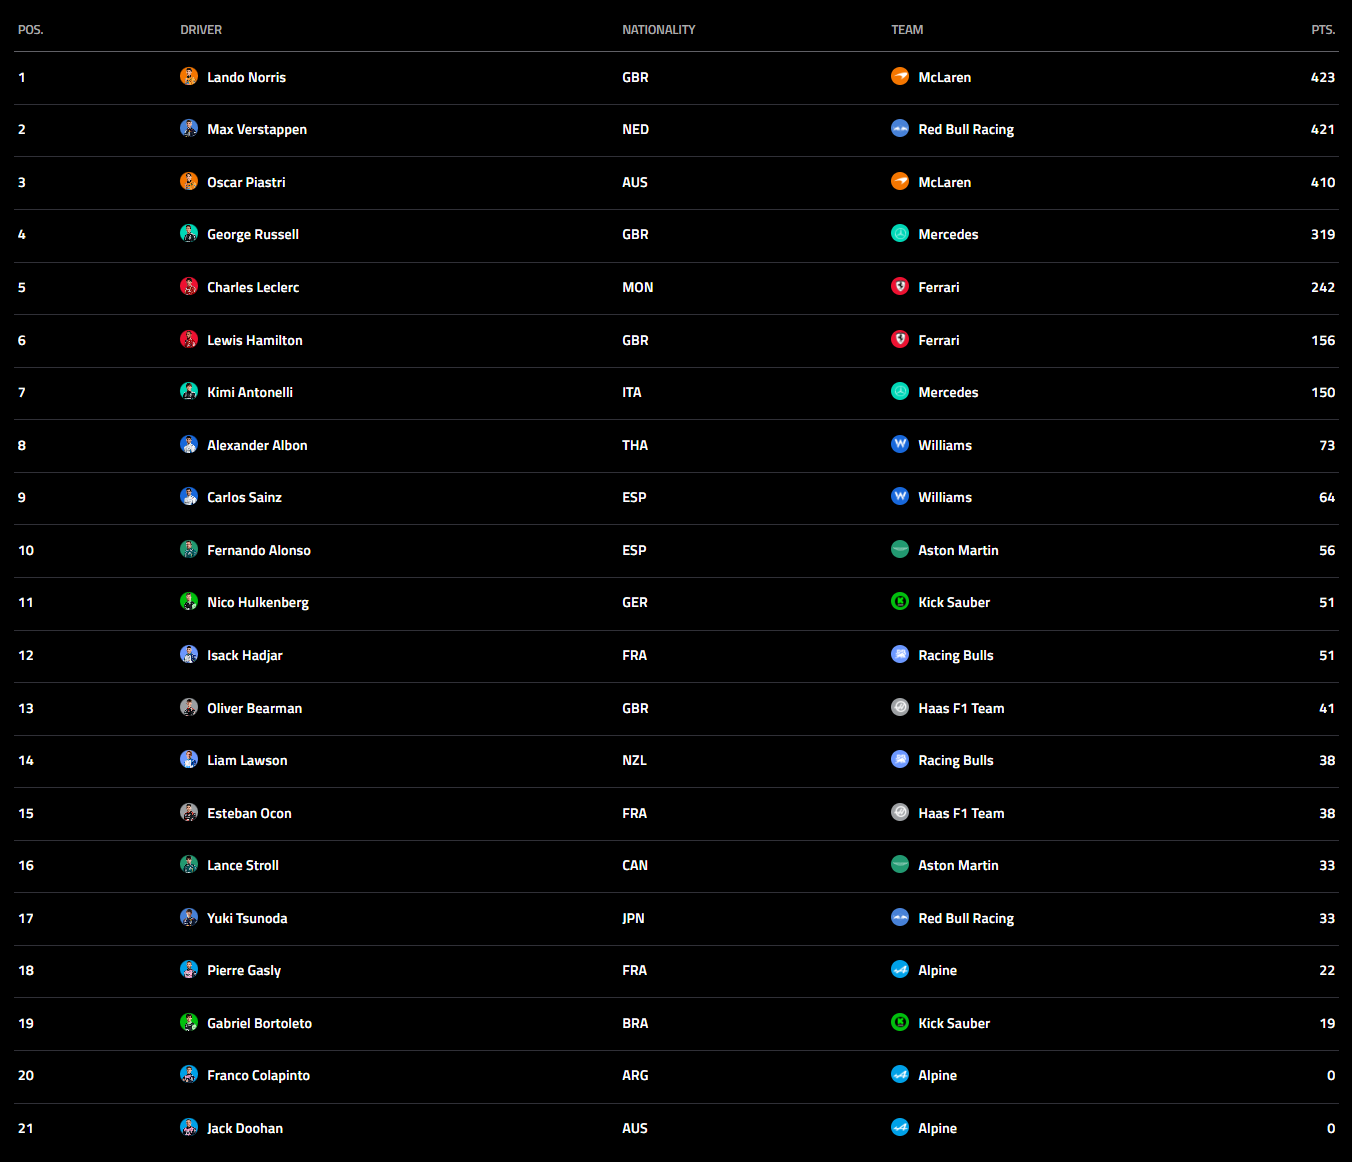
 Final WDC points:
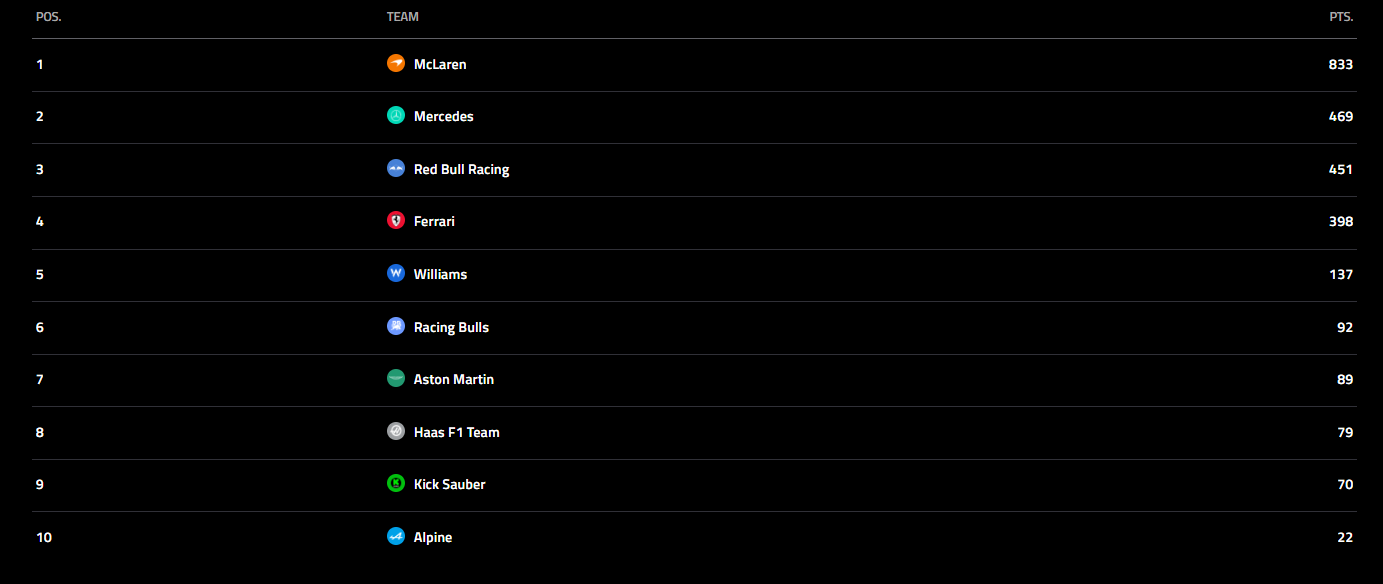
NOR won by just 2 points, and the top 3 were separated by just 13 points: the closest season since 2012! RUS had a solid season, finishing P4 and racking up over 300 points (over twice those of his teammate). HAM still has more points than ANT, although LEC had a far better season. ALB and SAI were best-of-the-rest. Two Alpine drivers were the only ones not to score any points!
 McL scored over 800pts! Mercedes narrowly beat RBR to P2, while Ferrari went from almost winning the WCC last year to P4. Williams was best-of-the-rest, in front of RBs. Alpine scored just 22 points, less than one per race!
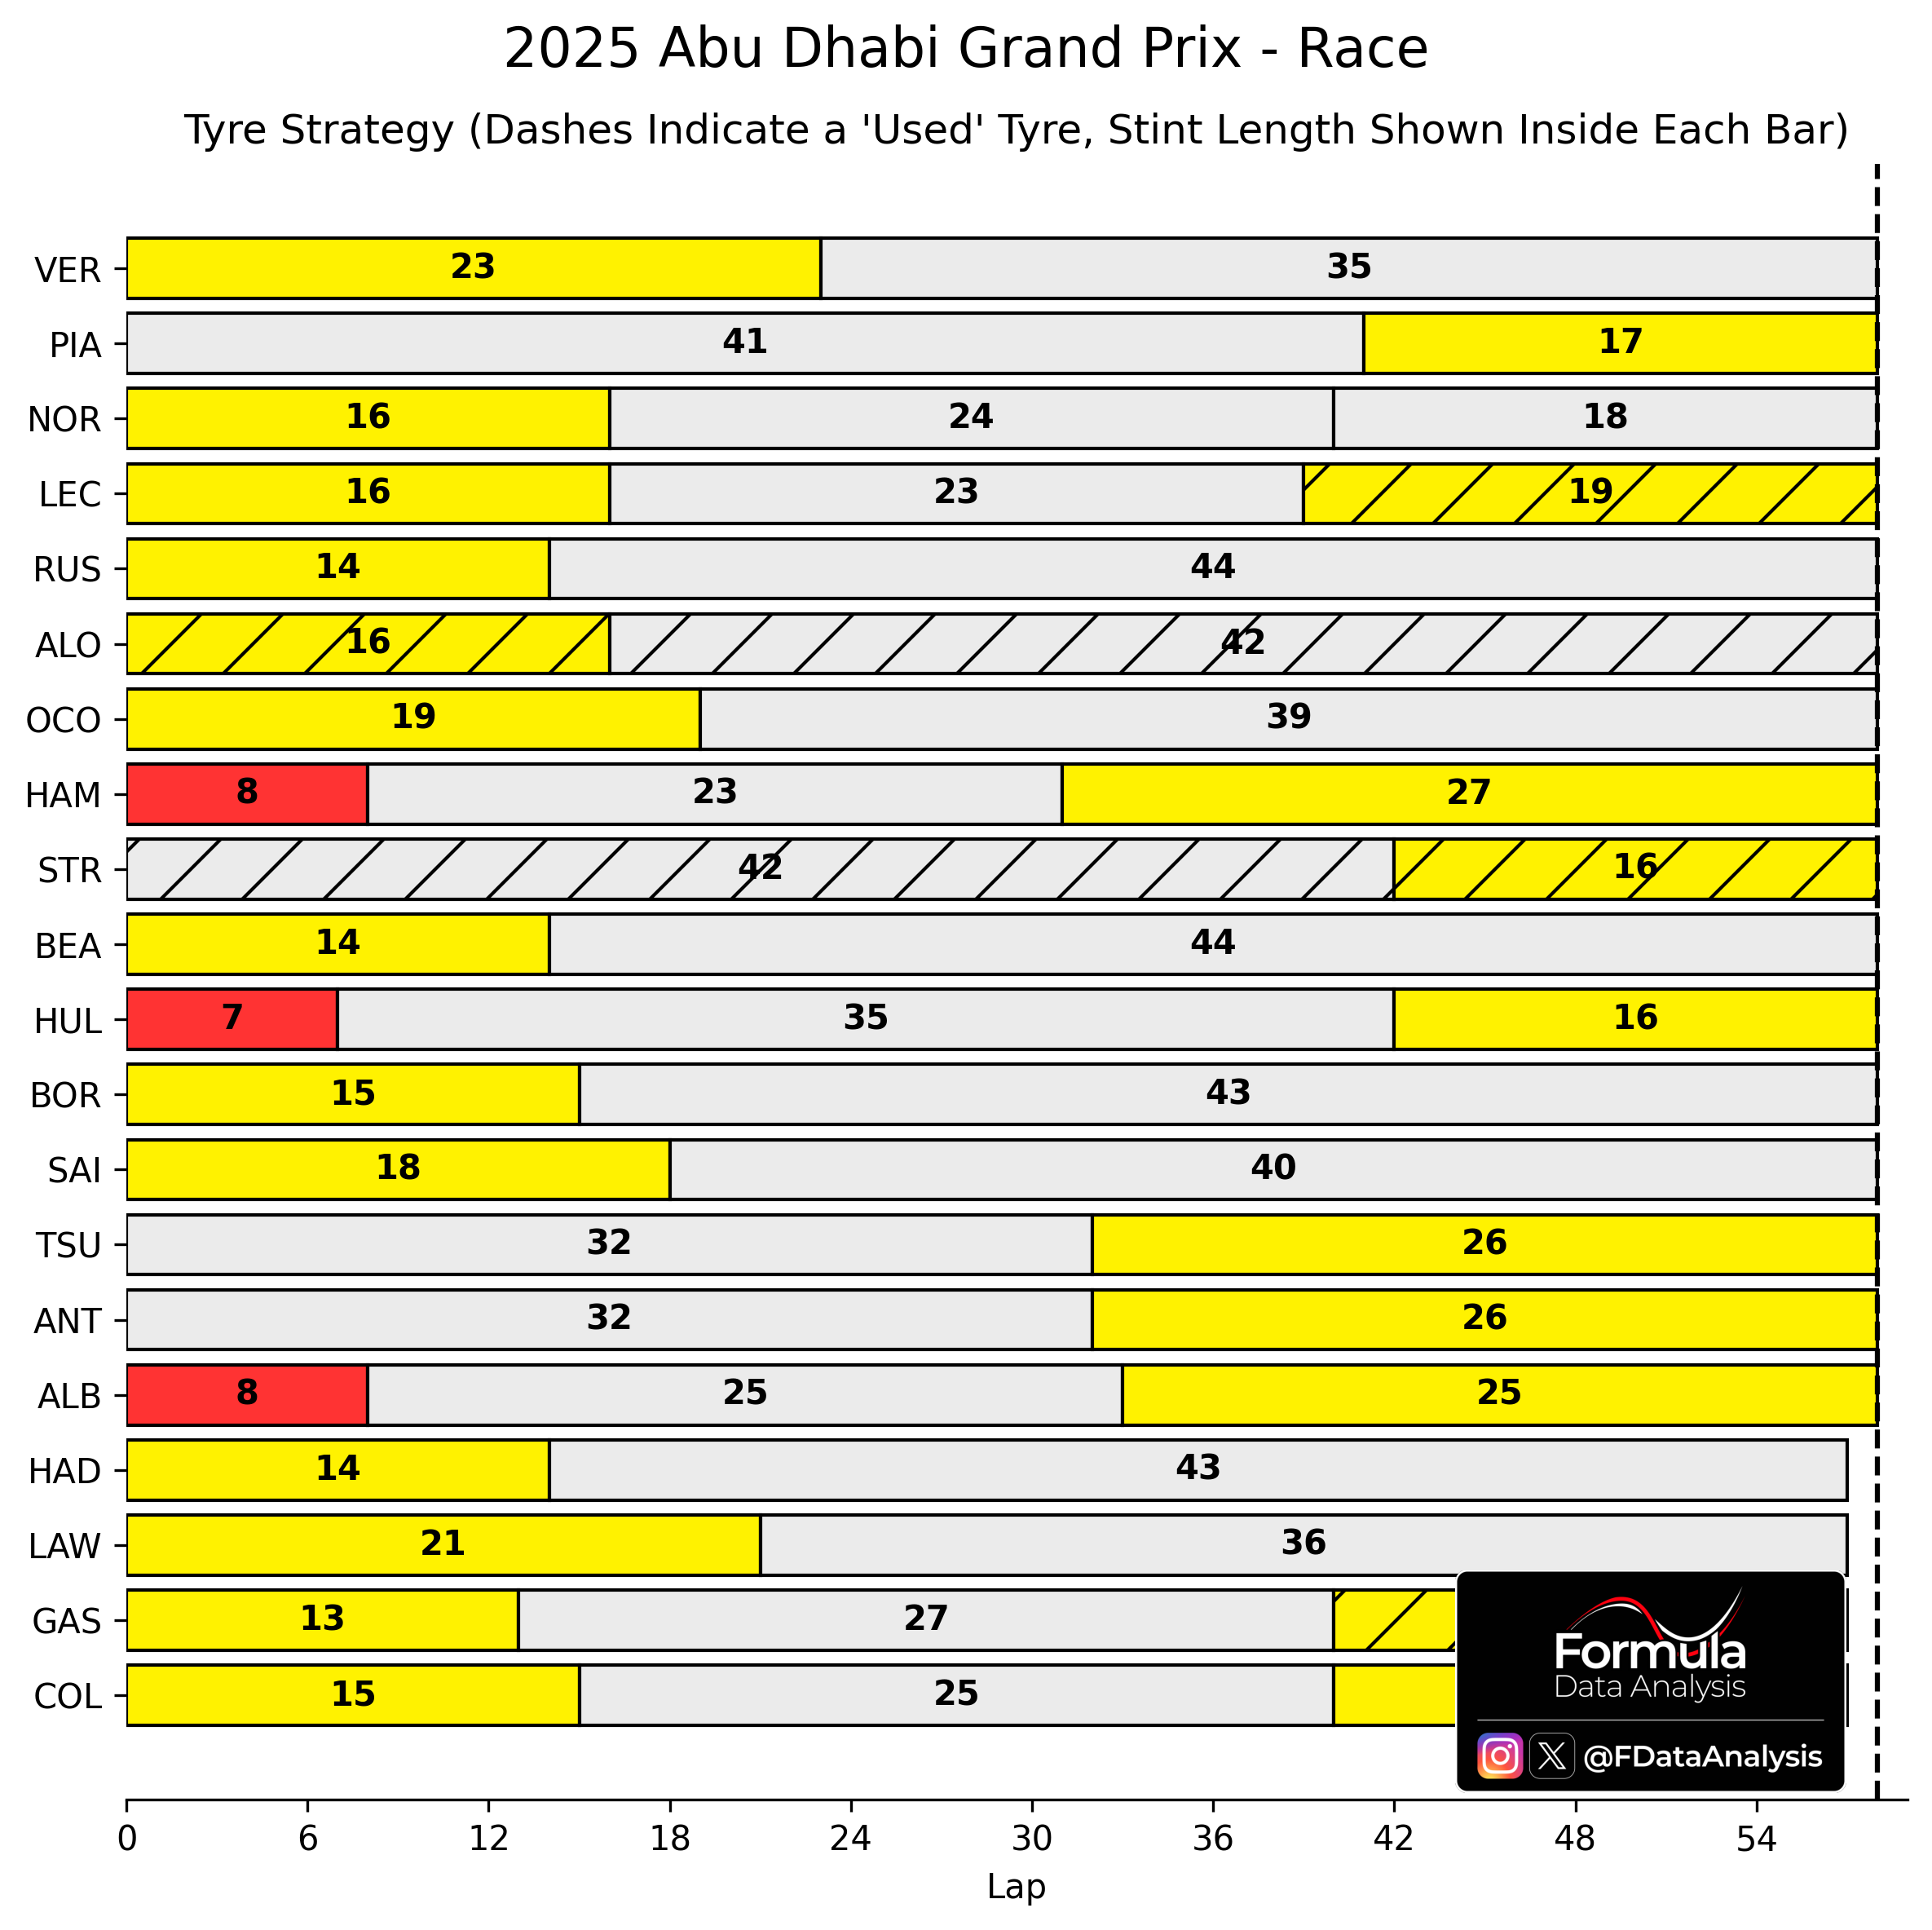
 Tyres Used and Strategy
How to read: Each bar represents a distinct stint. The number inside the bar indicates the total number of laps driven on that compound. A dashed bar indicates that the tyre set was used.
Most of the front-runners started on Mediums, except for PIA on Hards. HAM, HUL, and ALB started on Softs, trying to make up places in the first few laps. RUS pitted on L14, starting the pit stop domino: LEC and NOR pitted 2 laps afterwards, while VER's strong pace allowed him to delay that moment until L23. PIA pitted after 41 laps, mirroring VER's strategy. The top 2 finishers did a one-stopper, while NOR and LEC stopped twice.
BOR and HAD did 43 laps on Hards! HAM, instead, did the longest (27 laps) Medium stint.
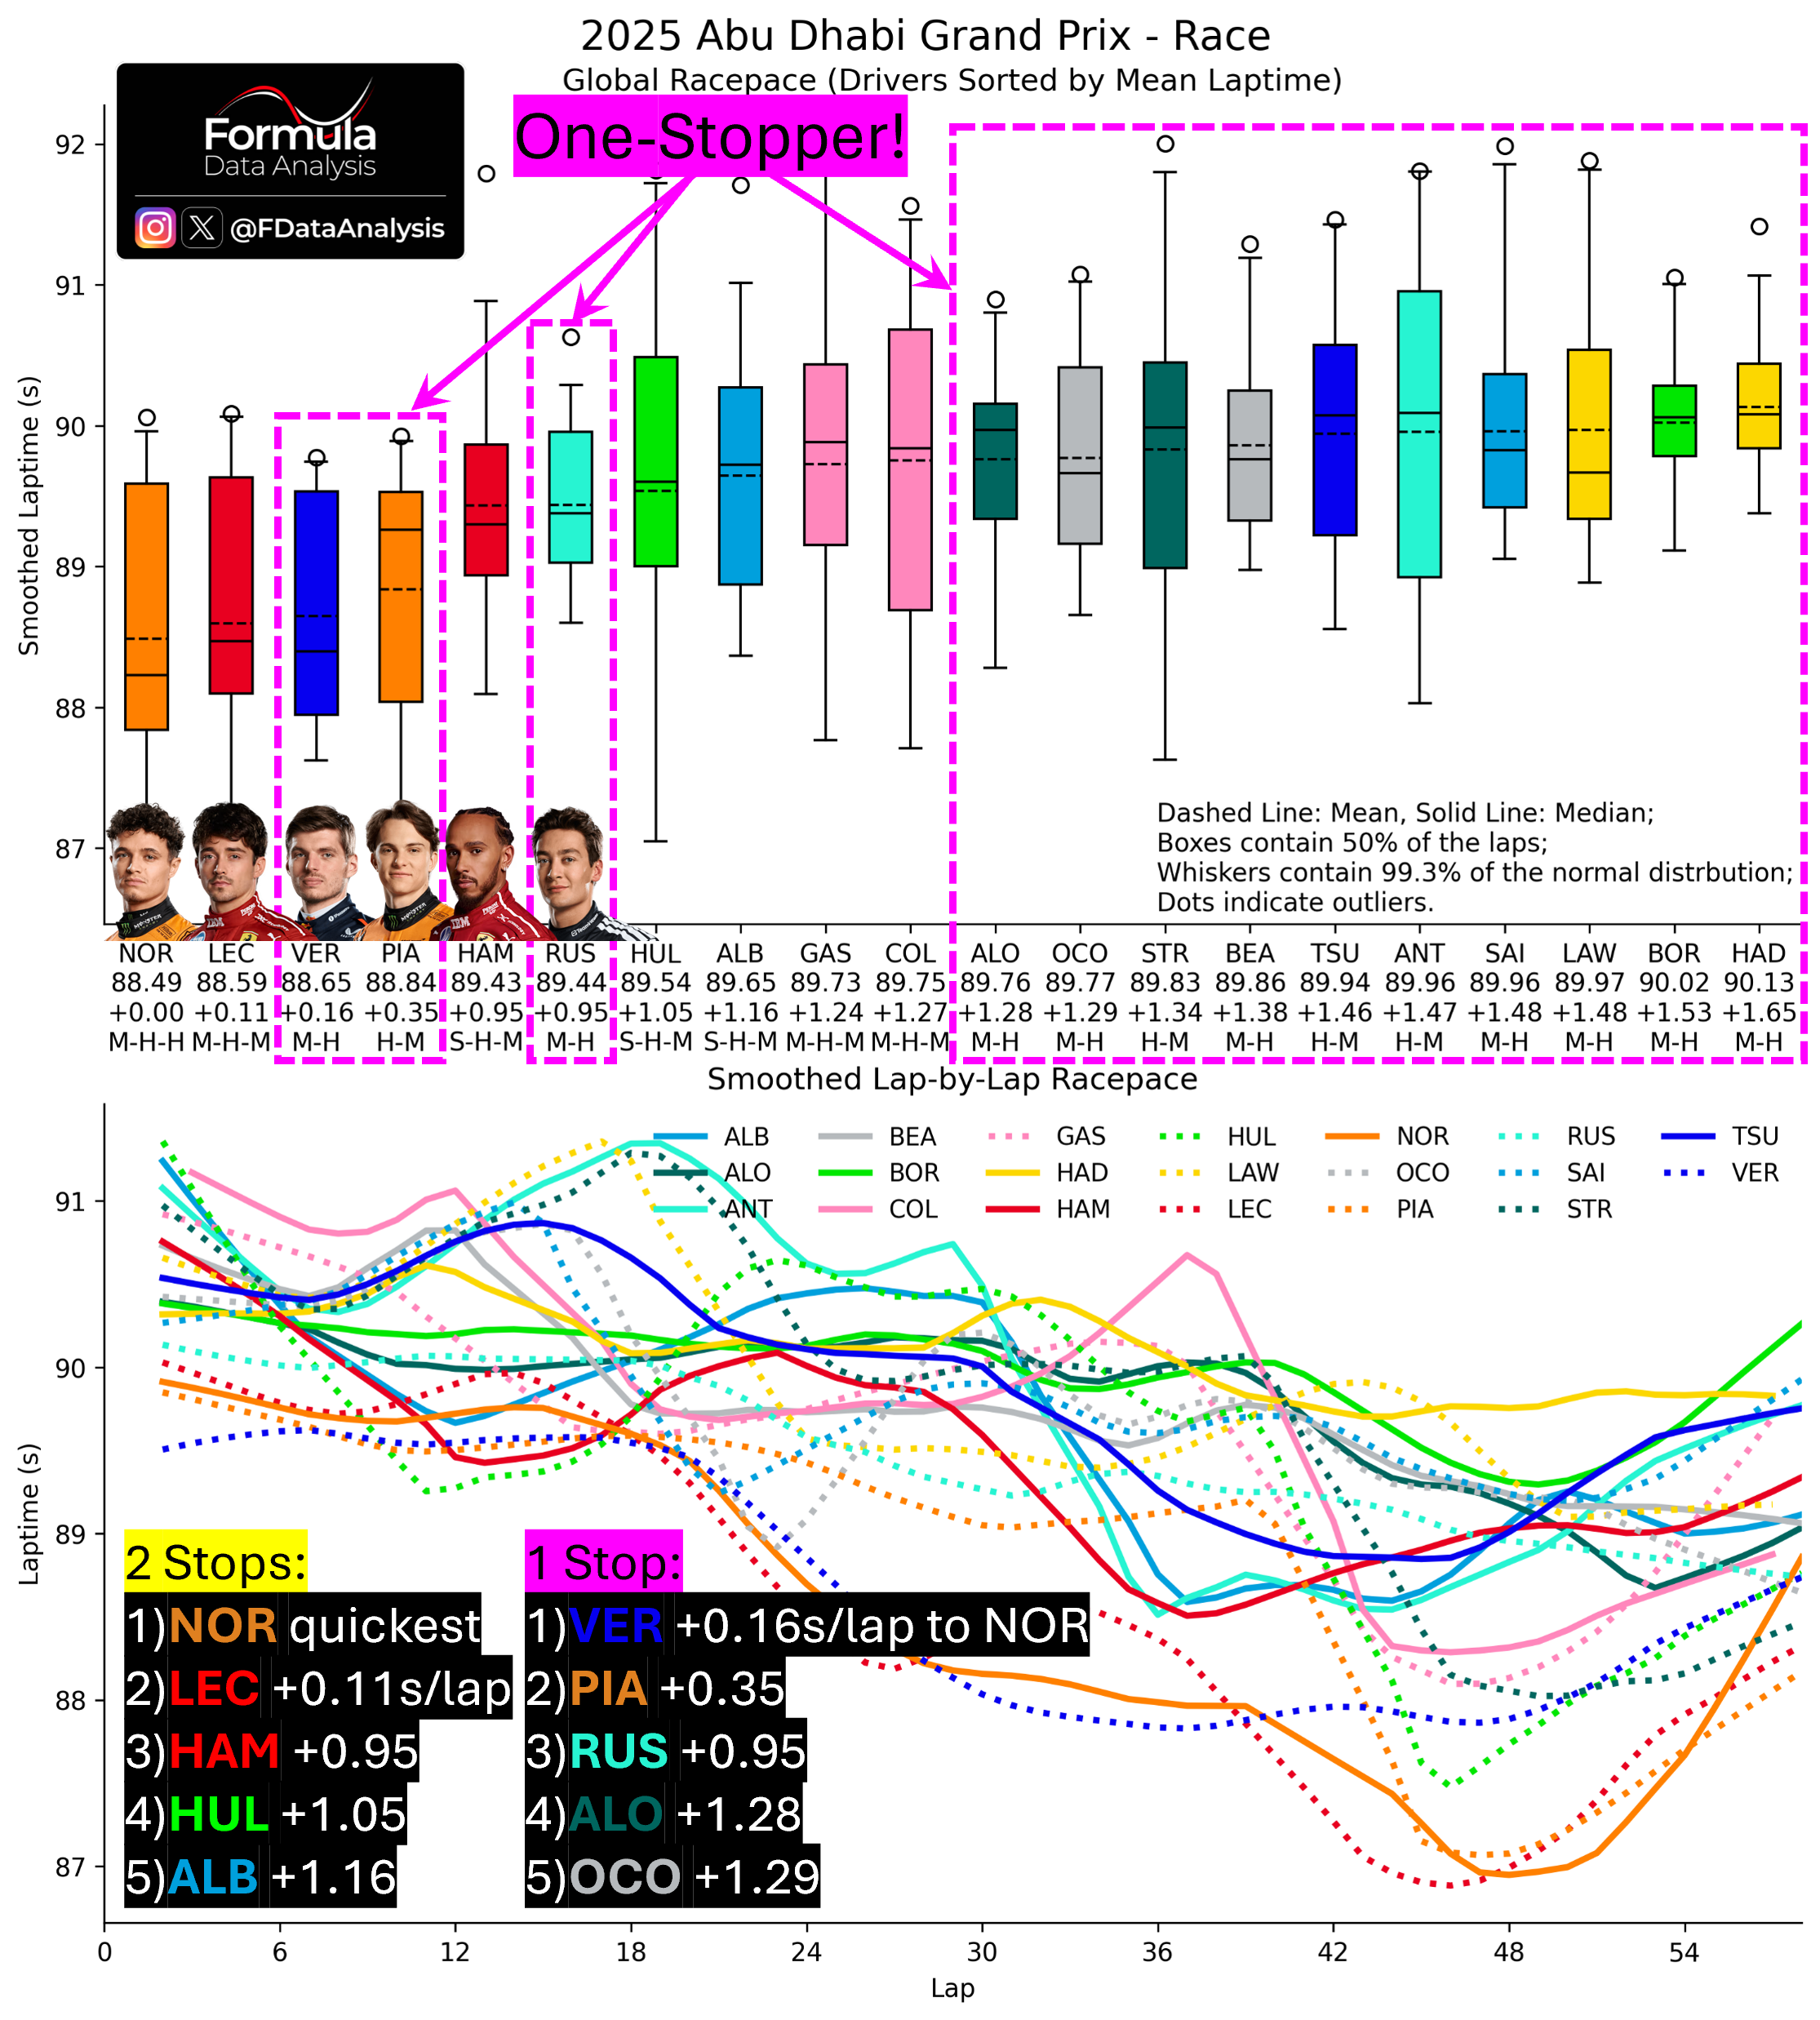
 Race Pace
How to read: The upper plot shows the synthesis of each driver's pace during the race. The lower plot shows the (smoothed) evolution through the laps. Each bar contains the central 50% of the distribution: the shorter, the more consistent the pace. Inside it, the solid line indicates the MEDIAN (how quick was the TYPICAL lap), while the dashed line indicates the MEAN (how quick was a lap ON AVERAGE). The whiskers include all the laps from a driver which are not uncharacteristically slow for that driver: the lower whisker, in particular, shows that driver's quickest lap. The mean lap time is indicated below each driver's name, and below is the gap to the quickest driver. The bottom line indicates the tyres used: only compare directly drivers who did the same number of pit stops, as using more tyre sets makes one faster on average, at the expense of more total time being lost in the pits.
NOR was quickest overall, aided by the two-stopper. VER, however, was within 2 tenths off his pace on average: enough to offset the time he saved by pitting just once. LEC was quick, although aided by the two-stopper. Mercedes had no pace, especially ANT, who was stuck in traffic for a long time.
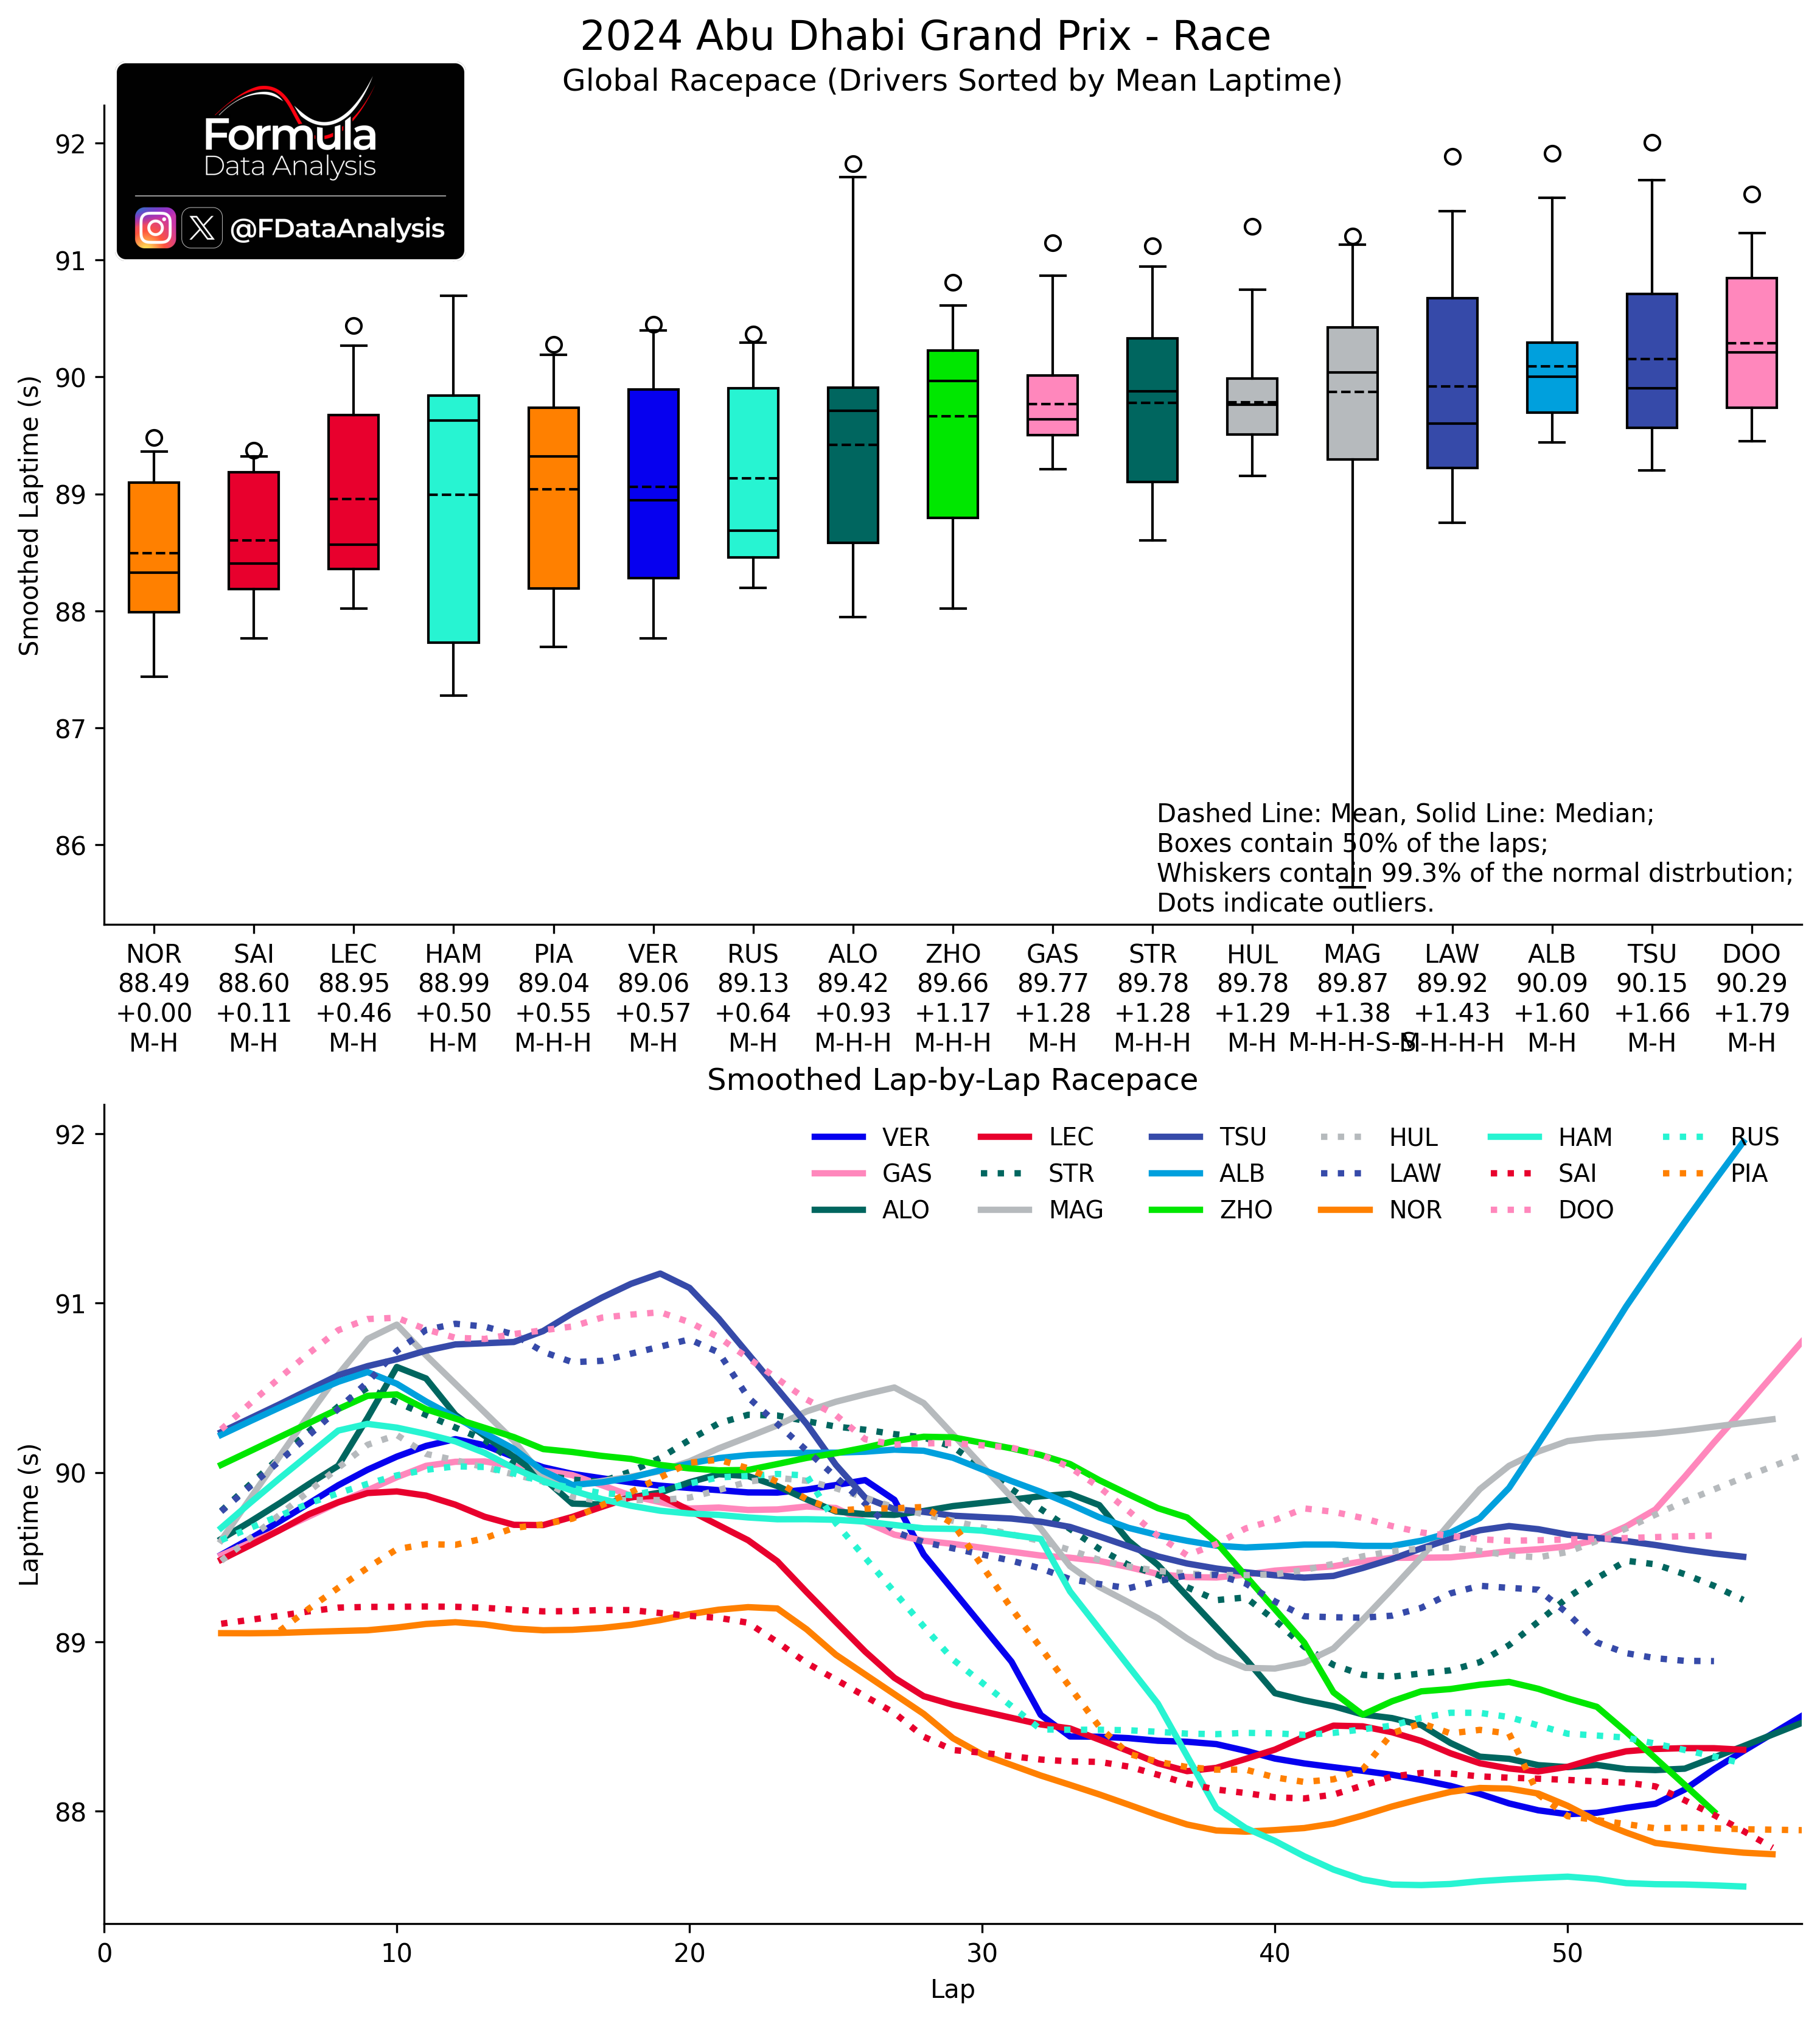
 Last year's race pace, for comparison:
Ferrari was in a way better position, while VER was nowhere. RBR was the 4th best car! (Behind Mercedes).
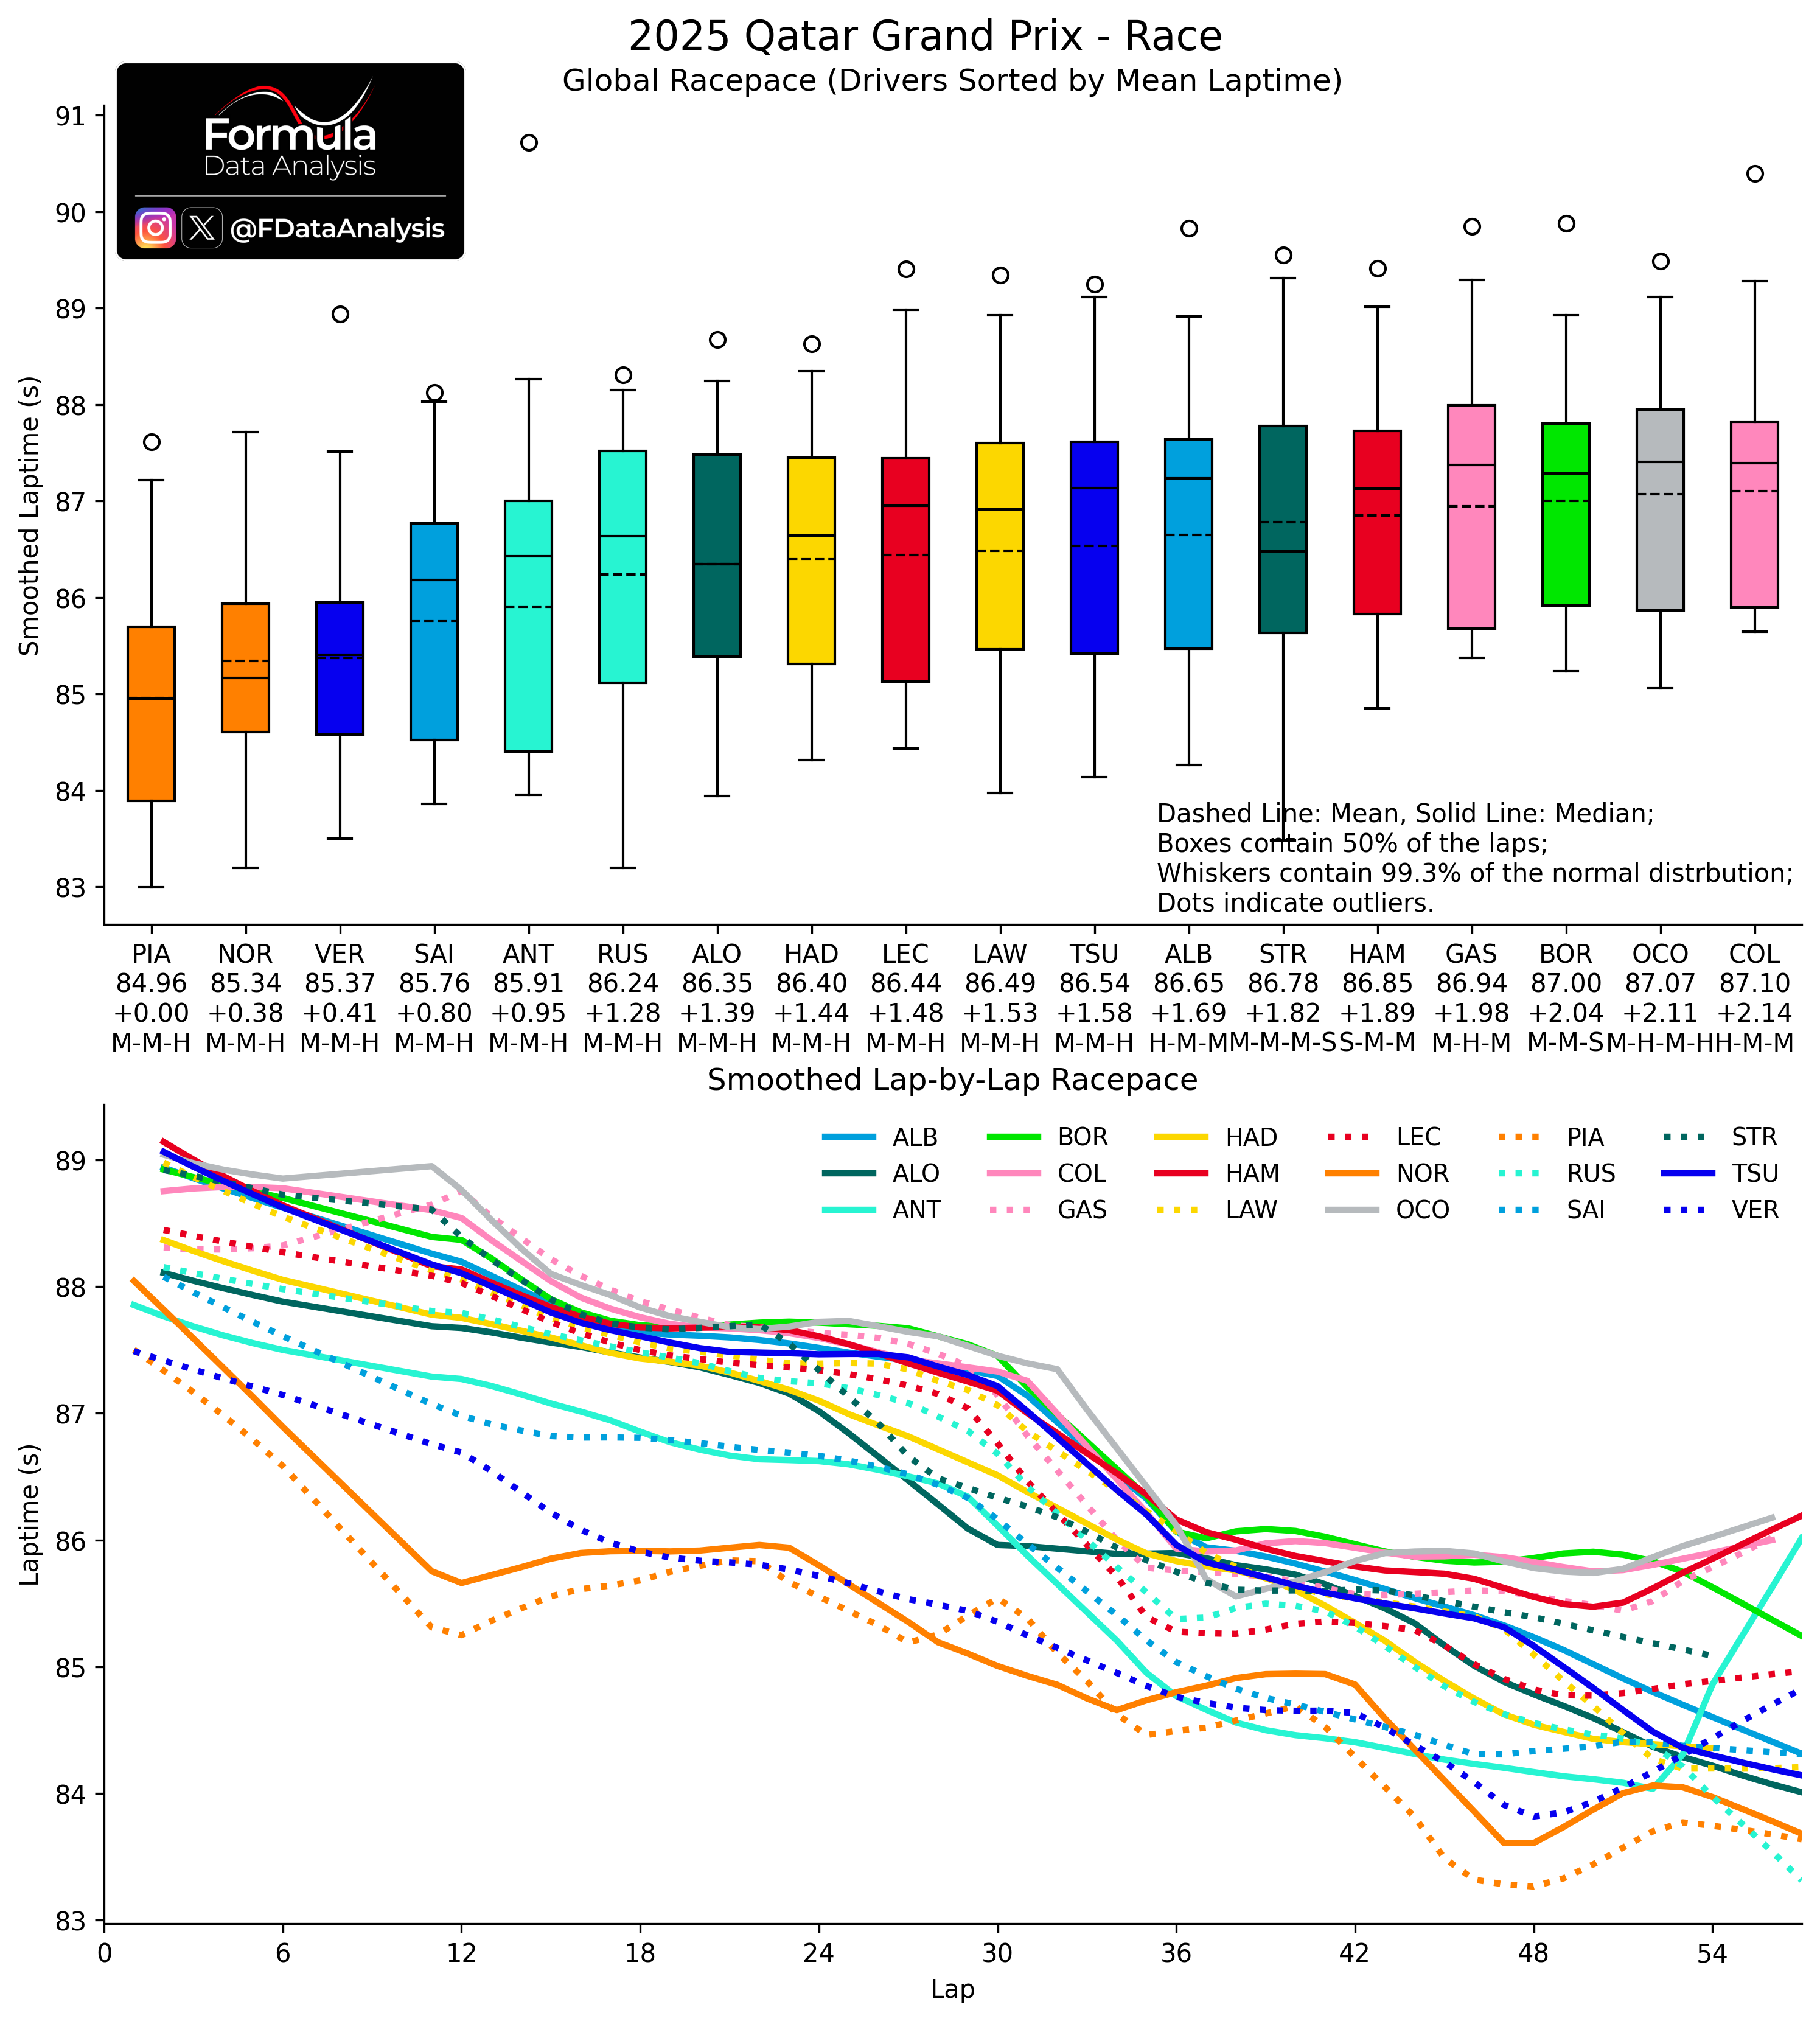
 Race pace in the last race was, for comparison:
Race impacted by McL's suicidal strategy, handing the win to VER despite his way worse race pace. Good recovery from Ferrari, going from Qatar to Abu Dhabi.
 Top Speeds
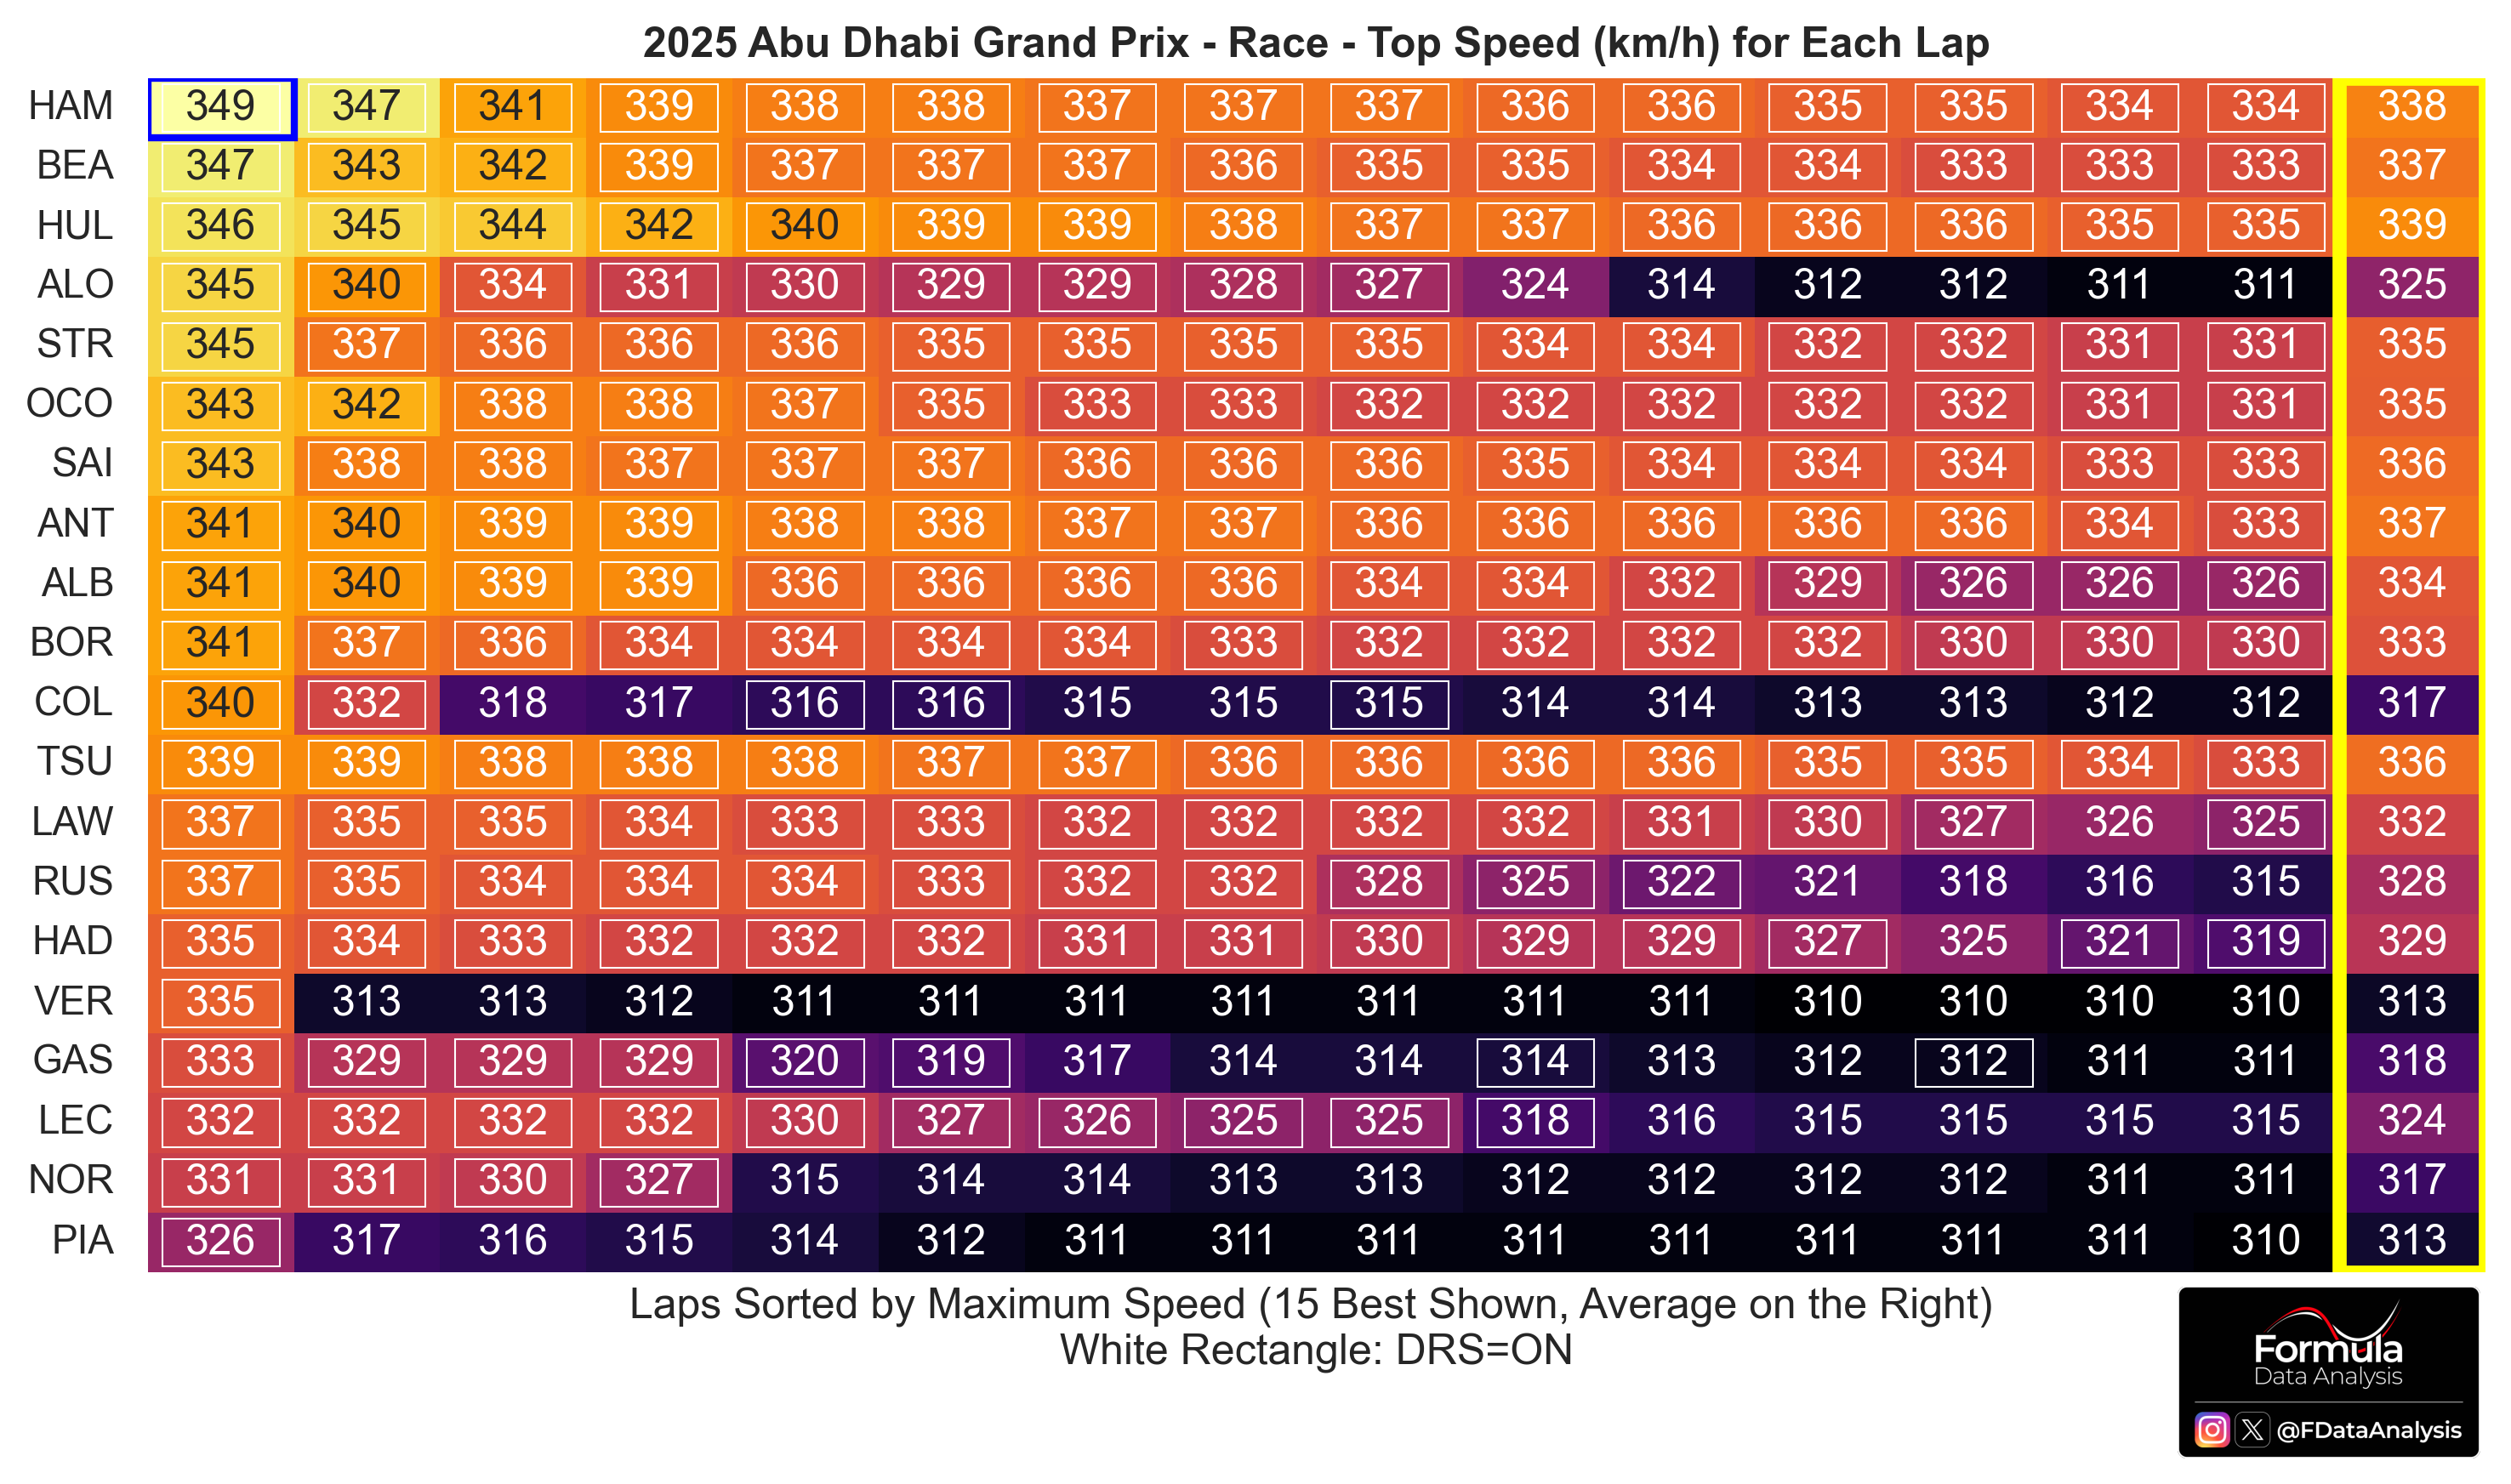
How to read: The chart shows the highest top speed values reached by each driver during the race. The drivers are sorted in descending order of highest to lowest top speed. For a given driver, the top speeds in each lap are sorted from highest (left) to lowest (right): the highest 15 values are shown. The column on the right shows the average of these 15 values. A white box surrounds the values relative to DRS being active.
HAM and BEA, as has often been the case this season, topped the speed traps charts. All drivers finished the race and used the DRS at least once; notice that VER reached just 313km/h without DRS!
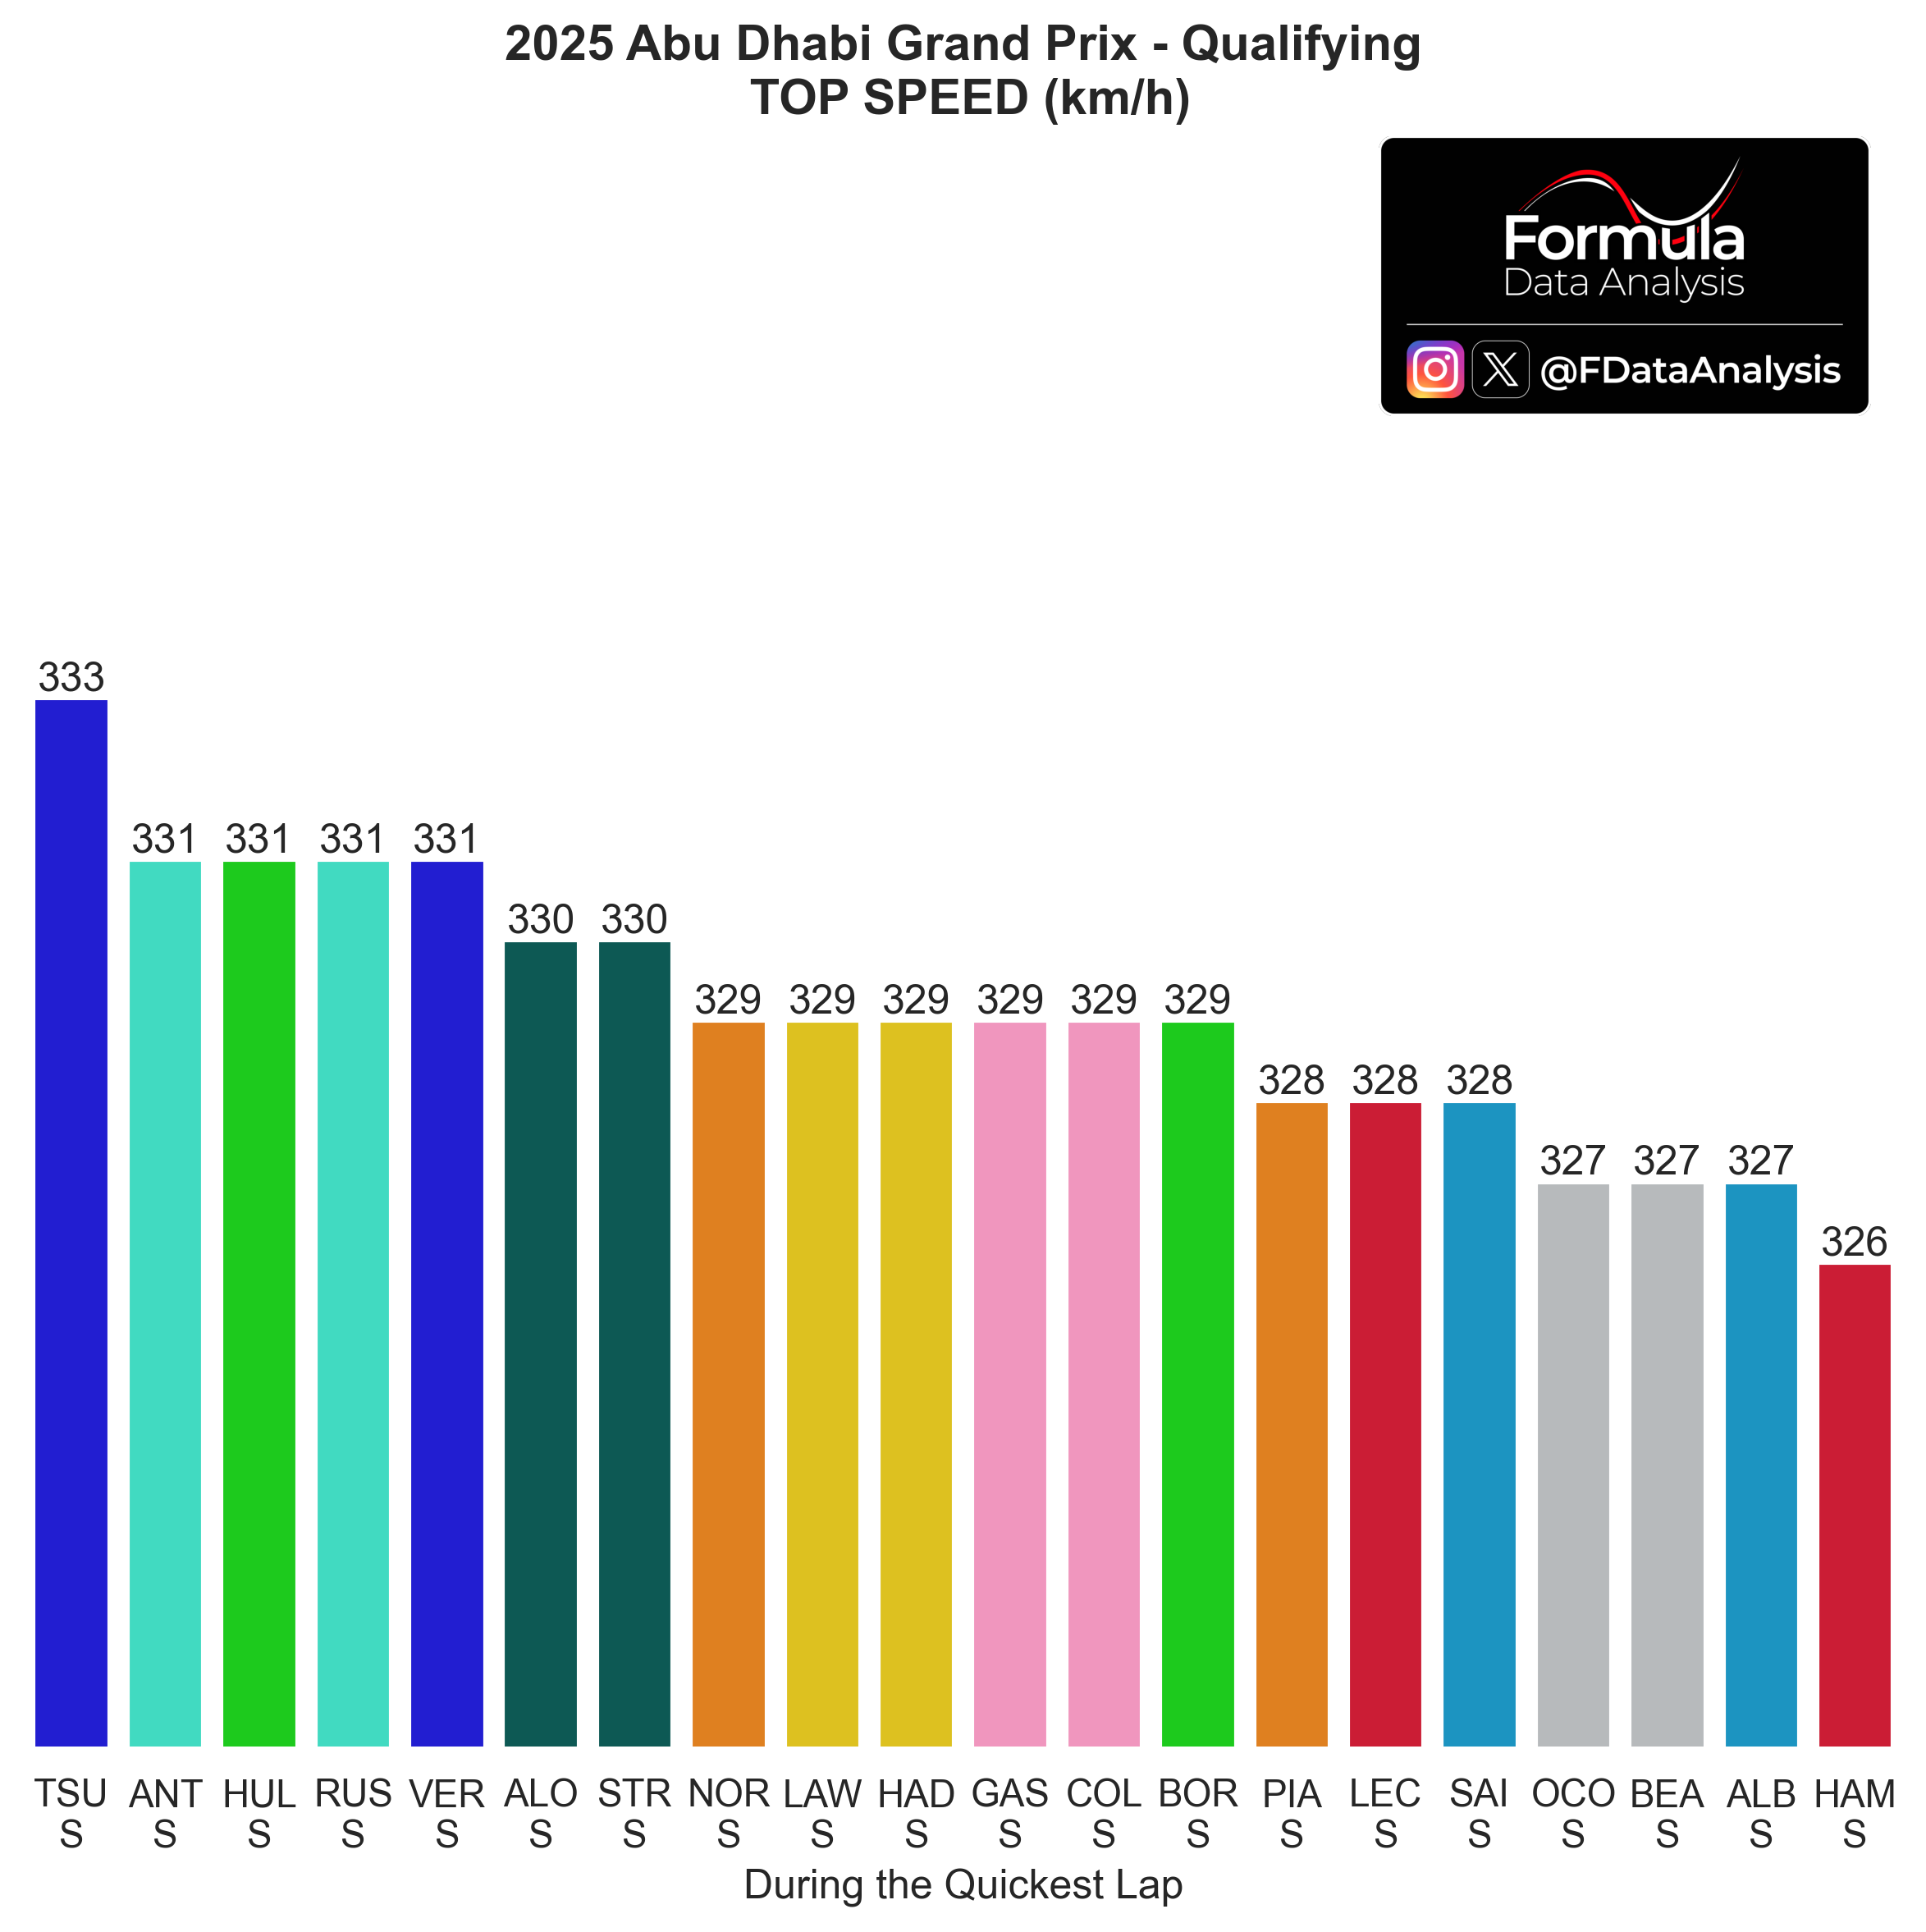
 Top speed in qualifying (below) provides a portrait of each team's drag, which is less impacted by the outside circumstances (e.g. the fact that the driver was in traffic or not for most of the race):
HAM had the worst top speed in quali, and the best one in the race: that's the effect of being stuck in traffic!
 Overall Compound Performance
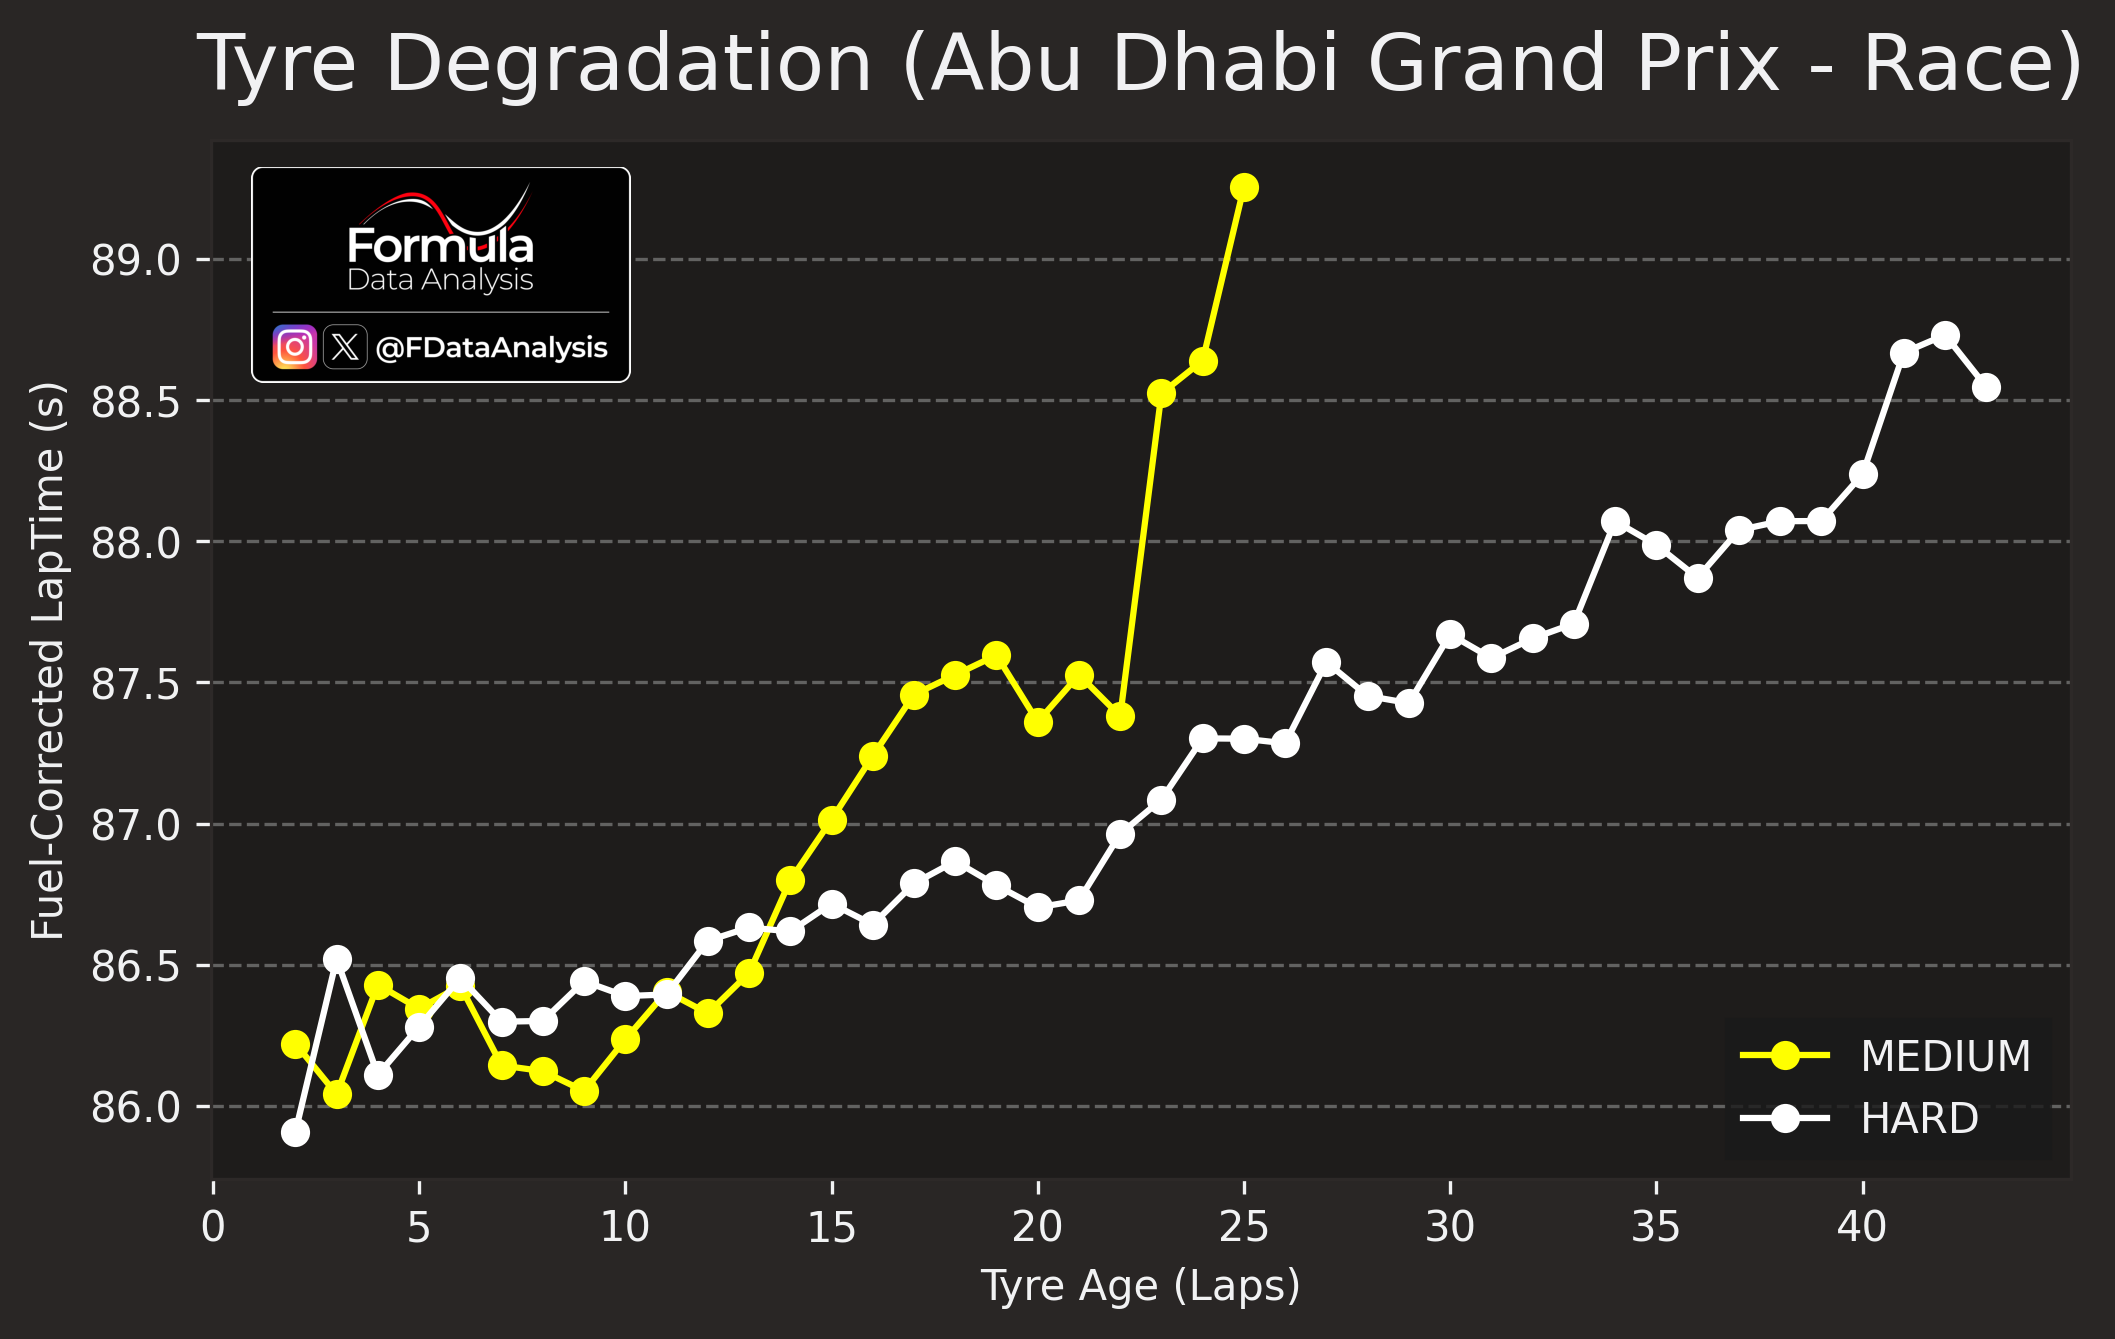
How to read: the chart shows the fuel-corrected lap time produced on each tyre compound at a given 'tyre age'. It is produced by taking the fastest lap for a given tyre age when at least 3 drivers reached that tyre age.
Hards offered the best performance, end of the discussion. Almost as quick as Mediums in the first 13 laps, but way better degradation afterwards.
 Pit Stops
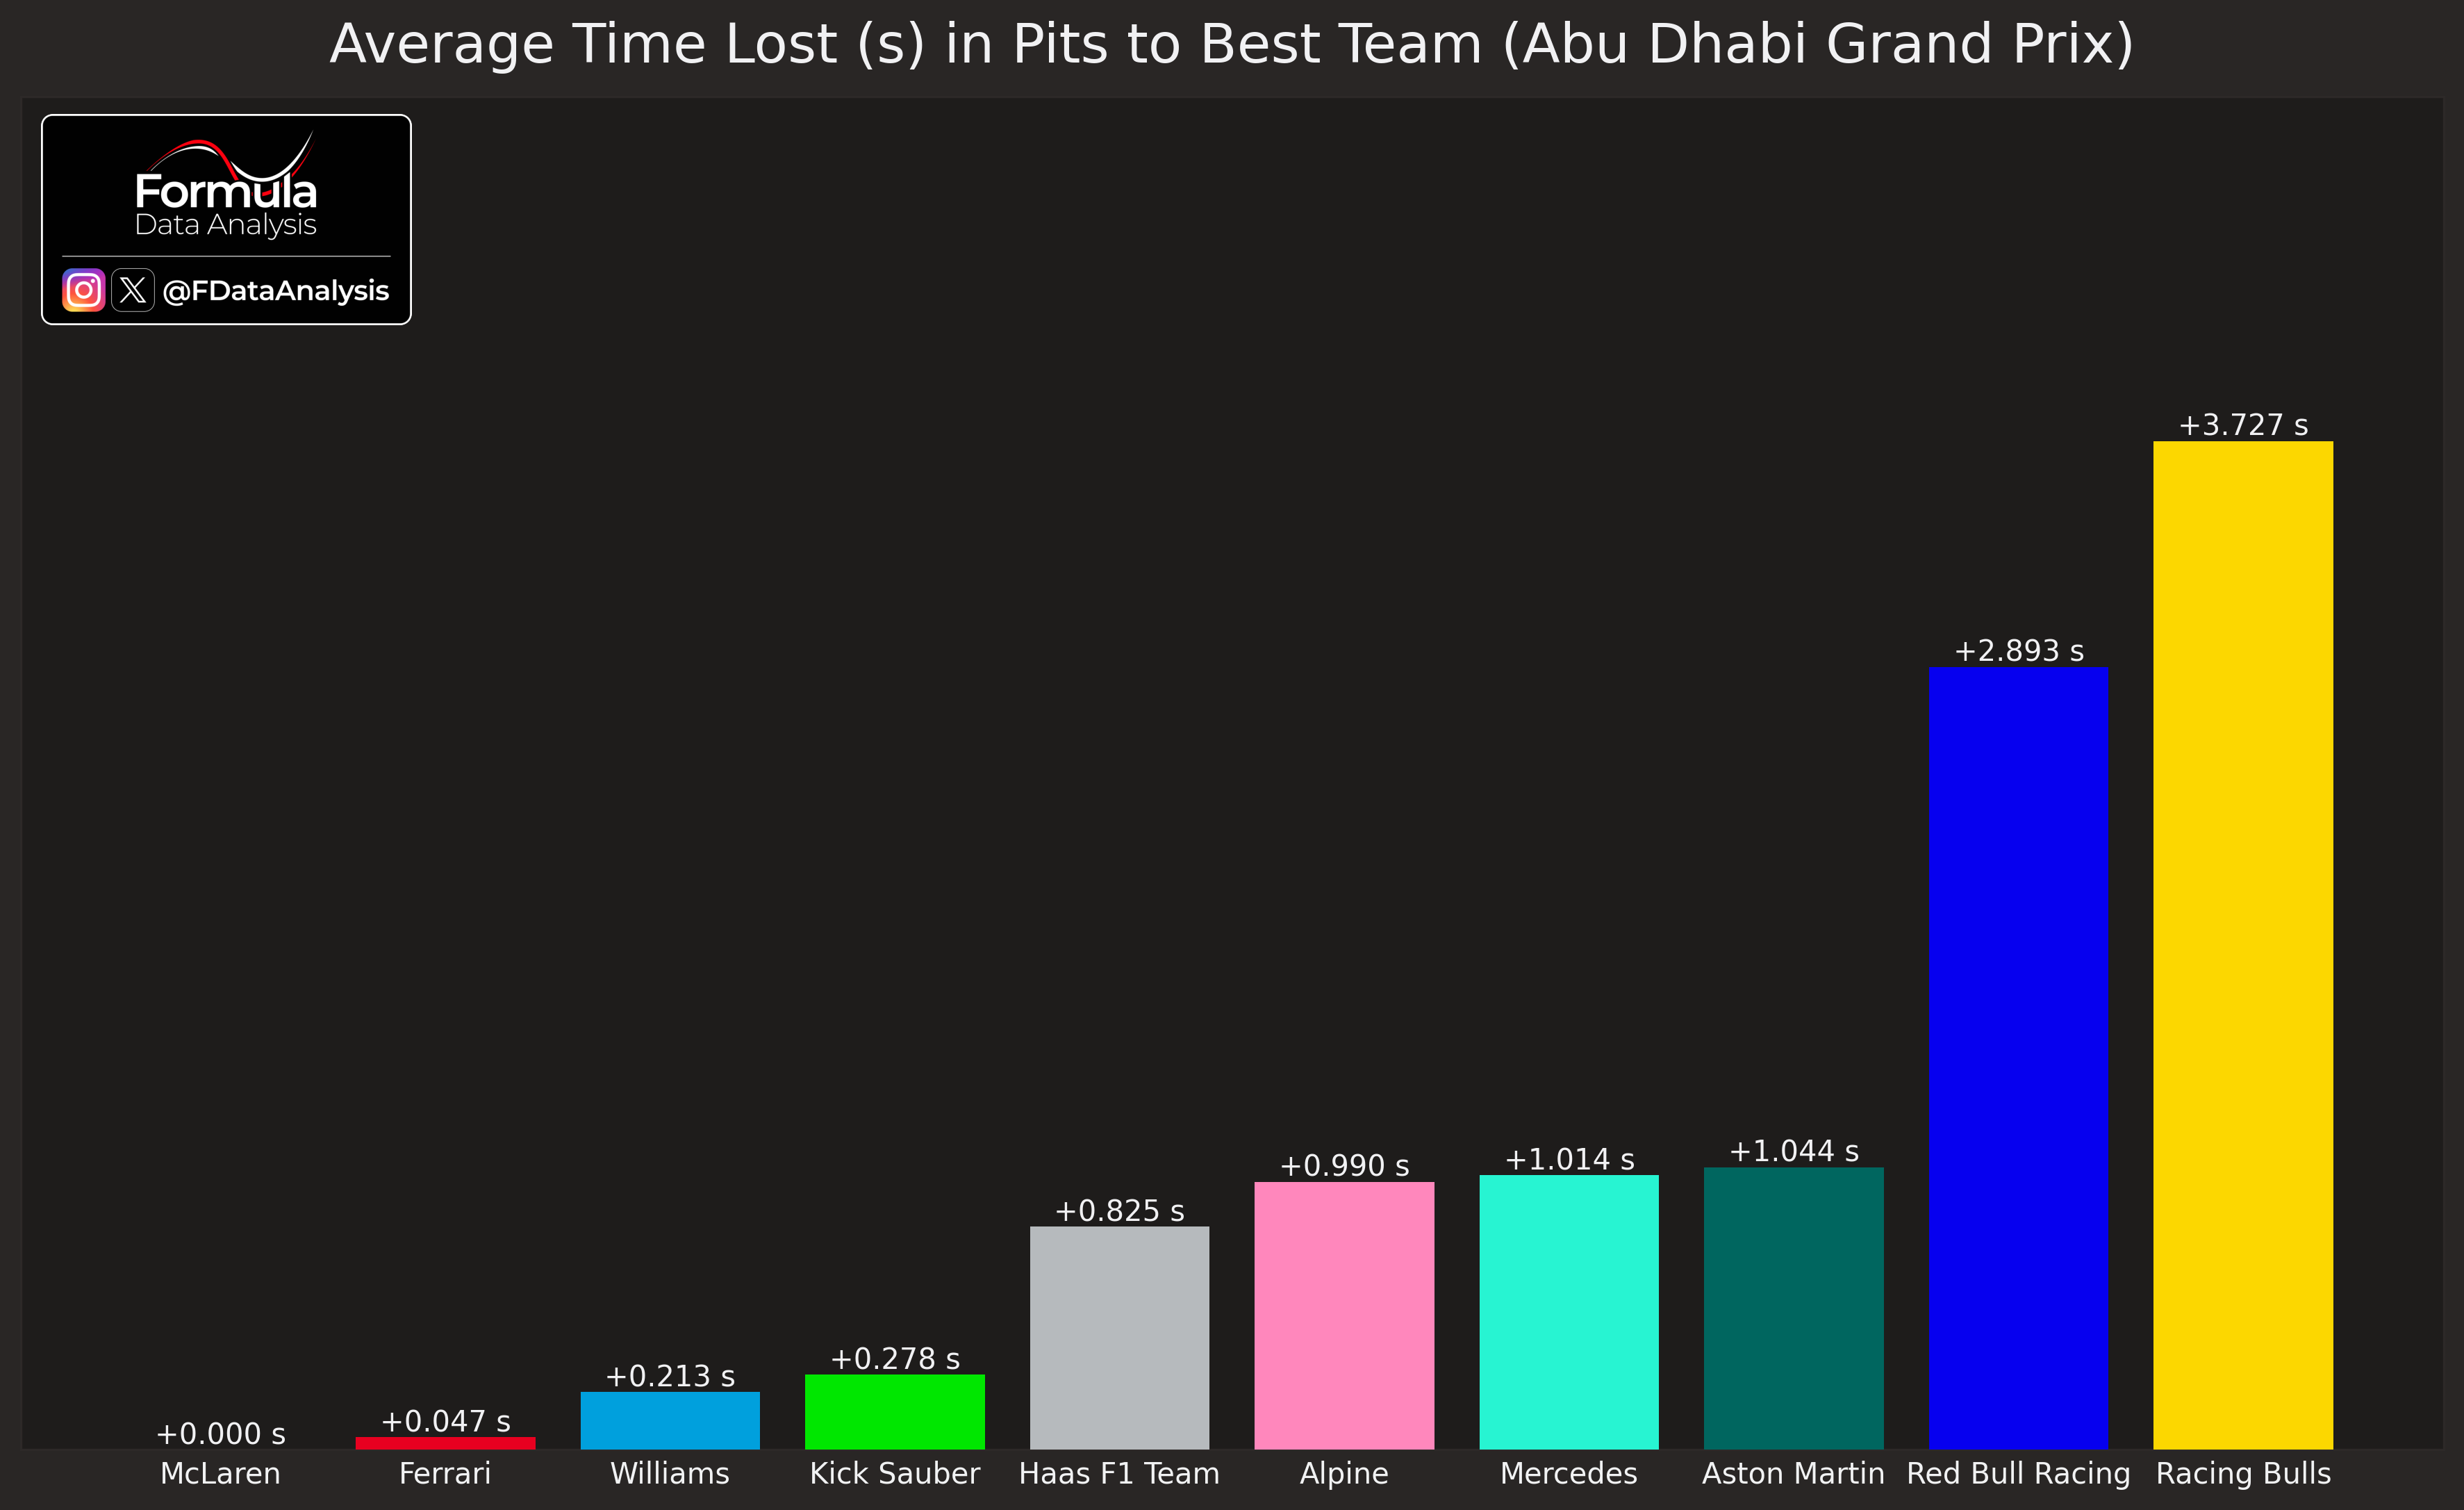
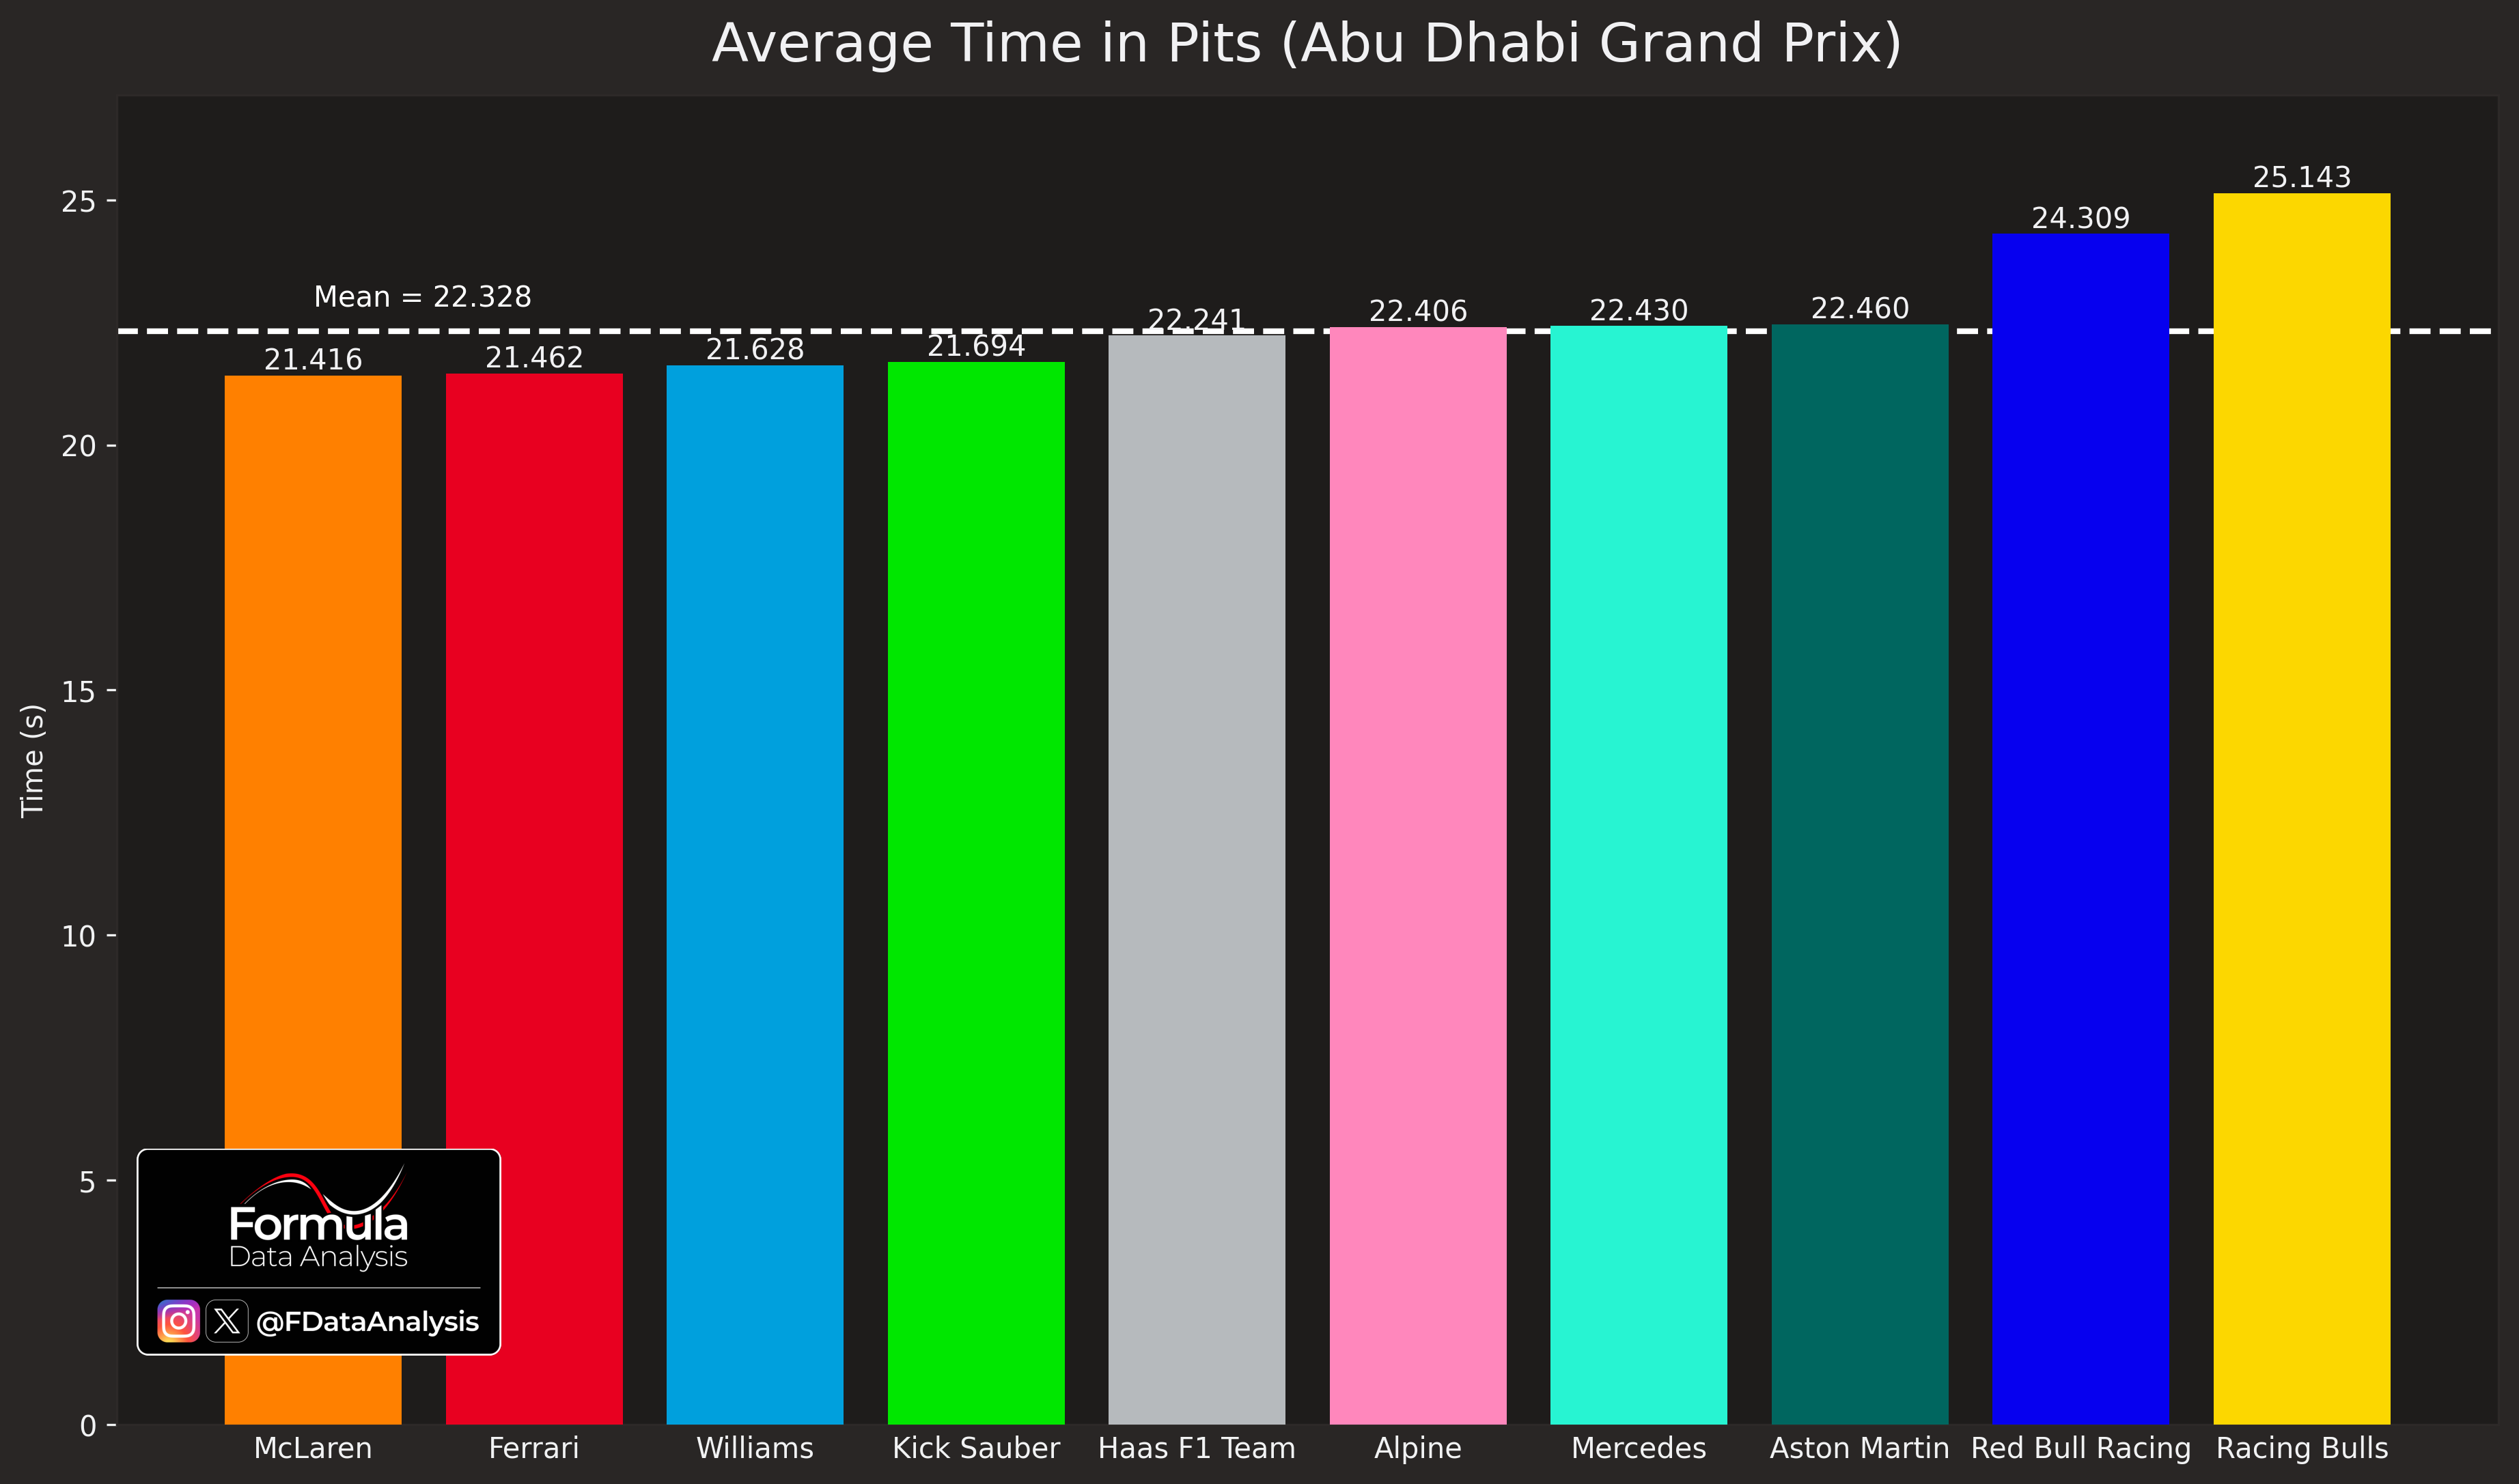
How to read: The average time spent in the pit (from the entry to the exit line) is shown for each team. The mean for all teams is also shown as a dashed line.
McL and Ferrari aced the pit stops. Mercedes, instead, was 1s/pit slower. RBR's figure is inflated by TSU's penalty.
 Race Start Analysis
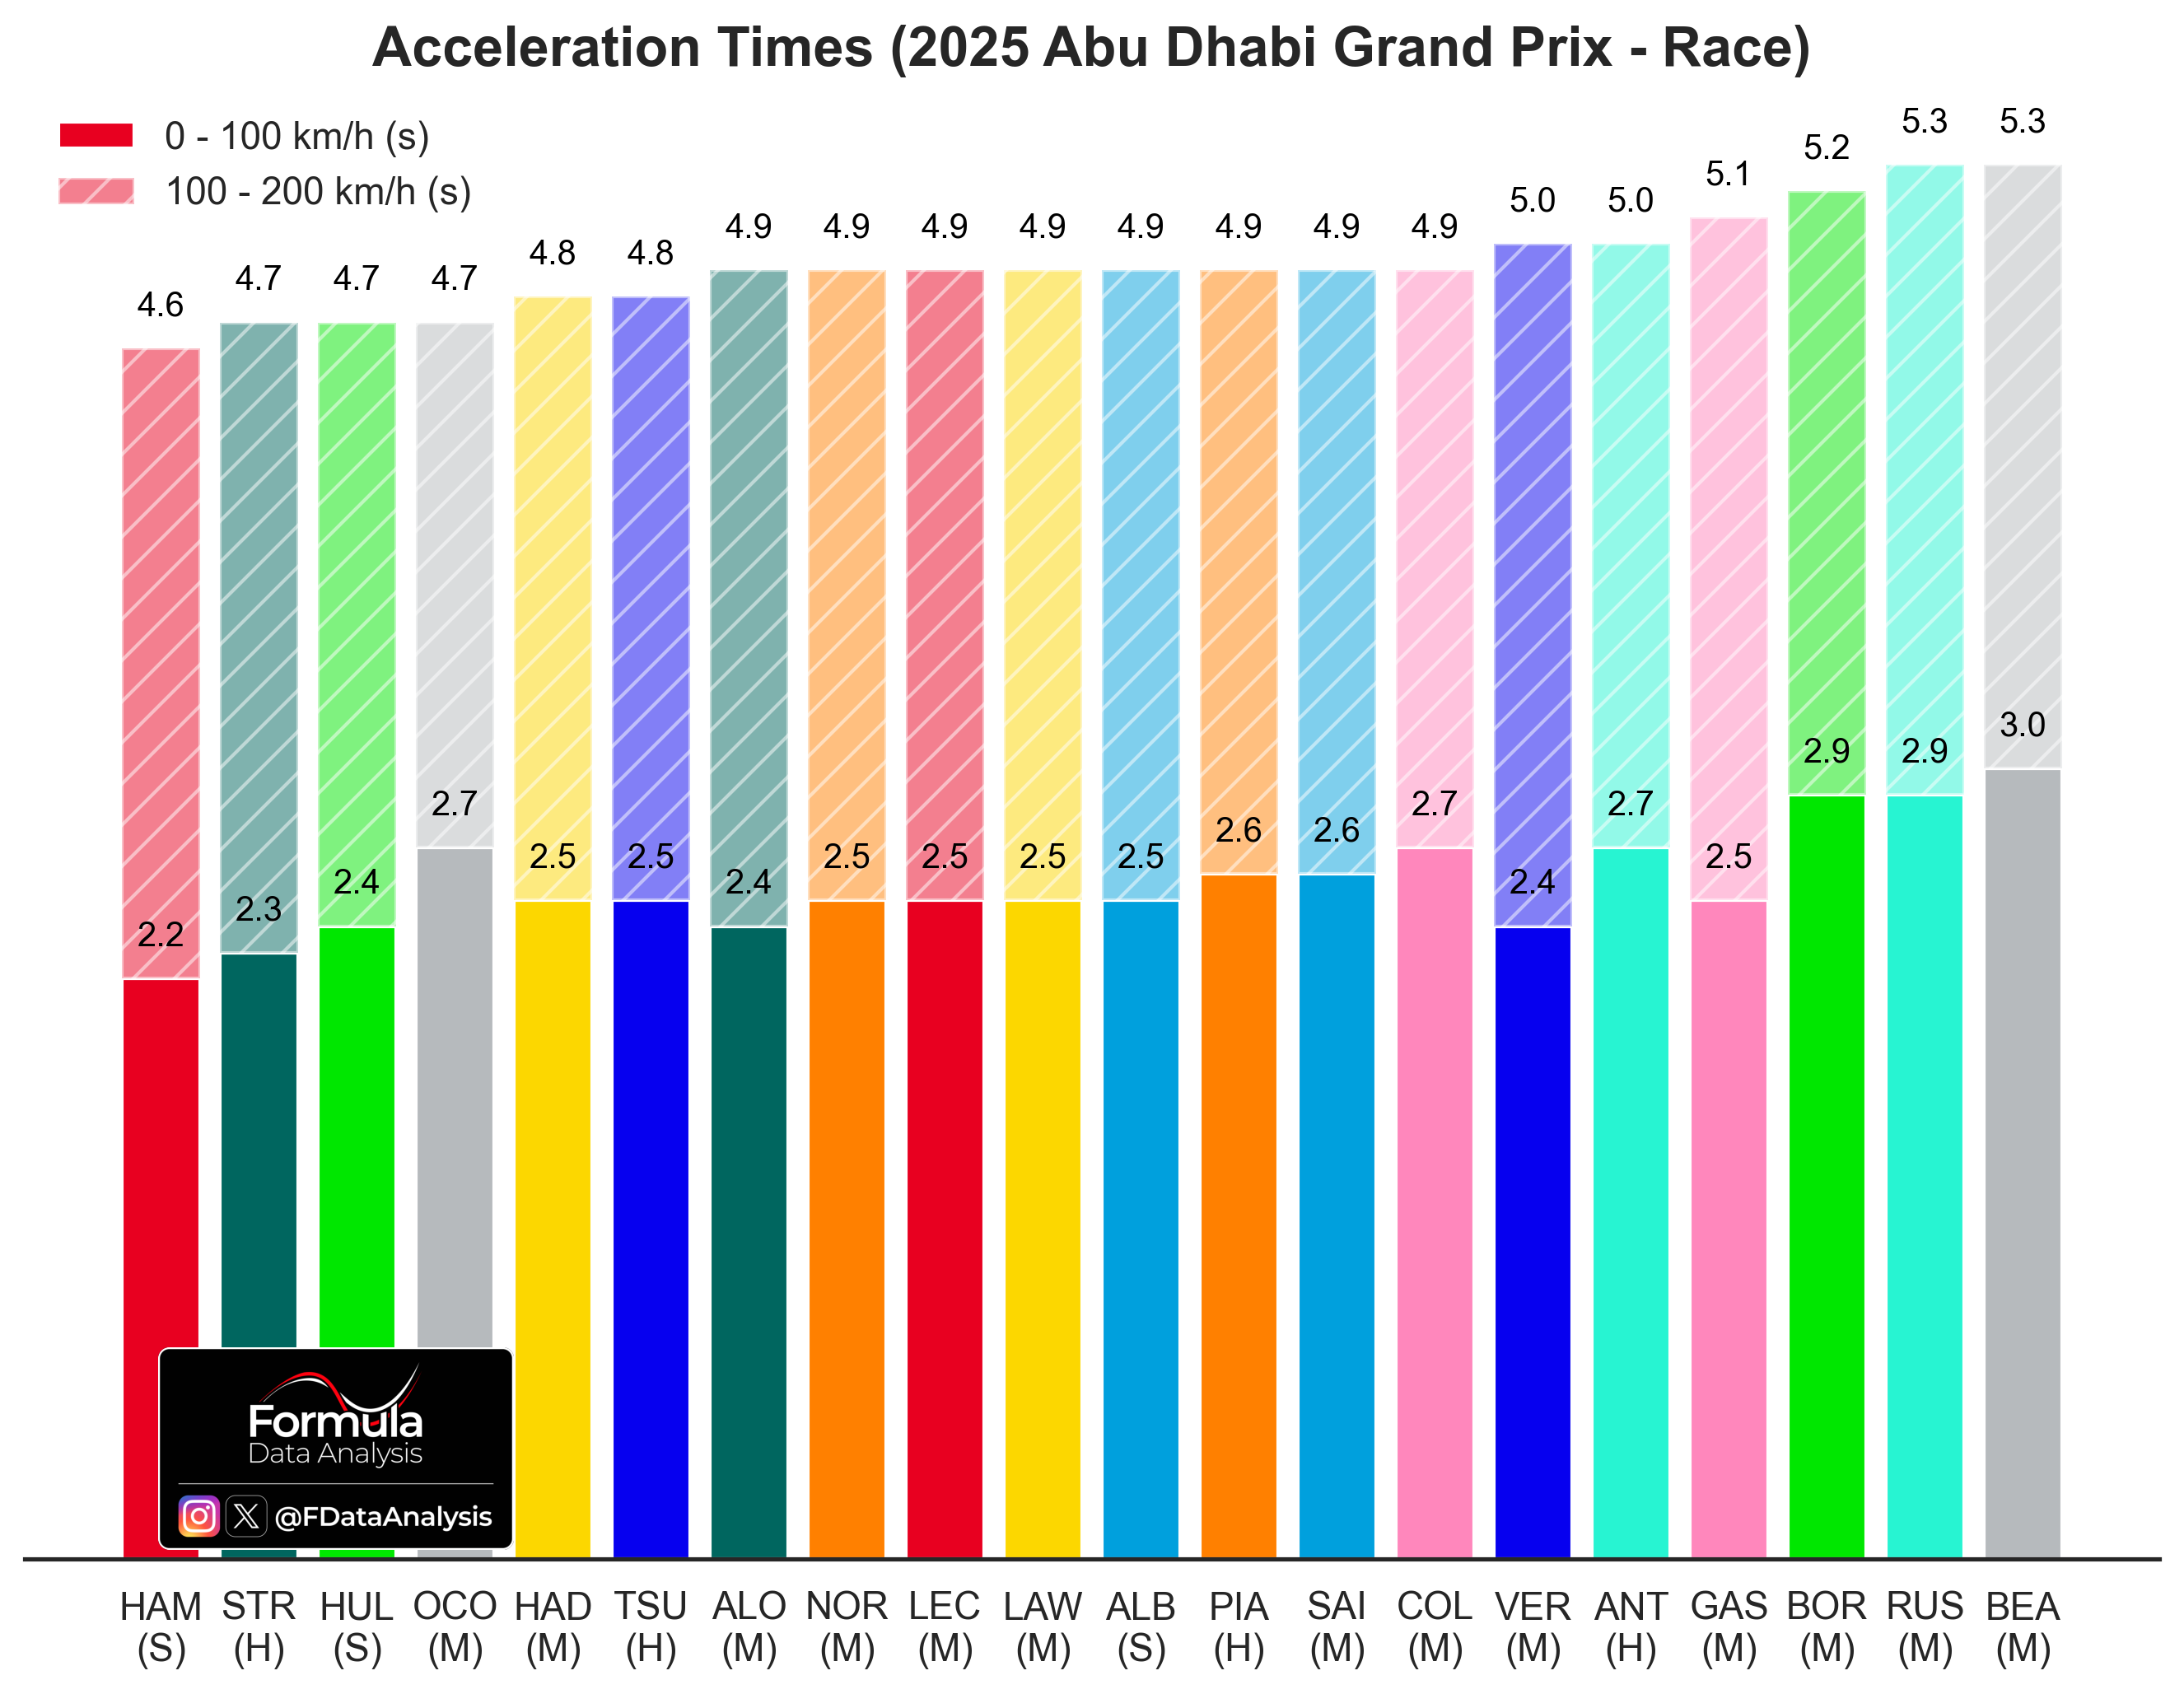
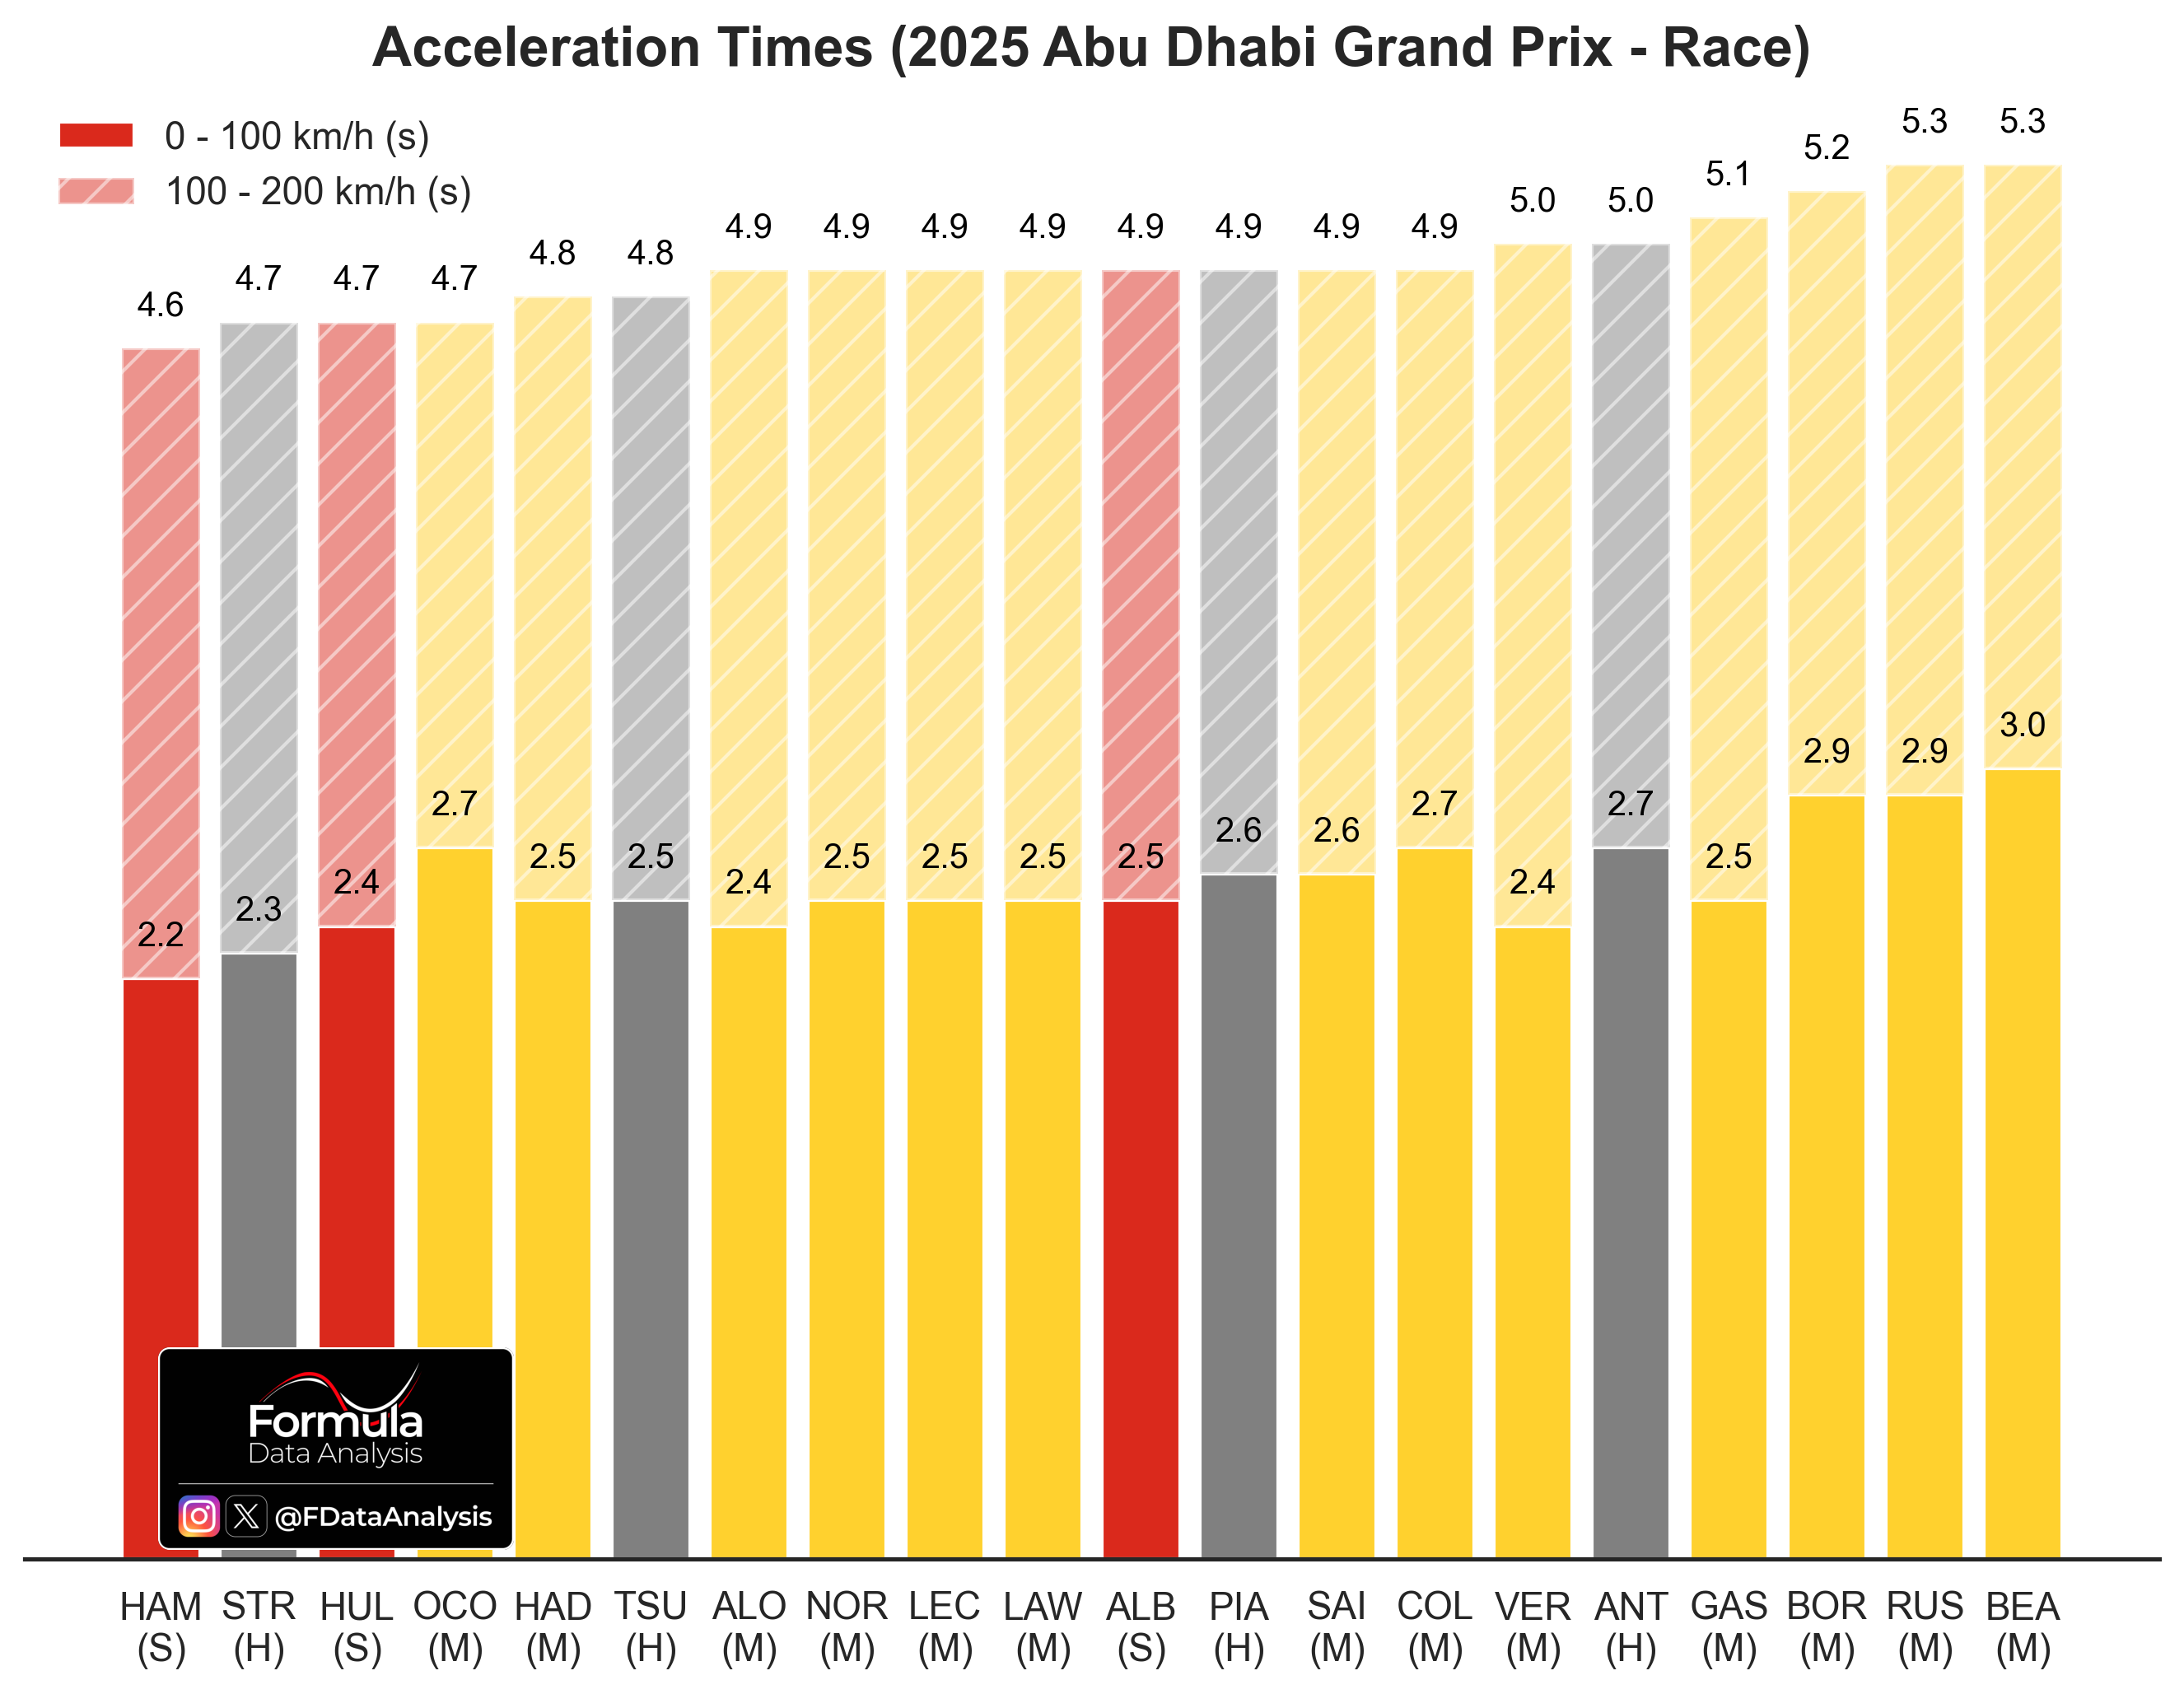
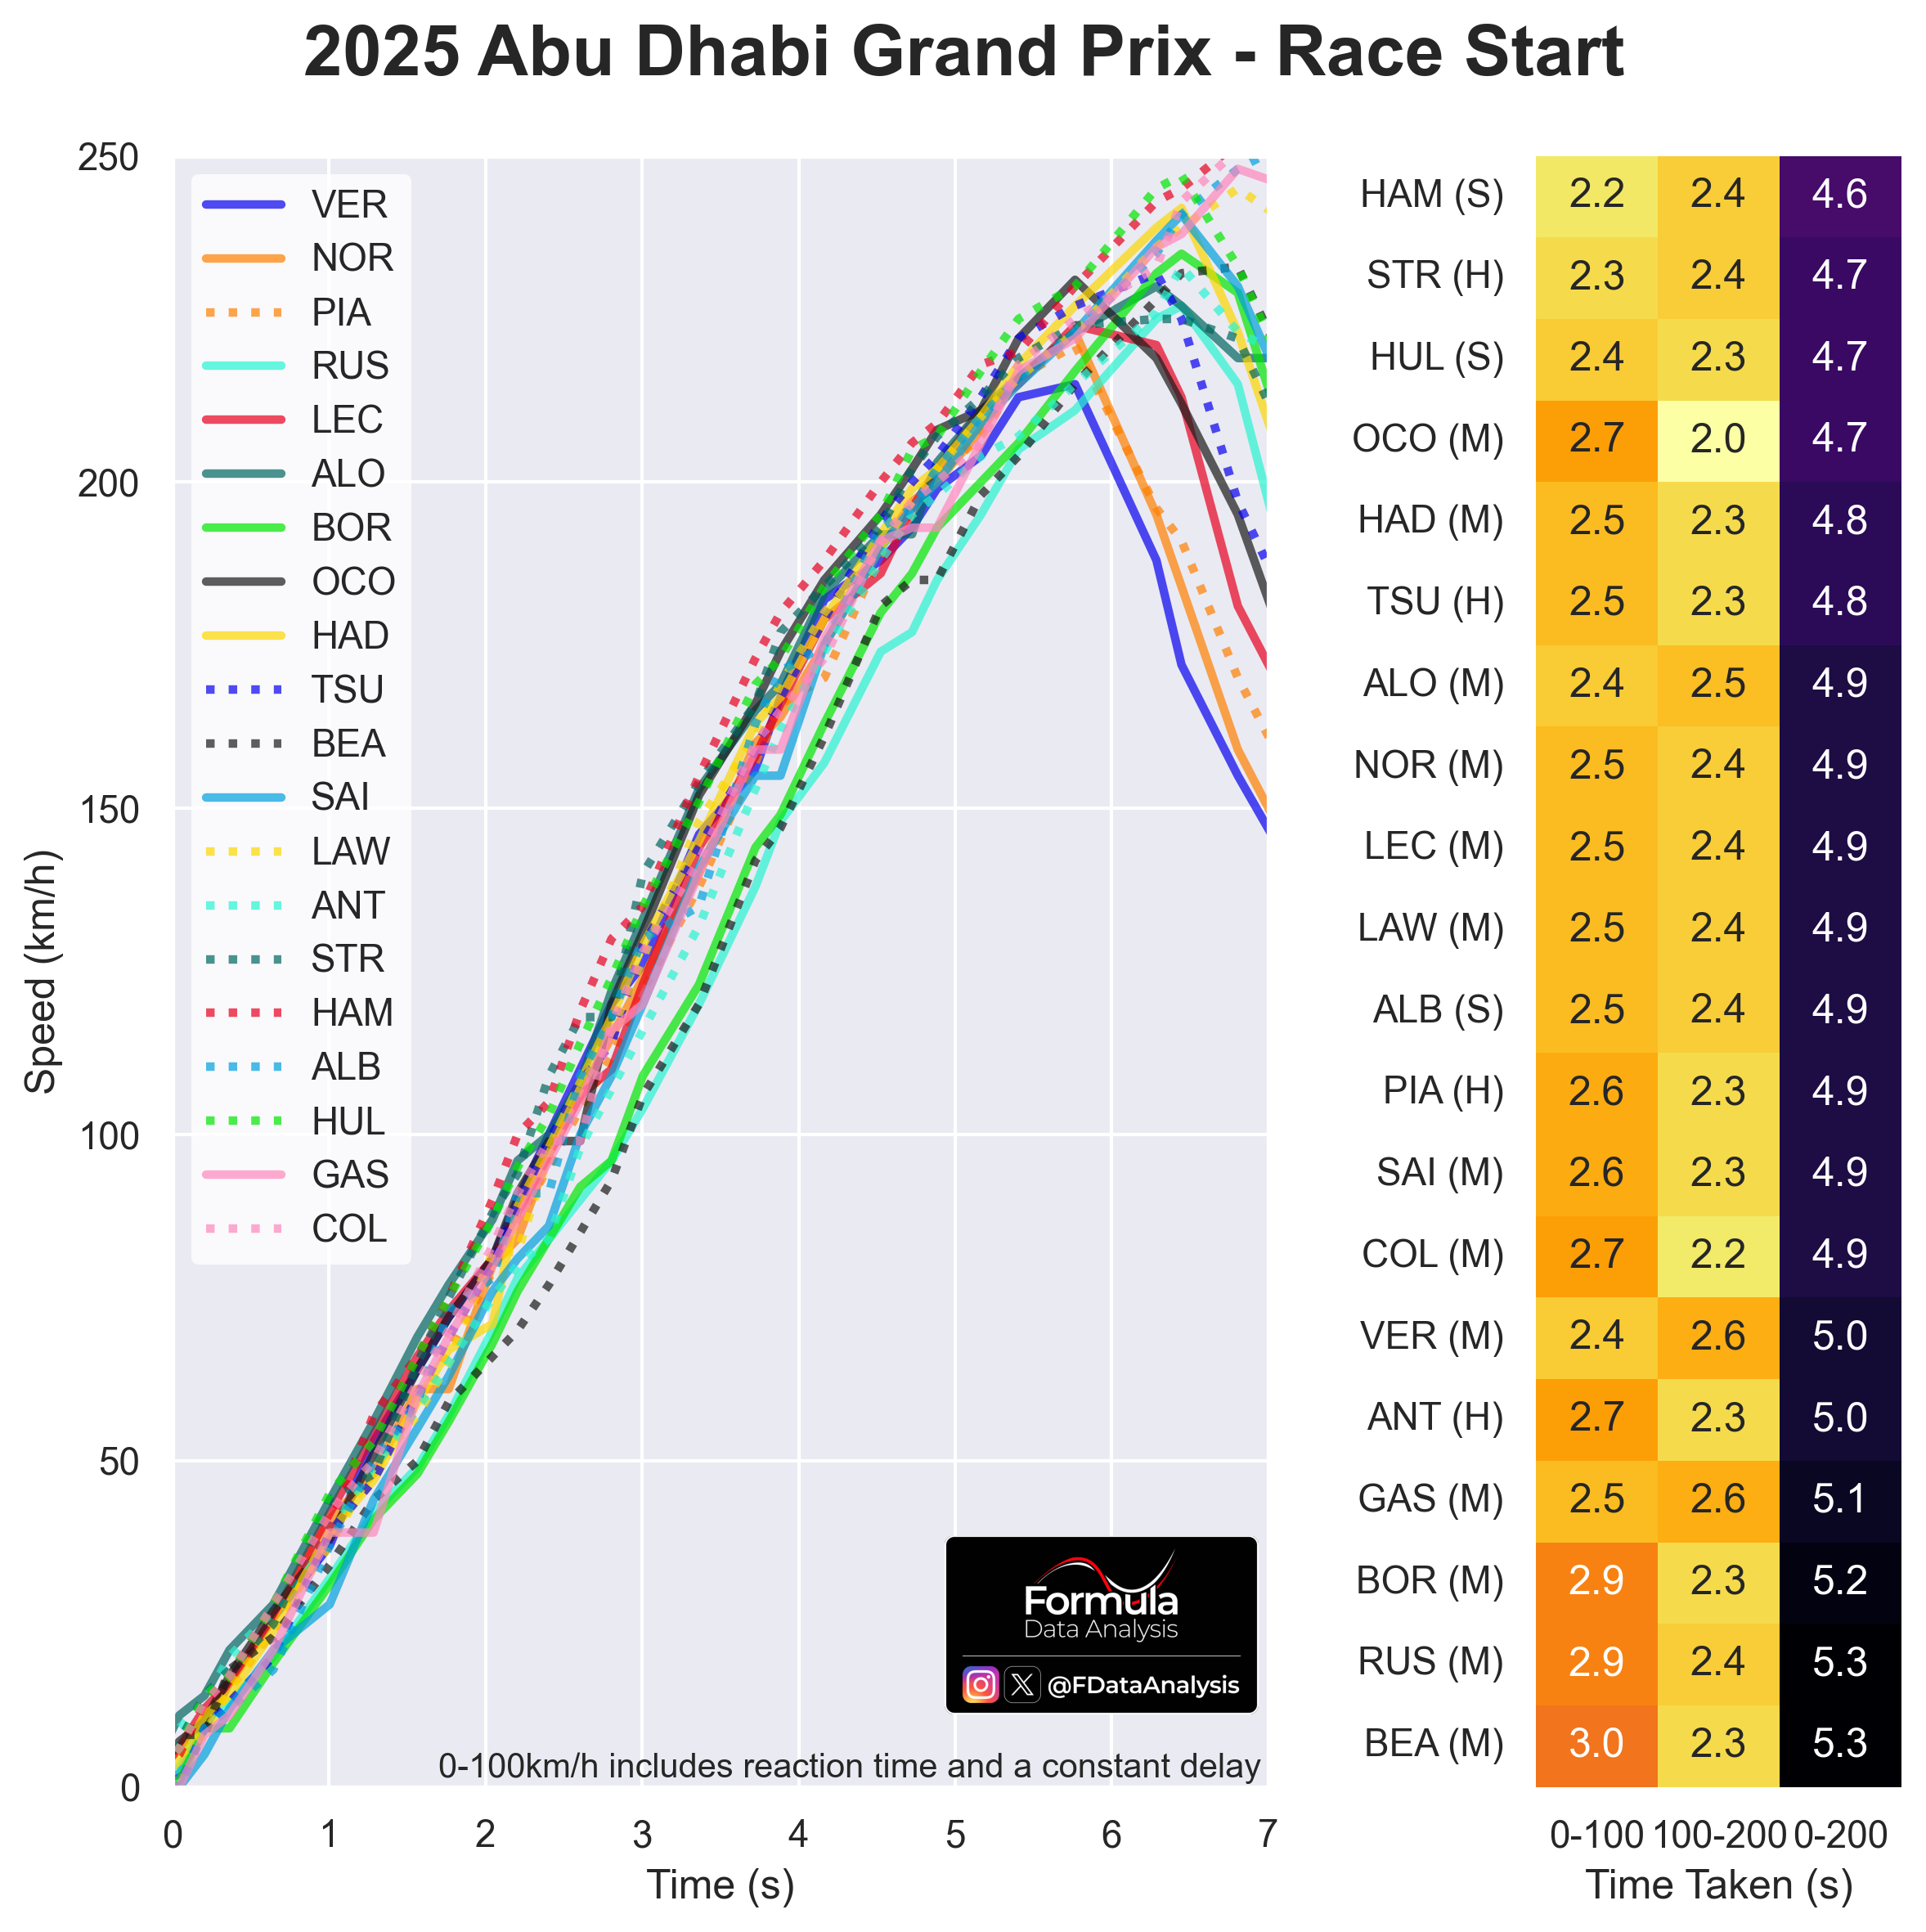
How to read: The table on the right shows the time needed to go from 0 to 100km/h (first column), to go from 100 to 200km/h (second column), and the total time to reach 200km/h (third column, sum of the previous 2). The 0-100km/h time, which includes reaction time, is higher than the value shown on TV because the lights go off slightly later than the start time considered. However, as this delay is the same for all drivers, it does not impact the comparison between drivers. The images below show each driver’s 0-100 and 100-200km/h times visually, coloured based on team or compound used.
HAM had the best start, aided by softs: just 2.2s to reach 100km/h! His 0-200km/h time was the best one, too. RUS and BEA struggled the most, needing 0.7-0.8s more than HAM to reach 100km/h.
 Softs offered an advantage, while Hards didn't impact the acceleration times negatively at all compared to Mediums.
 Gap to the Race Winner Through the Laps
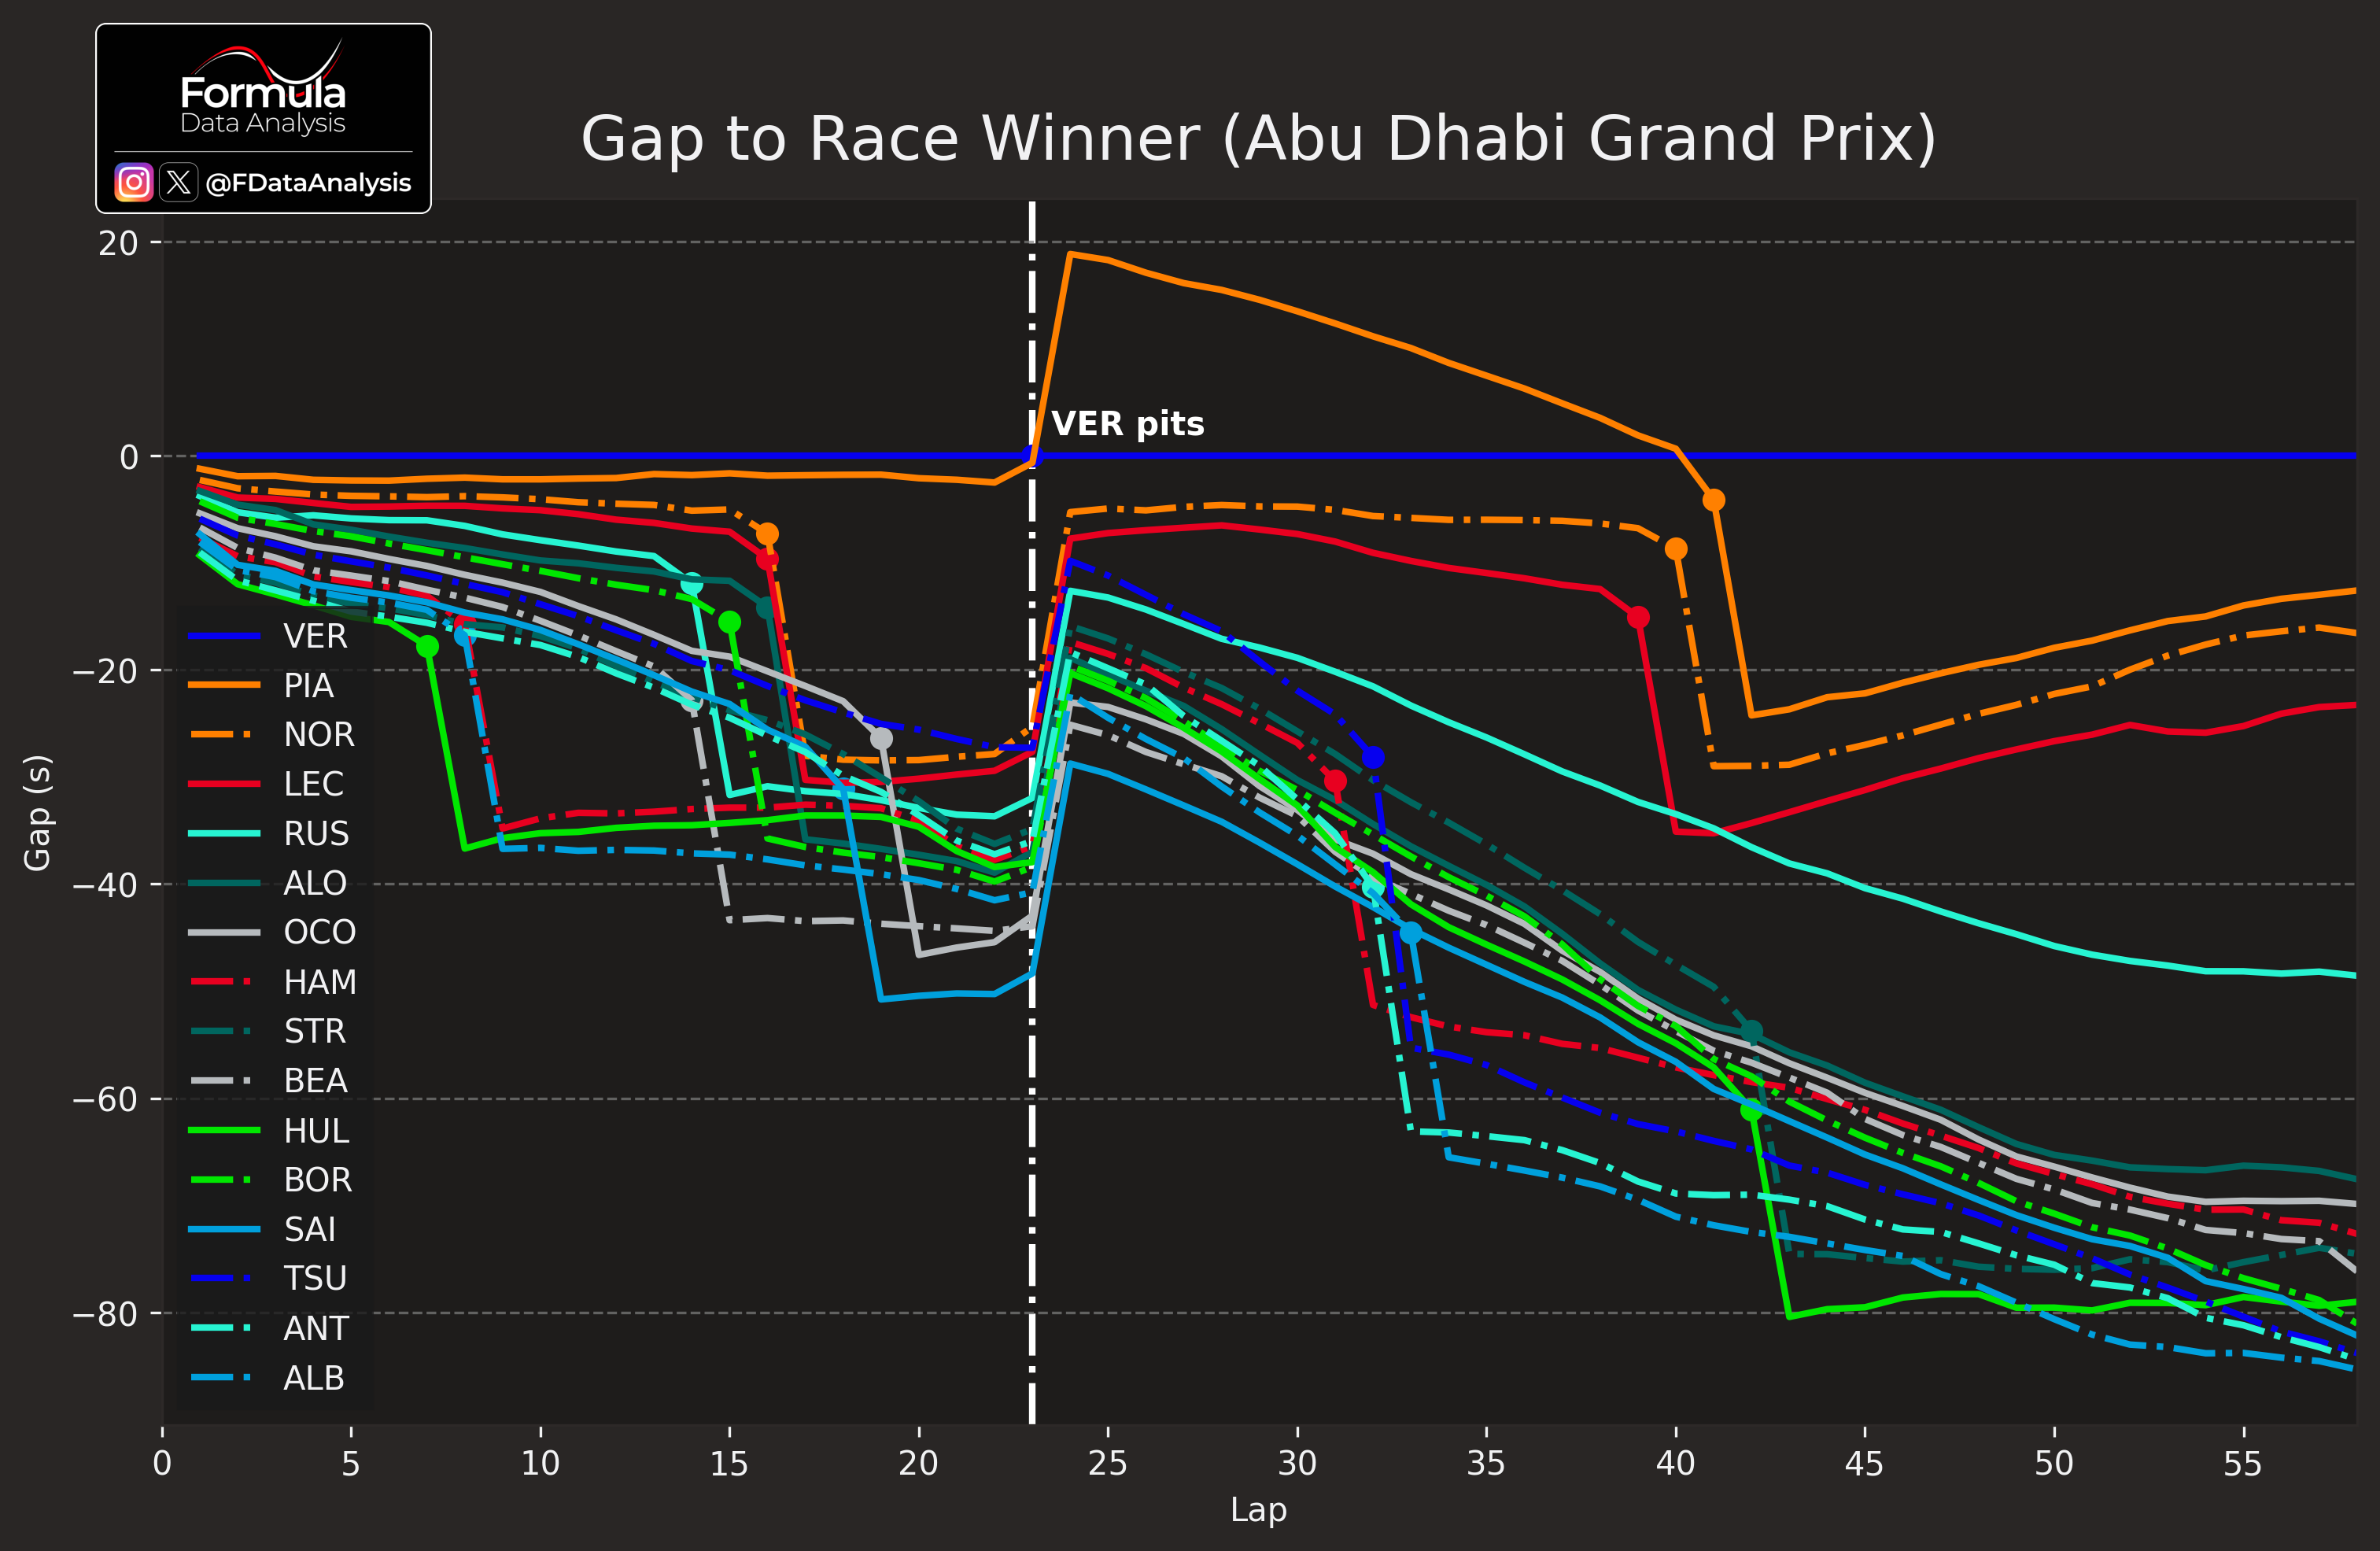
How to read: The graph shows each driver’s gap to the race winner at the end of each lap. A vertical, white sash-dotted line shows the lap in which the race winner entered the pits. Laps in which the Safety Car was present are highlighted in yellow.
PIA matched VER's pace throughout the 1st stint, while NOR lost ground (but not enough for LEC to overtake him). By the end, NOR/PIA/LEC all gained significantly over VER thanks to their late pit stop. Compare that to RUS, who, despite mirroring VER's strategy, lost significantly over him in all phases of the race. STR and HUL were on fire in the last ~15 laps, racking up a lot of positions!
 The last premium-only article... so far!
Dear supporters,
As I mentioned a few times in the past articles, I can't continue writing these premium-only articles going forward. I would love to do that, but unfortunately, it's due to factors that are outside of my control. I've been doing this for over three years and loved every minute of it, and all of this would not have been possible if not for your support!
This, however, does not mean that I won't restart doing it in case the right conditions arise. In fact, I'm going to pause the memberships, meaning that you won't be billed anymore, but I can still re-activate them in case I resume doing this sometime in the future. I will make all the 2025 premium-only articles free for everyone, so that you can still reread them once I've frozen the memberships. I waited for the season-end to offer the best value to those who did the yearly membership and to provide continuity and closure to my work. Thank you SO MUCH for your support: managing this page still feels like a dream to me! I will use the additional time saved from not writing these long-form posts to produce even more public analyses, putting this time to the best use.
See you on your favourite social media app, whatever that is! :D
Mirco / Formula Data Analysis