

A free, open-source tool for wave-energy site screening ☕🌊
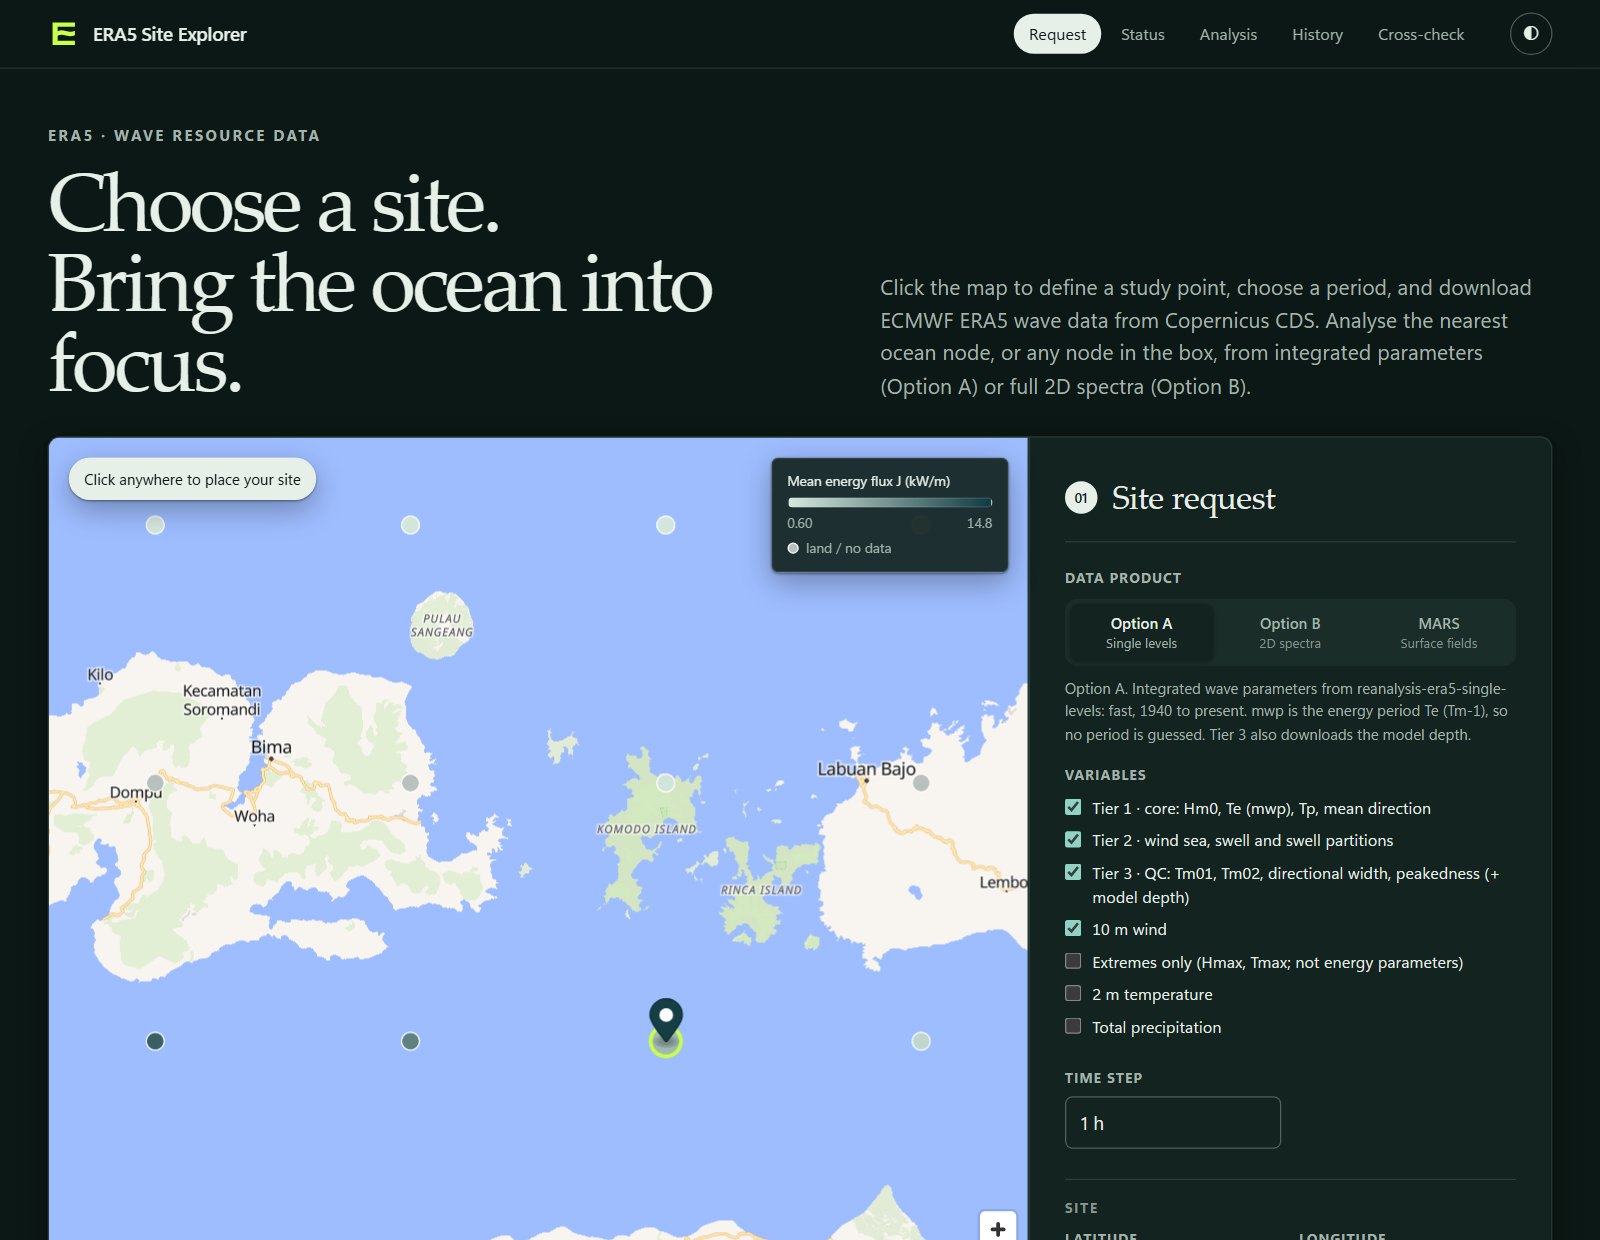
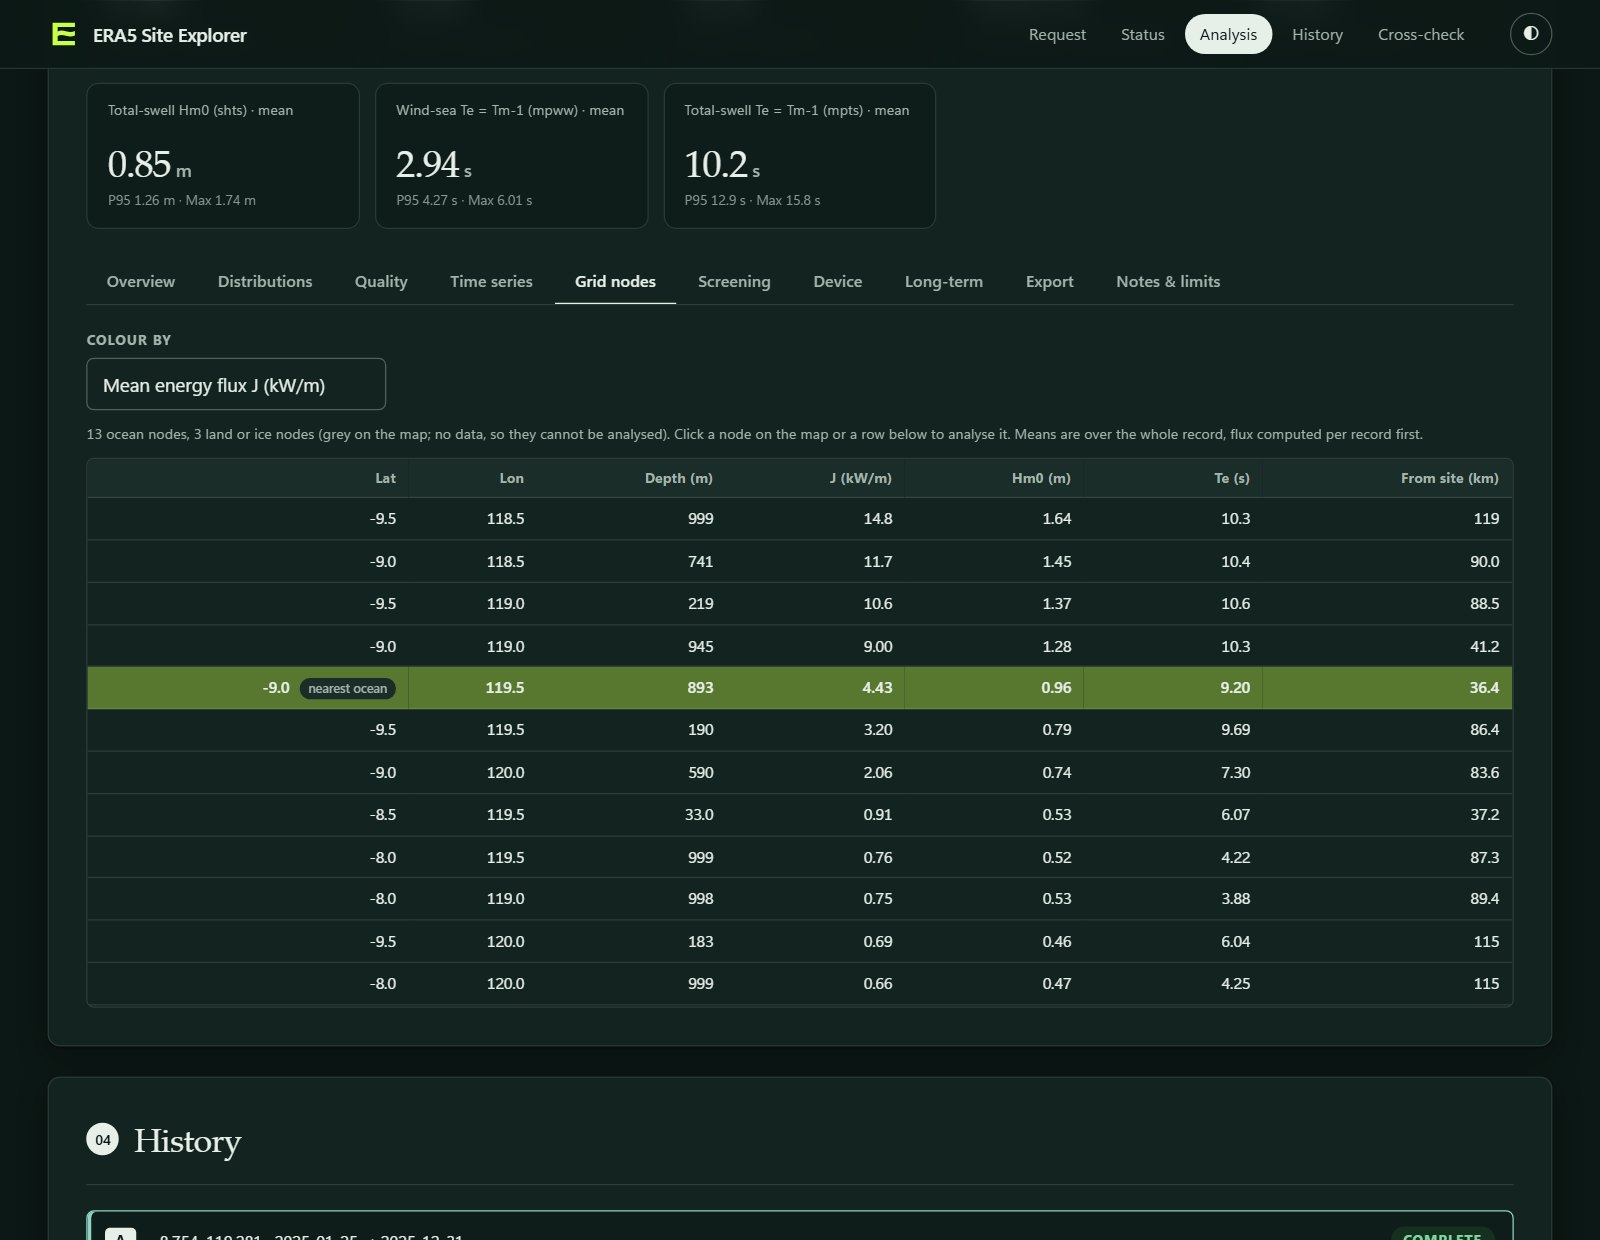
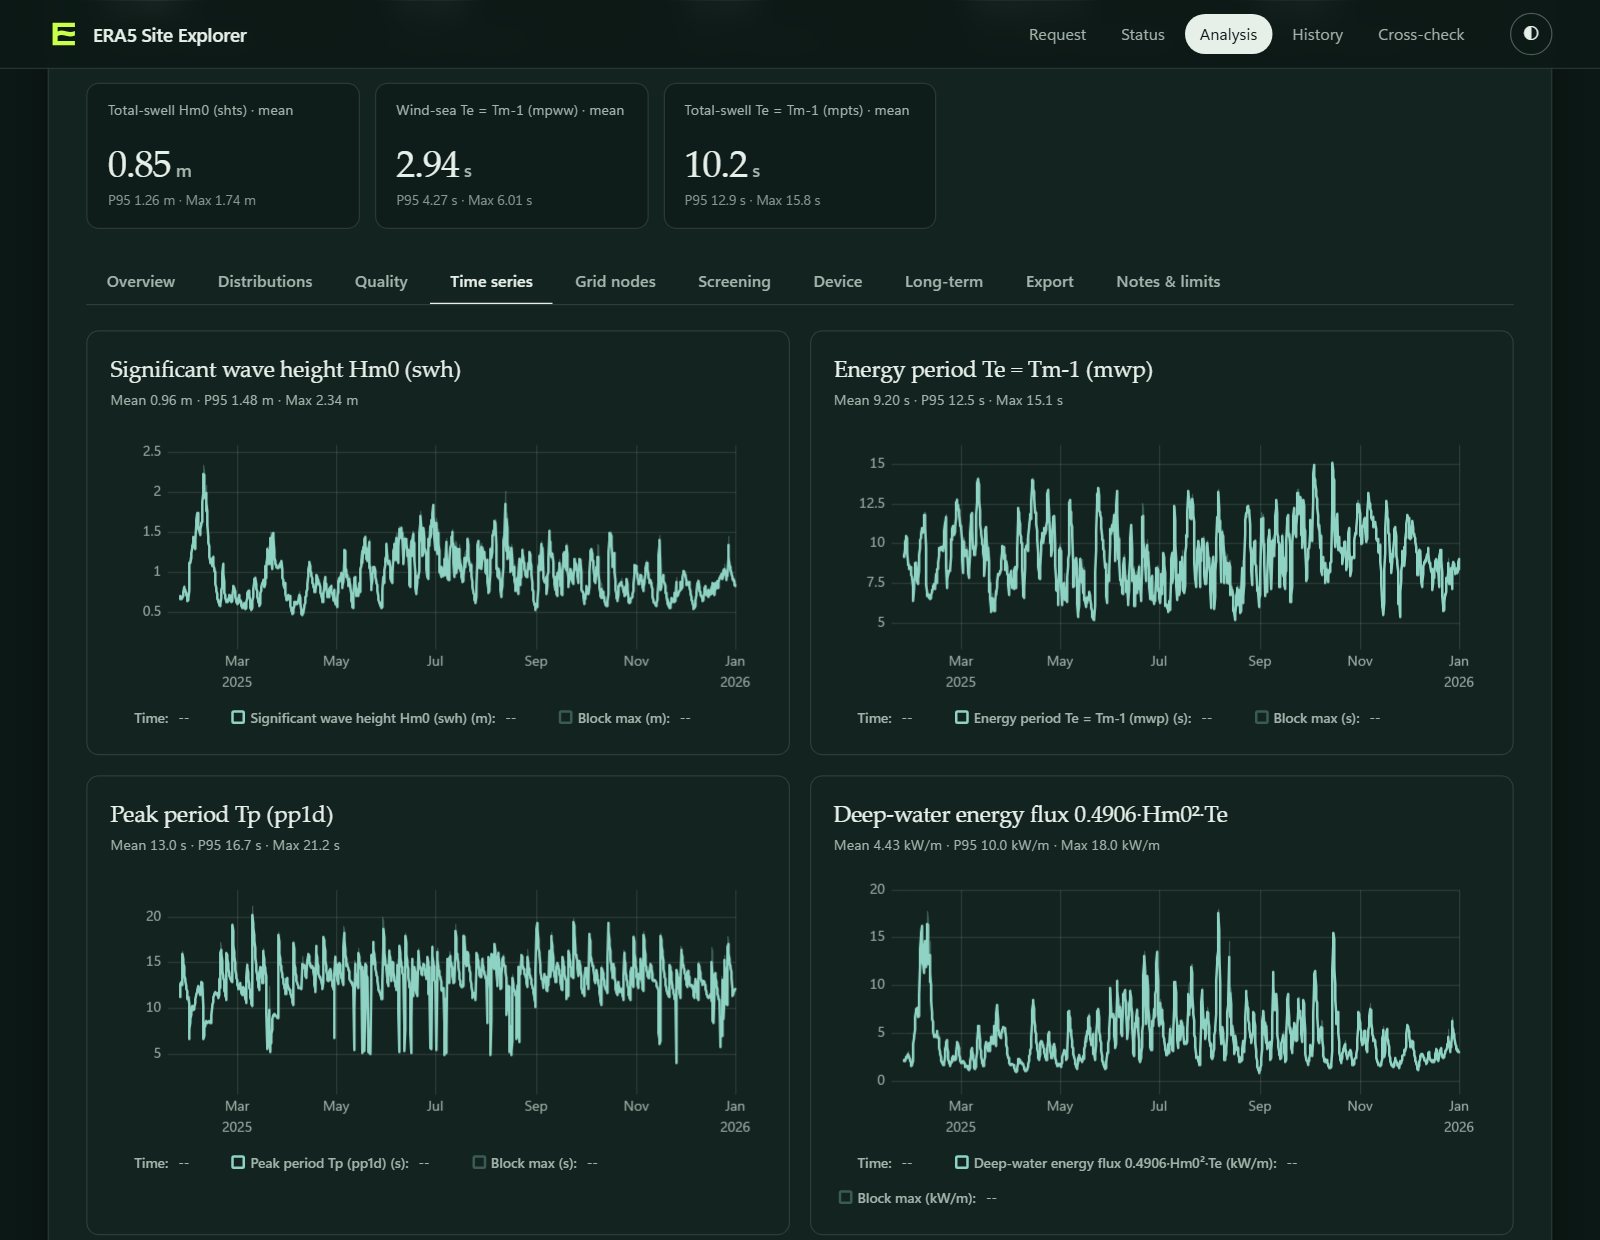
I've been building a small app that takes the pain out of the first step of wave-energy resource work. You click a site on a map, it downloads ERA5 wave data from Copernicus CDS, and you can look at the numbers at any grid node of the download.
What it does
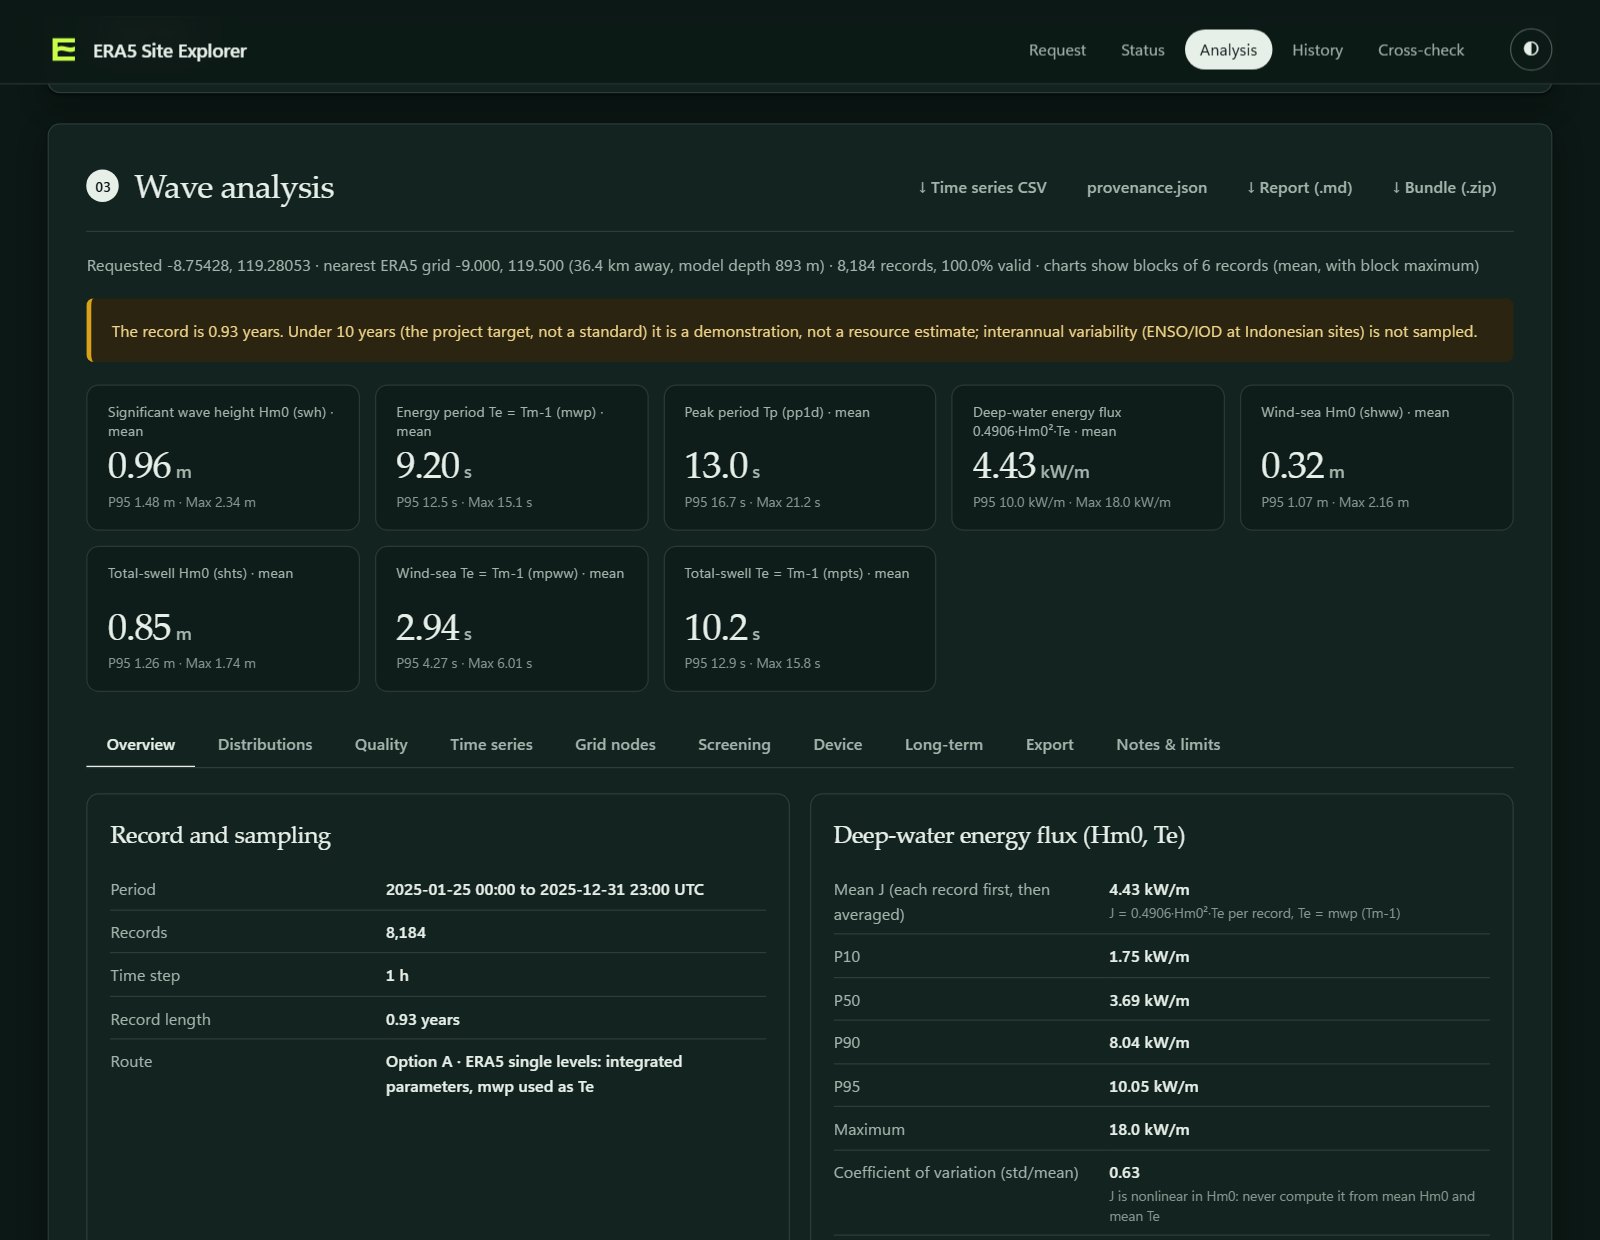
Energy flux, climatology, Hm0–Te scatter tables and wave roses
Spectral partitioning from 2D wave spectra, plus ranking of nodes for site screening
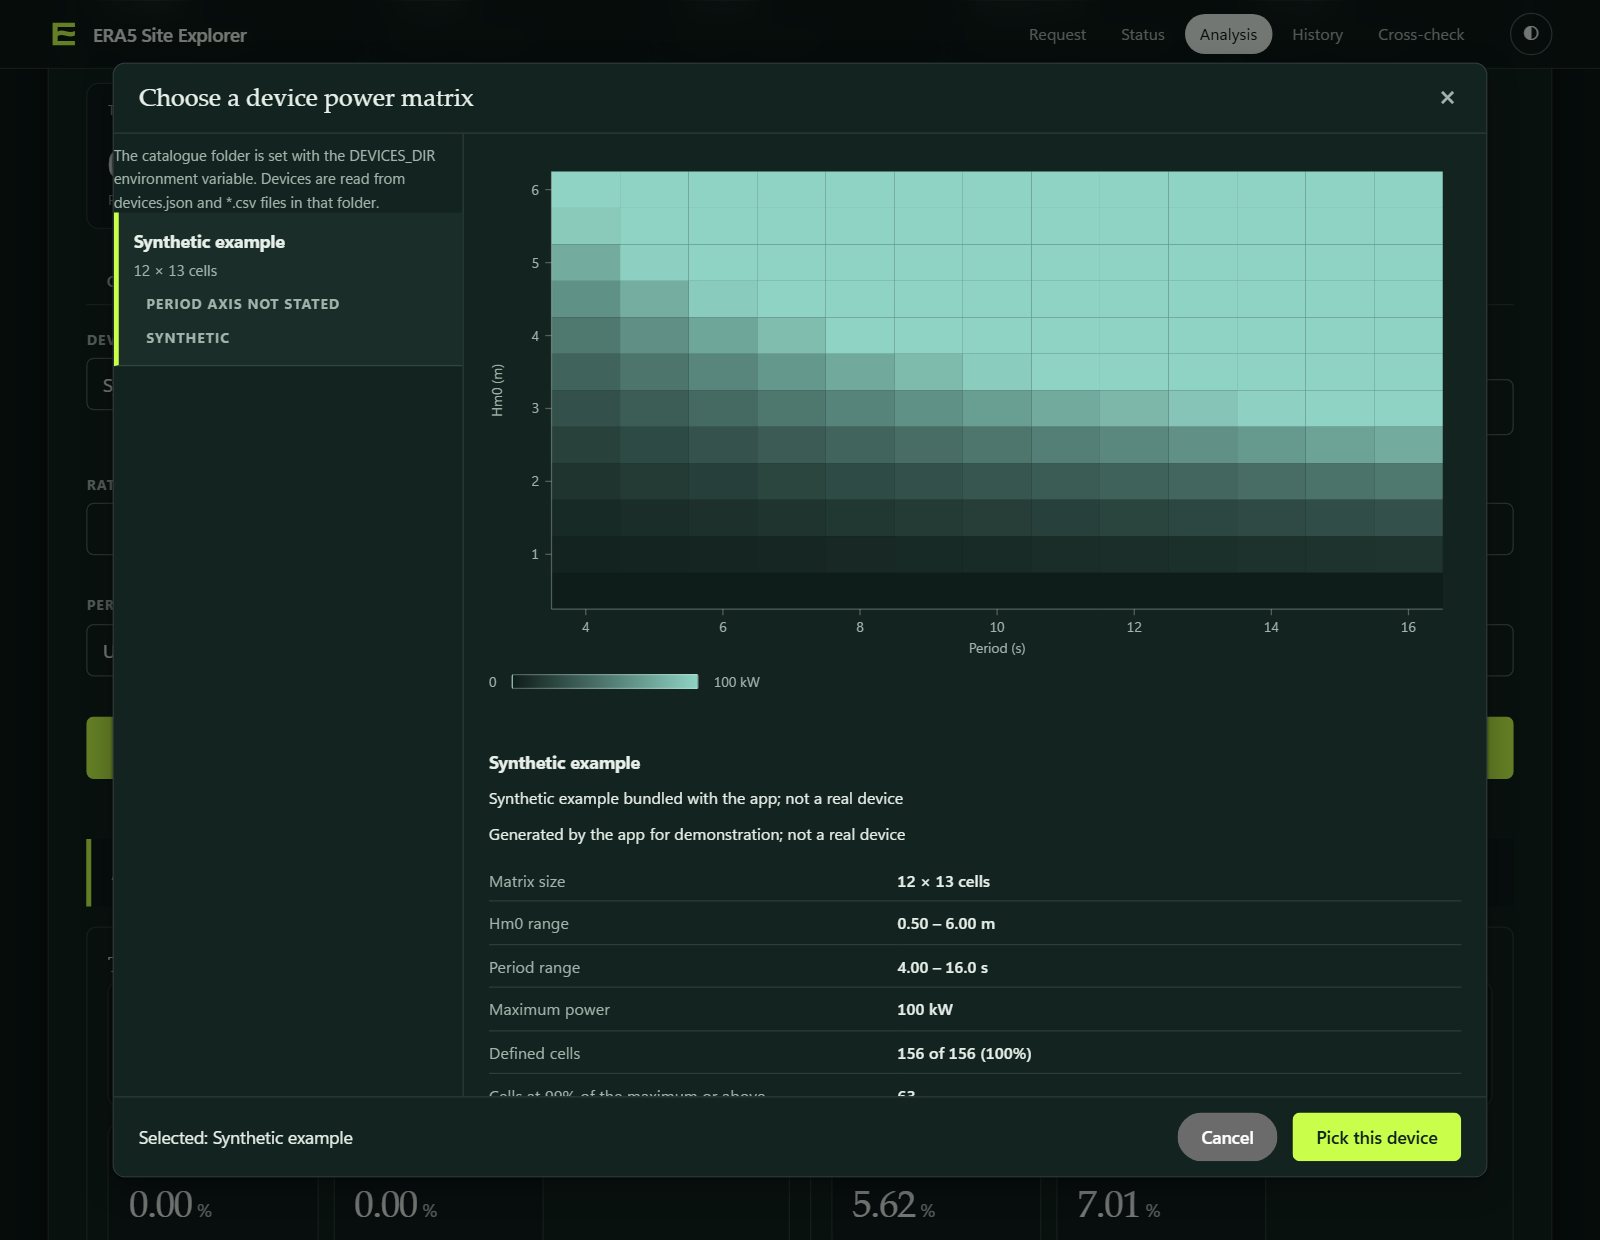
Device energy production (AEP) from a power matrix
Extreme values, quality checks, and a report export (Markdown, ZIP, CSV, SVG)
It runs locally, the basemap needs no a
ccount or token, and your CDS credentials never leave your machine
Where it stands
The numerical are tested on synthetic data with known answers (720 tests, run on every push).
The single-level route has completed real CDS downloads.
The 2D-spectra route hasn't finished a real job yet, because CDS keeps refusing the requests as too large. I'm working on it.
Use it as a screening aid, not a resource assessment.
It's free and always will be. If it saves you time, or you'd like to see the spectra route finished sooner, a coffee helps keep it going. Thank you! 🙏
👉 Code and docs: https://github.com/EinggrauMFW/ERA5-Site-Explorer
📄 Cite it: https://doi.org/10.5281/zenodo.23129942