

Illusion by Offset: Deconstructing New Zealand’s Net Debt Illusion and the True Sovereign Burden (2023-2026)
Introduction
This was interesting to research, as it shows just how government miss report stats and how they confuse the average voter, that knows nothing about economics of states. I was motivated by all the false figures National NZ crown government publish, well until I looked at the truth. This paper is what I found and shows how they twist economics to hide how much they are borrowing really.
Public debate surrounding sovereign fiscal health often hinges on a simple question: What does the government owe, and what will taxpayers be forced to pay back?
In New Zealand, the official narrative provided by public accounting frameworks relies on a headline metric known as Headline Net Core Crown Debt. By subtracting unsold financial assets, including the New Zealand Superannuation Fund (NZ Super Fund), cash reserves, and Crown advances, from total liabilities, government reporting frames the public debt burden as roughly $73.0 billion to $88.7 billion.
I find it madness that they include unsold assets as if they are sold??? They will say that NZ Super Fund Is earmarked to pay the debt off, but if it pays the debt off, were does the money come from to pay retired people their super. So next time you hear people talk on debt ask is this the Gross Obligations or the Net Core Crown Debt. Note that this is an international IMF guidelines to make the country's broader net balance sheet look manageable, not just a problem in New Zealand.
However, this metric creates a fundamental distortion in public understanding. An asset that has not been sold, and which legally or politically cannot be sold to clear immediate obligations, does not diminish contractual debt obligations. When creditors collect interest or demand principal repayment upon bond maturity, they require settlement in cash, not paper claims on unsold stock portfolios.
This paper strips away balance-sheet offsets to analyze New Zealand’s debt trajectory strictly through Gross Obligations:
Gross Sovereign-Issued Debt (GSID): Direct contractual bonds issued into market channels.
Total Crown Borrowings: Whole-of-government liabilities encompassing Central Government, State-Owned Enterprises (SOEs), and Crown Agencies.
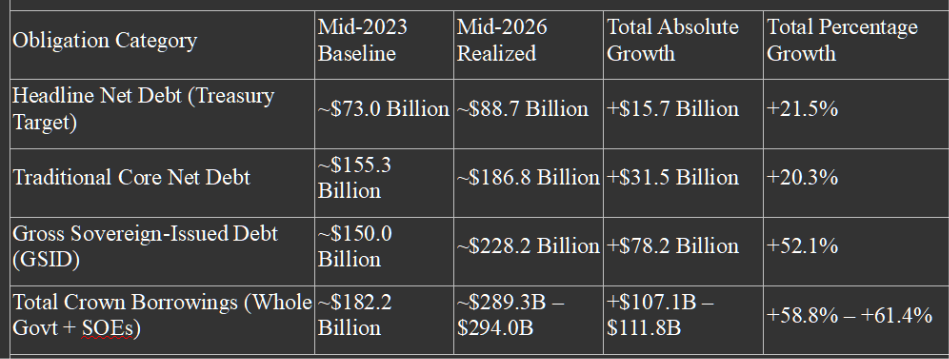
Under these unvarnished measures, the total debt increase between mid-2023 and mid-2026 is not an incremental $15.7 billion, but an expansion exceeding $78 billion to $107+ billion, representing a growth rate of ~52% to ~61%.

1. Deconstructing the "Net Debt" Accounting Change
In 2022, the New Zealand Treasury revised its headline indicator to align with International Monetary Fund (IMF) financial reporting standards. While technically aligned with global standards, this shift altered public perception:
                  THE DEBT REPORTING SPECTRUM (MID-2026)

  [New Net Debt Headline]         →  ~$88.7 Billion    (Includes NZ Super Fund Offset)
  --------------------------------------------------------------------------------
  [Traditional Net Core Debt]     →   ~$186.8 Billion   (Excludes Super Fund, keeps cash)
  --------------------------------------------------------------------------------
  [Gross Sovereign-Issued Debt]   →   ~$228.2 Billion   (Total Market Bonds Issued)
  --------------------------------------------------------------------------------
  [Total Crown Borrowings]        →  ~$289.3B - $294B  (All Core + SOEs + Agencies)
Why Offsetting Assets Distorts Public Reality
Market Volatility: Equities and bonds held in sovereign funds fluctuate based on global market conditions. Debt contracts, conversely, are fixed obligations.
Earmarked Purpose: The NZ Super Fund was established to meet capital demands arising from demographic aging in future decades. Offsetting current operational debt against pension funds implies that today’s debts can be cleared using tomorrow’s pensions.
Liquidation Friction: Attempting to liquidate tens of billions of dollars in sovereign assets during a financial crisis would depress asset values, trigger realized losses, and create broader market disruption.
2. The Unfiltered Numbers: Gross Obligations (2023-2026)
When asset deductions are removed, the structural expansion of New Zealand taxpayer liabilities becomes clear.
TOTAL CROWN BORROWINGS EXPANSION (2023 -> 2026)

   2023: $182.2 Billion
   2026: $294.0 Billion

$107.1 Billion to $111.8 Billion (+58.8% to +61.4%)
Sovereign Obligation Metrics (2023-2026)
3. Economic Implications for the Taxpayer
Focusing on Gross Obligations reveals two primary challenges for national economic policy:
Debt Servicing Drag
Taxpayers do not pay interest on "Net Debt." Interest payments are calculated based on the gross value of outstanding bonds and liabilities. As total borrowing rose toward ~$290+ billion, interest expenses grew to over $10 billion annually, consuming tax revenue that could otherwise support public services or tax relief.
Hidden Agency Risk
Excluding State-Owned Enterprises (e.g., Kāinga Ora) and Crown Agencies from headline debt figures ignores taxpayer liability. Because these entities are backed by the Crown, any default or capital shortfall falls back on central government balance sheets.
4. The Accounting Mechanics: Net Debt vs. Contractual Reality
To evaluate state solvency, one must distinguish between Accrual Asset Valuation and Contractual Debt Service Obligations.
Headline Net Debt = Gross Borrowings - Operating Cash + Advances + NZ Super Fund Equities
The Household Analogy
Consider a household that holds a $500,000 mortgage while maintaining $150,000 in a locked retirement account.
The Net Debt Interpretation: The household claims its "true debt" is $350,000.
The Financial Reality: The bank calculates monthly interest payments based on the full $500,000 principal. If market volatility reduces the retirement account to $100,000, the mortgage principal remains $500,000. The retirement assets cannot be used to pay off the mortgage without incurring severe tax penalties and bankrupting future retirement security.
In state accounting, subtracting investments like the NZ Super Fund to present a low "Net Debt" number operates on the same flaw. It treats unrealized, illiquid, or earmarked assets as immediate cash offsets against legal liabilities.
Conclusion
The presentation of sovereign fiscal health depends heavily on the chosen accounting framework. While "Net Debt" provides a theoretical view of total balance-sheet solvency, it obscures the real liabilities facing taxpayers.
Over the three-year period from 2023 to 2026, state borrowing did not merely grow by $15.7 billion. Under actual market contracts, direct government bond obligations expanded by $78.2 billion (+52.1%), while total state and agency obligations expanded by over $107 billion (+58.8% to +61.4%).
It amazes me the difference the number can show, $15.7 billion (Net) or $107 billion (Gross).